rstudio 管道符號
R基礎知識 (R Fundamentals)
Data analysis often involves many steps. A typical journey from raw data to results might involve filtering cases, transforming values, summarising data, and then running a statistical test. But how can we link all these steps together, while keeping our code efficient and readable? Enter the pipe, R’s most important operator for data processing.
數據分析通常涉及許多步驟。 從原始數據到結果的典型過程可能涉及篩選案例,轉換值,匯總數據,然后運行統計測試。 但是,如何在保持代碼高效和可讀性的同時將所有這些步驟鏈接在一起? 輸入管道,R是數據處理中最重要的運算符。
管道做什么? (What does the pipe do?)
The pipe operator, written as %>%, has been a longstanding feature of the magrittr package for R. It takes the output of one function and passes it into another function as an argument. This allows us to link a sequence of analysis steps.
管道運算符,寫為%>% ,是R的magrittr包的一個長期功能。它將一個函數的輸出傳遞給另一個函數作為參數。 這使我們可以鏈接一系列分析步驟。
To visualise this process, imagine a factory with different machines placed along a conveyor belt. Each machine is a function that performs a stage of our analysis, like filtering or transforming data. The pipe therefore works like a conveyor belt, transporting the output of one machine to another for further processing.
為了可視化此過程,請設想一家工廠,在傳送帶上放置不同的機器。 每臺機器都是執行我們分析階段的功能,例如過濾或轉換數據。 因此,管道就像傳送帶一樣工作,將一臺機器的輸出輸送到另一臺機器進行進一步處理。

We can see exactly how this works in a real example using the mtcars dataset. This dataset comes with base R, and contains data about the specs and fuel efficiency of various cars. The code below groups the data by the number of cylinders in each car, and then returns the mean miles-per-gallon of each group. Make sure to install the tidyverse suite of packages before running this code, since it includes both the pipe and the group_by and summarise functions.
我們可以使用mtcars數據集在一個實際示例中確切地看到它是如何工作的。 該數據集帶有基礎R,并包含有關各種汽車的規格和燃油效率的數據。 下面的代碼按每輛車的氣缸數對數據進行分組,然后返回每組的平均每加侖英里數。 請確保安裝的tidyverse運行此代碼之前包的套裝,因為它包括管道和group_by和summarise的功能。
library(tidyverse)result <- mtcars %>%
group_by(cyl) %>%
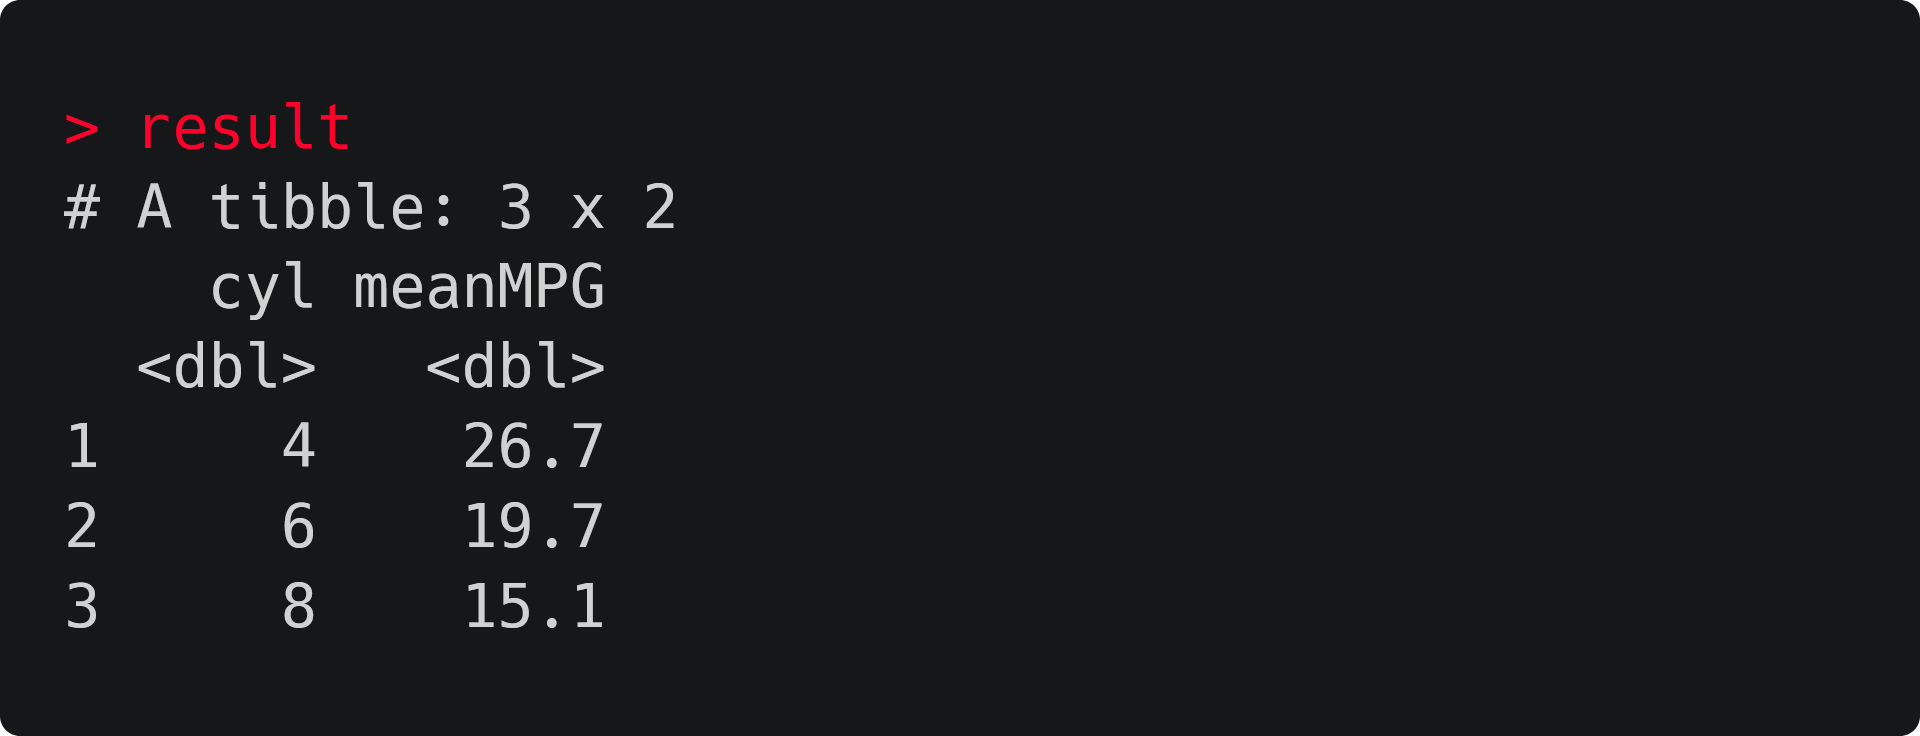
summarise(meanMPG = mean(mpg))The pipe operator feeds the mtcars dataframe into the group_by function, and then the output of group_by into summarise. The outcome of this process is stored in the tibble result, shown below.
管道操作符饋送mtcars數據幀到group_by函數,然后輸出group_by成summarise 。 該過程的結果存儲在小標題result ,如下所示。
Although this example is very simple, it demonstrates the basic pipe workflow. To go even further, I’d encourage playing around with this. Perhaps swap and add new functions to the ‘pipeline’ to gain more insight into the data. Doing this is the best way to understand how to work with the pipe. But why should we use it in the first place?
盡管此示例非常簡單,但是它演示了基本的管道工作流程。 為了更進一步,我鼓勵您嘗試一下。 也許交換并向“管道”添加新功能以獲得對數據的更多了解。 這樣做是了解如何使用管道的最佳方法。 但是為什么我們首先要使用它呢?
為什么要使用管道? (Why should we use the pipe?)
The pipe has a huge advantage over any other method of processing data in R: it makes processes easy to read. If we read %>% as “then”, the code from the previous section is very easy to digest as a set of instructions in plain English:
與R中的任何其他數據處理方法相比,管道具有巨大的優勢:它使過程易于閱讀。 如果我們將%>%讀為“ then”,那么上一節中的代碼很容易理解為一組簡單的英語說明:
Load tidyverse packagesTo get our result, take the mtcars dataframe, THEN
    Group its entries by number of cylinders, THEN
    Compute the mean miles-per-gallon of each group
This is far more readable than if we were to express this process in another way. The two options below are different ways of expressing the previous code, but both are worse for a few reasons.
這比我們用另一種方式來表達此過程更具可讀性。 下面的兩個選項是表示先前代碼的不同方式,但是由于一些原因,它們都較差。
# Option 1: Store each step in the process sequentially
result <- group_by(mtcars, cyl)
result <- summarise(result, meanMPG = mean(mpg))# Option 2: chain the functions together
> result <- summarise(
                group_by(mtcars, cyl),
                meanMPG = mean(mpg))
Option 1 gets the job done, but overwriting our output dataframe result in every line is problematic. For one, doing this for a procedure with lots of steps isn’t efficient and creates unnecessary repetition in the code. This repetition also makes it harder to identify exactly what is changing on each line in some cases.
選項1可以完成工作,但是覆蓋每一行的輸出數據幀result是有問題的。 首先,對具有很多步驟的過程執行此操作效率不高,并在代碼中造成不必要的重復。 這種重復還使得在某些情況下更難于準確地確定每條線上的變化。
Option 2 is even less practical. Nesting each function we want to use gets ugly fast, especially for long procedures. It’s hard to read, and harder to debug. This approach also makes it tough to see the order of steps in the analysis, which is bad news if you want to add new functionality later.
選項2甚至不那么實用。 嵌套我們要使用的每個函數很快就會很麻煩,特別是對于長過程。 它很難閱讀,也很難調試。 這種方法還使得很難查看分析中的步驟順序,如果您以后要添加新功能,則這是個壞消息。
It’s easy to see how using the pipe can substantially improve most R scripts. It makes analyses more readable, removes repetition, and simplifies the process of adding and modifying code. Is there anything it can’t do?
很容易看到使用管道如何可以大大改善大多數R腳本。 它使分析更具可讀性,消除重復,并簡化了添加和修改代碼的過程。 有什么不能做的嗎?
管道的局限性是什么? (What are the pipe’s limitations?)
Although it’s immensely handy, the pipe isn’t useful in every situation. Here are a few of its limitations:
盡管非常方便,但是管道并不是在每種情況下都有用。 這里有一些限制:
- Because it chains functions in a linear order, the pipe is less applicable to problems that include multidirectional relationships. 由于管道按線性順序鏈接功能,因此管道不適用于包含多向關系的問題。
- The pipe can only transport one object at a time, meaning it’s not so suited to functions that need multiple inputs or produce multiple outputs. 該管道一次只能傳送一個對象,這意味著它不適用于需要多個輸入或產生多個輸出的功能。
It doesn’t work with functions that use the current environment, nor functions that use lazy evaluation. Hadley Wickham’s book “R for Data Science” has a couple of examples of these.
它不適用于使用當前環境的函數,也不適用于使用惰性求值的函數。 哈德利·威克漢姆(Hadley Wickham)的書“ R for Data Science”(數據科學的R)中有兩個例子 。
These things are to be expected. Just as you’d struggle to build a house with a single tool, no lone feature will solve all your programming problems. But for what it’s worth, the pipe is still pretty versatile. Although this piece focused on the basics, there’s plenty of scope for using the pipe in advanced or creative ways. I’ve used it in a variety of scripts, data-focused and not, and it’s made my life easier in each instance.
這些事情是可以預期的。 就像您要用一個工具建造房屋一樣,沒有任何一項單獨的功能可以解決您所有的編程問題。 但是,就其價值而言,管道仍然具有多種用途。 盡管本文著重介紹基礎知識,但仍有許多以高級或創造性方式使用管道的范圍。 我已經在各種腳本中使用了它,而不是關注數據的腳本,這使我的生活在每種情況下都更加輕松。
額外的煙斗技巧! (Bonus pipe tips!)
Thanks for reading this far. As a reward, here are some bonus pipe tips and resources:
感謝您閱讀本文。 作為獎勵,這些是一些額外的管道技巧和資源:
Fed up of awkwardly typing
%>%? The slightly easier keyboard shortcutCTRL + SHIFT + Mwill print a pipe in RStudio!受夠了笨拙地輸入
%>%嗎? 稍微更簡單的鍵盤快捷鍵CTRL + SHIFT + M將在RStudio中打印管道!Need style guidance about how to format pipes? Check out this helpful section from ‘R Style Guide’ by Hadley Wickham.
需要有關如何格式化管道的樣式指導? 查閱Hadley Wickham撰寫的“ R風格指南”中的這一有用部分 。
Want to learn a bit more about the history of pipes in R? Check out this blog post from Adolfo álvarez.
想更多地了解R中管道的歷史嗎? 看看Adolfoálvarez的這篇博客文章 。
The pipe is great. It turns your code into a list of readable instructions and has lots of other practical benefits. So now you know about the pipe, use it, and watch your code turn into a narrative.
管子很棒。 它將您的代碼轉換為可讀指令列表,并具有許多其他實際好處。 因此,現在您知道了管道,使用了管道,然后看著代碼變成了敘述。
翻譯自: https://towardsdatascience.com/an-introduction-to-the-pipe-in-r-823090760d64
rstudio 管道符號
本文來自互聯網用戶投稿,該文觀點僅代表作者本人,不代表本站立場。本站僅提供信息存儲空間服務,不擁有所有權,不承擔相關法律責任。 如若轉載,請注明出處:http://www.pswp.cn/news/389320.shtml 繁體地址,請注明出處:http://hk.pswp.cn/news/389320.shtml 英文地址,請注明出處:http://en.pswp.cn/news/389320.shtml
如若內容造成侵權/違法違規/事實不符,請聯系多彩編程網進行投訴反饋email:809451989@qq.com,一經查實,立即刪除!相關文章

蒙特卡洛模擬預測股票_使用蒙特卡洛模擬來預測極端天氣事件

iOS之UITraitCollection

直方圖繪制與直方圖均衡化實現

eclipse警告與報錯的修復

時間序列因果關系_分析具有因果關系的時間序列干預:貨幣波動

微生物 研究_微生物監測如何工作,為何如此重要

Linux shell 腳本SDK 打包實踐, 收集assets和apk, 上傳FTP

opencv:卷積涉及的基礎概念,Sobel邊緣檢測代碼實現及卷積填充模式

怎么查這個文件在linux下的哪個目錄

無法從套接字中獲取更多數據_數據科學中應引起更多關注的一個組成部分

web數據交互_通過體育運動使用定制的交互式Web應用程序數據科學探索任何數據...

C# .net 對圖片操作

數據類型之Integer與int
思想及實現)
PCA(主成分分析)思想及實現

【安富萊二代示波器教程】第8章 示波器設計—測量功能

深度學習數據更換背景_開始學習數據科學的最佳方法是了解其背景

熊貓數據集_用熊貓掌握數據聚合

IOS CALayer的屬性和使用

GridView詳解
