時間序列因果關系
When examining a time series, it is quite common to have an intervention influence that series at a particular point.
在檢查時間序列時,在特定時間點對該序列產生干預影響是很常見的。
Some examples of this could be:
例如:
- An advertising campaign that results in a significant change in sales 導致銷售發生重大變化的廣告活動
- A positive change in traffic policy that results in lower road deaths 交通政策的積極變化,可減少道路死亡人數
- A change in economic policy that affects asset prices 影響資產價格的經濟政策變化
The problem with analysing the effects of interventions is that one is then unable to examine how that series would have trended without that intervention.
分析干預措施效果的問題在于,如果沒有該干預措施,人們將無法檢查該系列趨勢。
For instance, suppose that a company implements an advertising campaign with the intent of boosting sales. While sales data can be recorded post-intervention — it is not possible to say what the sales would have been without that intervention.
例如,假設一家公司實施了旨在促進銷售的廣告活動。 雖然銷售數據可以記錄后干預-這是不可能說什么銷售本來沒有這種干預。
我們的例子 (Our Example)
For this example, let us consider the impact of an interest rate change on currency fluctuations.
對于此示例,讓我們考慮利率變化對貨幣波動的影響 。
When a central bank manipulates interest rates — this is hypothesised to have a significant impact on a currency as it affects the perceived value of that currency relative to others in the market.
當中央銀行操縱利率時,假設這會對貨幣產生重大影響,因為它會影響該貨幣相對于市場上其他貨幣的感知價值。
However, what if we wish to quantify such an impact? Let’s see how this works with the causalimpact package. This package was originally developed by Google for R, but we will use the Python version (pycasualimpact) in this example.
但是,如果我們希望量化這種影響怎么辦? 讓我們看看它如何與causalimpact包一起工作。 該軟件包最初是由Google for R開發的,但是在此示例中,我們將使用Python版本(pycasualimpact)。
Let’s consider fluctuations in the GBP/USD for the year 2017.
讓我們考慮一下2017年英鎊/美元的波動。
In November 2017, the Bank of England decided to raise interest rates.
2017年11月,英格蘭銀行決定提高利率。
We will use causalimpact in an attempt to investigate:
我們將使用因果影響來調查:
- what the forecasted GBP/USD rate would have been in the absence of such an intervention 如果不采取這種干預措施,英鎊/美元的匯率將是多少?
- whether such an intervention is significant and has affected the currency level 此類干預是否重大并已影響貨幣水平
In order to determine whether such an intervention has a significant effect on a time series — we must use a suitable covariate (X). This covariate must not be affected by the intervention.
為了確定此類干預是否會對時間序列產生重大影響,我們必須使用適當的協變量(X)。 此協變量不得受到干預的影響。
For instance, we can see that for the year 2017, the European Central Bank left interest rates unchanged (and have done since):
例如,我們可以看到,歐洲中央銀行在2017年維持利率不變(此后一直這樣做):
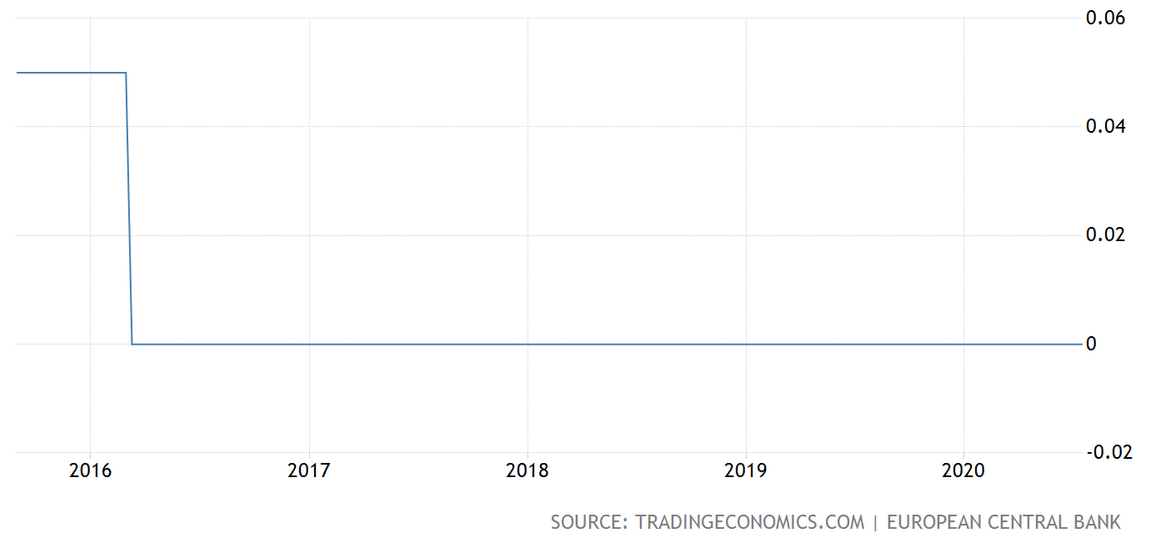
Taking this into account, the EUR/USD will be used as the covariate for this example.
考慮到這一點,本示例將使用EUR / USD作為協變量。
X = eurusd
y = gbpusd
While it is hypothesised that the currency will be affected by fluctuations in the greenback as well as many other macroeconomic conditions — it is assumed that the Bank of England intervention does not impact the EUR/USD.
假設該貨幣將受到美元波動以及許多其他宏觀經濟狀況的影響-假設英格蘭銀行的干預不會影響歐元/美元。
分析 (Analysis)
The relevant currency pairs are downloaded from the FRED database using Quandl:
使用Quandl從FRED數據庫下載相關貨幣對:
>>> eurusd = quandl.get("FRED/DEXUSEU", start_date='2017-01-01', end_date='2018-01-01', api_key='enter_api_key')>>> gbpusd = quandl.get("FRED/DEXUSUK", start_date='2017-01-01', end_date='2018-01-01', api_key='enter_api_key')
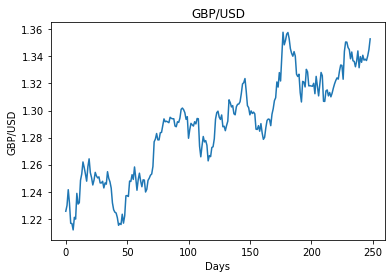
gbpusdHere is a plot of the two currency pairs:
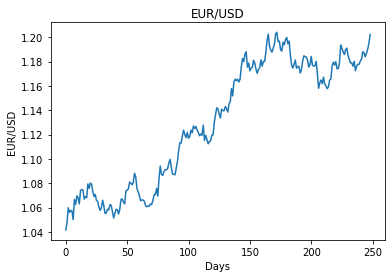
這是兩個貨幣對的圖表:
英鎊/美元 (GBP/USD)
歐元/美元 (EUR/USD)
With the rate decision by the Bank of England having been taken on 2nd November 2017, t = 0 to 229 is defined as the pre-period (before intervention) and t = 230 to 248 is defined as the post-period (after intervention).
由于英格蘭銀行已于2017年11月2日做出利率決定,因此將t = 0到229定義為前期(干預之前),將t = 230到248定義為后期(干預之后) 。
data = pd.DataFrame({'y': y, 'X': X}, columns=['y', 'X'])
pre_period = [0, 229]
post_period = [230, 248]
According to the official GitHub for this package, this model “uses a classical Kalman Filter approach for solving the statespace equations”.
根據該軟件包的官方GitHub的說法,該模型“使用經典的Kalman濾波方法來求解狀態空間方程”。
The posterior inference can be generated as follows:
可以如下生成后驗推斷:
>>> ci = CausalImpact(data, pre_period, post_period)
>>> print(ci.summary())
>>> print(ci.summary(output='report'))
>>> ci.plot()
Here is the generated output:
這是生成的輸出:
Posterior Inference {Causal Impact}
                          Average            Cumulative
Actual                    1.34               25.46
Prediction (s.d.)         1.32 (0.0)         25.17 (0.08)
95% CI                    [1.32, 1.33]       [25.01, 25.33]
Absolute effect (s.d.)    0.02 (0.0)         0.29 (0.08)
95% CI                    [0.01, 0.02]       [0.13, 0.45]
Relative effect (s.d.)    1.15% (0.32%)      1.15% (0.32%)
95% CI                    [0.52%, 1.77%]     [0.52%, 1.77%]
Posterior tail-area probability p: 0.0
Posterior prob. of a causal effect: 100.0%
According to the above findings, the actual GBP/USD rate comes in at 1.34, while the rate without the intervention would have been 1.32.
根據上述發現,英鎊/美元的實際匯率為1.34 ,而沒有干預的匯率將為1.32 。
Moreover, the model indicates that there is a 100% posterior probability of a causal effect.
此外,該模型表明因果關系的后驗概率為100%。
When analysing the more detailed report, the output also states:
在分析更詳細的報告時,輸出還指出:
The probability of obtaining this effect by chance is very small(Bayesian one-sided tail-area probability p = 0.0).This means the causal effect can be considered statisticallysignificant.
偶然獲得此效應的可能性很小(貝葉斯單側尾部區域概率p = 0.0)。這意味著因果效應在統計上是有意義的。
From this standpoint, the evidence suggests that the GBP/USD trended higher than it would have done without an interest rate rise. Here is an overview of the actual rate vs predictions:
從這個角度來看,有證據表明,英鎊/美元的趨勢要高于沒有加息的情況。 以下是實際費率與預測的概述:
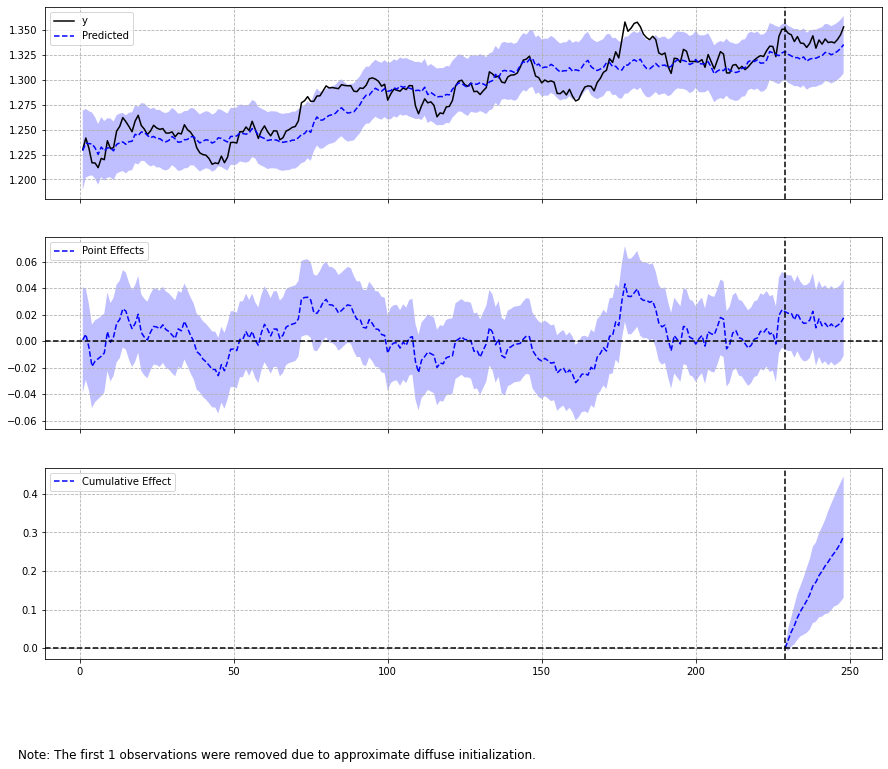
As mentioned, Python uses a different approach than R in generating forecasts without an intervention — the latter relying more on a Bayesian approach that emphasises user prior knowledge. Indeed, one could try both methods to verify if the forecasts being generated coincide.
如前所述,Python使用R的方法與R不同,無需干預即可生成預測-后者更多地依賴于強調用戶先驗知識的貝葉斯方法。 確實,可以嘗試兩種方法來驗證所生成的預測是否一致。
結論 (Conclusion)
This has been an introductory example to the causalimpact library and how the effects of interventions can be examined across a time series.
這是因果影響庫的介紹性示例,以及如何在整個時間序列中檢查干預措施的影響。
Many thanks for your time, and any questions or feedback are greatly welcomed.
非常感謝您的寶貴時間,我們歡迎您提出任何問題或反饋。
The Jupyter Notebook for this example is available at the MGCodesandStats repository as referenced below.
MGCodesandStats存儲庫中提供了此示例的Jupyter Notebook,如下所述。
Disclaimer: This article is written on an “as is” basis and without warranty. It was written with the intention of providing an overview of data science concepts, and should not be interpreted as investment advice, or any other sort of professional advice.
免責聲明:本文按“原樣”撰寫,不作任何擔保。 本文檔旨在概述數據科學概念,不應將其解釋為投資建議或任何其他形式的專業建議。
翻譯自: https://towardsdatascience.com/analysing-time-series-interventions-with-causalimpact-currency-fluctuations-e6ab14a30768
時間序列因果關系
本文來自互聯網用戶投稿,該文觀點僅代表作者本人,不代表本站立場。本站僅提供信息存儲空間服務,不擁有所有權,不承擔相關法律責任。 如若轉載,請注明出處:http://www.pswp.cn/news/389315.shtml 繁體地址,請注明出處:http://hk.pswp.cn/news/389315.shtml 英文地址,請注明出處:http://en.pswp.cn/news/389315.shtml
如若內容造成侵權/違法違規/事實不符,請聯系多彩編程網進行投訴反饋email:809451989@qq.com,一經查實,立即刪除!相關文章

微生物 研究_微生物監測如何工作,為何如此重要

Linux shell 腳本SDK 打包實踐, 收集assets和apk, 上傳FTP

opencv:卷積涉及的基礎概念,Sobel邊緣檢測代碼實現及卷積填充模式

怎么查這個文件在linux下的哪個目錄

無法從套接字中獲取更多數據_數據科學中應引起更多關注的一個組成部分

web數據交互_通過體育運動使用定制的交互式Web應用程序數據科學探索任何數據...

C# .net 對圖片操作

數據類型之Integer與int
思想及實現)
PCA(主成分分析)思想及實現

【安富萊二代示波器教程】第8章 示波器設計—測量功能

深度學習數據更換背景_開始學習數據科學的最佳方法是了解其背景

熊貓數據集_用熊貓掌握數據聚合

IOS CALayer的屬性和使用

GridView詳解

訪問模型參數,初始化模型參數,共享模型參數方法

QZEZ第一屆“飯吉圓”杯程序設計競賽

談談數據分析 caoz_讓我們談談開放數據…

數據創造價值_展示數據并創造價值

