熊貓數據集
Data aggregation is the process of gathering data and expressing it in a summary form. This typically corresponds to summary statistics for numerical and categorical variables in a data set. In this post we will discuss how to aggregate data using pandas and generate insightful summary statistics.
數據聚合是收集數據并以摘要形式表示的過程。 這通常對應于數據集中數字和分類變量的摘要統計量。 在這篇文章中,我們將討論如何使用熊貓聚合數據并生成有洞察力的摘要統計信息。
Let’s get started!
讓我們開始吧!
For our purposes, we will be working with The Wines Reviews data set, which can be found here.
為了我們的目的,我們將使用“葡萄酒評論”數據集,可在此處找到。
To start, let’s read our data into a Pandas data frame:
首先,讓我們將數據讀取到Pandas數據框中:
import pandas as pd
df = pd.read_csv("winemag-data-130k-v2.csv")
Next, let’s print the first five rows of data:
接下來,讓我們打印數據的前五行:
print(df.head())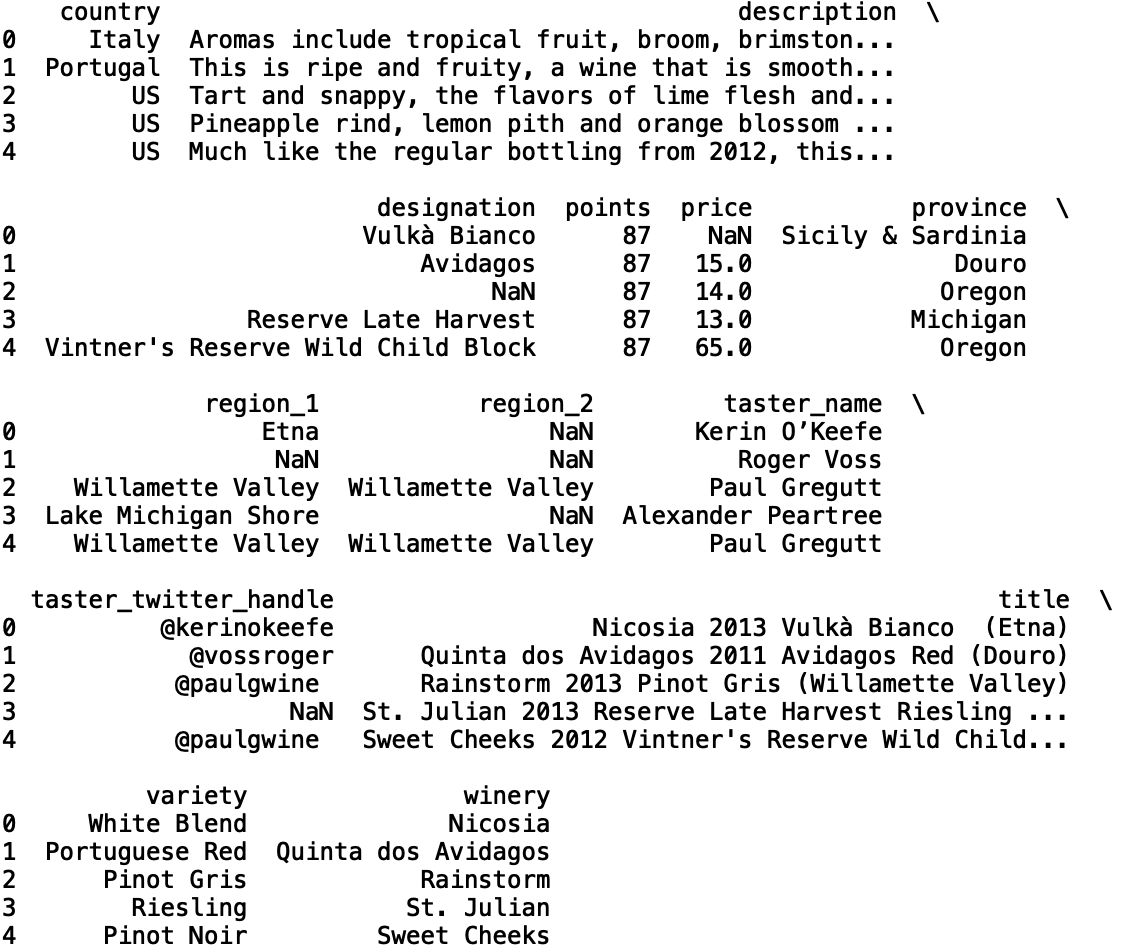
使用DESCRIBE()方法 (USING THE DESCRIBE() METHOD)
The ‘describe()’ method is a basic method that will allow us to pull summary statistics for columns in our data. Let’s use the ‘describe()’ method on the prices of wines:
'describe()'方法是一種基本方法,它使我們能夠提取數據中列的摘要統計信息。 讓我們對葡萄酒的價格使用'describe()'方法:
print(df['price'].describe())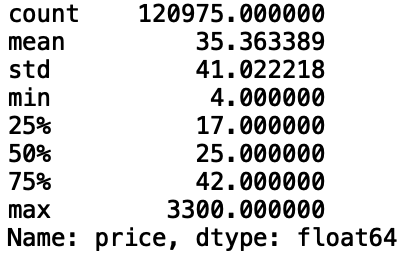
We see that the ‘count’, number of non-null values, of wine prices is 120,975. The mean price of wines is $35 with a standard deviation of $41. The minimum value of the price of wine is $4 and the maximum is $3300. The ‘describe()’ method also provides percentiles. Here, 25% of wines prices are below $17, 50% are below $25, and 75% are below $42.
我們看到葡萄酒價格的“計數”(非空值數量)為120,975。 葡萄酒的平ASP格為35美元,標準差為41美元。 葡萄酒價格的最小值為$ 4,最大值為$ 3300。 'describe()'方法還提供百分位數。 在這里,有25%的葡萄酒價格低于17美元,有50%的葡萄酒低于25美元,有75%的葡萄酒低于42美元。
Let’s look at the summary statistics using ‘describe()’ on the ‘points’ column:
讓我們在“點”列上使用“ describe()”查看摘要統計信息:
print(df['points'].describe())
We see that the number of non-null values of points is 129,971, which happens to be the length of the data frame. The mean points is 88 with a standard deviation of 3. The minimum value of the points of wine is 80 and the maximum is 100. For the percentiles, 25% of wines points are below 86, 50% are below 88, and 75% are below 91.
我們看到點的非空值的數量是129,971,恰好是數據幀的長度。 平均值為88,標準偏差為3。葡萄酒的最小值為80,最大值為100。對于百分位數,25%的葡萄酒分數低于86,50%的分數低于88,而75%低于91。
使用GROUPBY()方法 (USING THE GROUPBY() METHOD)
You can also use the ‘groupby()’ to aggregate data. For example, if we wanted to look at the average price of wine for each variety of wine, we can do the following:
您也可以使用“ groupby()”來匯總數據。 例如,如果我們要查看每種葡萄酒的平ASP格,我們可以執行以下操作:
print(df['price'].groupby(df['variety']).mean().head())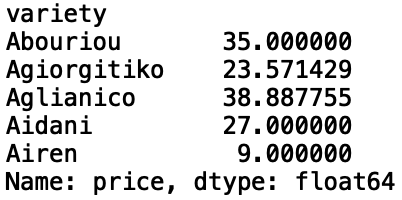
We see that the ‘Abouriou’ wine variety has a mean of $35, ‘Agiorgitiko’ has a mean of $23 and so forth. We can also display the sorted values:
我們看到“ Abouriou”葡萄酒的ASP為35美元,“ Agiorgitiko”葡萄酒的ASP為23美元,依此類推。 我們還可以顯示排序后的值:
print(df['price'].groupby(df['variety']).mean().sort_values(ascending = False).head())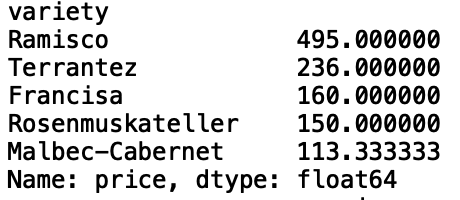
Let’s look at the sorted mean prices for each ‘province’:
讓我們看一下每個“省”的排序平ASP格:
print(df['price'].groupby(df['province']).mean().sort_values(ascending = False).head())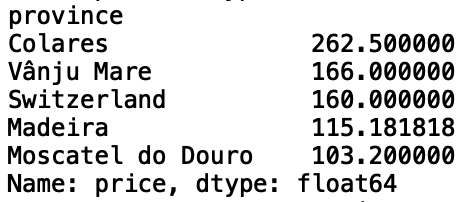
We can also look at more than one column. Let’s look at the mean prices and points across ‘provinces’:
我們還可以查看不止一列。 讓我們看一下“省”的平ASP格和點數:
print(df[['price', 'points']].groupby(df.province).mean().head())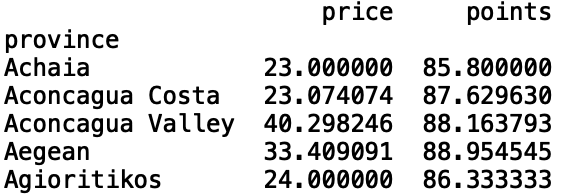
I’ll stop here but I encourage you to play around with the data and code yourself.
我將在這里停止,但我鼓勵您嘗試使用數據并自己編寫代碼。
結論 (CONCLUSION)
To summarize, in this post we discussed how to aggregate data using pandas. First, we went over how to use the ‘describe()’ method to generate summary statistics such as mean, standard deviation, minimum, maximum and percentiles for data columns. We then went over how to use the ‘groupby()’ method to generate statistics for specific categorical variables, such as the mean price in each province and the mean price for each variety. I hope you found this post useful/interesting. The code from this post is available on GitHub. Thank you for reading!
總而言之,在本文中,我們討論了如何使用熊貓聚合數據。 首先,我們討論了如何使用“ describe()”方法生成匯總統計信息,例如數據列的均值,標準差,最小值,最大值和百分位數。 然后,我們討論了如何使用“ groupby()”方法來生成特定類別變量的統計信息,例如每個省的平ASP格和每個品種的平ASP格。 我希望您發現這篇文章有用/有趣。 這篇文章中的代碼可在GitHub上找到 。 感謝您的閱讀!
翻譯自: https://towardsdatascience.com/mastering-data-aggregation-with-pandas-36d485fb613c
熊貓數據集
本文來自互聯網用戶投稿,該文觀點僅代表作者本人,不代表本站立場。本站僅提供信息存儲空間服務,不擁有所有權,不承擔相關法律責任。 如若轉載,請注明出處:http://www.pswp.cn/news/389303.shtml 繁體地址,請注明出處:http://hk.pswp.cn/news/389303.shtml 英文地址,請注明出處:http://en.pswp.cn/news/389303.shtml
如若內容造成侵權/違法違規/事實不符,請聯系多彩編程網進行投訴反饋email:809451989@qq.com,一經查實,立即刪除!相關文章

IOS CALayer的屬性和使用

GridView詳解

訪問模型參數,初始化模型參數,共享模型參數方法

QZEZ第一屆“飯吉圓”杯程序設計競賽

談談數據分析 caoz_讓我們談談開放數據…

數據創造價值_展示數據并創造價值

Java入門系列-22-IO流


卷積神經網絡——各種網絡的簡潔介紹和實現

數據中臺是下一代大數據_全棧數據科學:下一代數據科學家群體

net如何判斷瀏覽器的類別


北方工業大學gpa計算_北方大學聯盟倉庫的探索性分析
)
泰坦尼克數據集預測分析_探索性數據分析-泰坦尼克號數據集案例研究(第二部分)

各種數據庫連接的總結


