部署 prometheus
安裝
# 1,下載
wget https://github.com/prometheus/prometheus/releases/download/v2.45.1/prometheus-3.5.0.linux-amd64.tar.gz# 2,部署
tar  -zxvf  prometheus-3.5.0.linux-amd64.tar.gz  -C   /opt/
cd   /opt/
mv  ./prometheus-3.5.0.linux-amd64   prometheus# 3,驗證
[root@prometheus prometheus]#  cd   /opt/prometheus
[root@prometheus prometheus]# ./prometheus  --version
prometheus, version 3.5.0 (branch: HEAD, revision: 8be3a9560fbdd18a94dedec4b747c35178177202)build user:       root@4451b64cb451build date:       20250714-16:15:23go version:       go1.24.5platform:         linux/amd64tags:             netgo,builtinassets# 4,配置用戶
groupadd  prometheus
useradd  -g  prometheus -s /sbin/nologin prometheus
chown -R  prometheus:prometheus /opt/prometheus/# 5,創建prometheus運行數據目錄
mkdir  -p  /opt/prometheus/data
chown -R prometheus:prometheus /opt/prometheus/data
配置文件
[root@prometheus prometheus]# cat prometheus.yml
# my global config
global:scrape_interval: 15s # 默認15s 全局每次數據收集的間隔 minute.evaluation_interval: 15s # 規則掃描時間間隔是15秒,默認不填寫是 1分鐘 minute.# scrape_timeout is set to the global default (10s). # 超時時間# Alertmanager configuration
alerting:alertmanagers:- static_configs:- targets:# - alertmanager:9093# Load rules once and periodically evaluate them according to the global 'evaluation_interval'.
rule_files:# - "first_rules.yml"# - "second_rules.yml"# A scrape configuration containing exactly one endpoint to scrape:
# Here it's Prometheus itself.
scrape_configs: #默認規則# The job name is added as a label `job=<job_name>` to any timeseries scraped from this config.- job_name: "prometheus"# metrics_path defaults to '/metrics'# scheme defaults to 'http'.static_configs:- targets: ["localhost:9090"]# The label name is added as a label `label_name=<label_value>` to any timeseries scraped from this config.labels:app: "prometheus"
創建腳本systemd管理
vim  /usr/lib/systemd/system/prometheus.service[Unit]
Description=Prometheus
After=network.target[Service]
Type=simple
User=prometheus
Group=prometheus
ExecStart=/opt/prometheus/prometheus \
--config.file=/opt/prometheus/prometheus.yml \
--storage.tsdb.path=/opt/prometheus/data \
--storage.tsdb.retention.time=15d \
--web.console.templates=/opt/prometheus/consoles \
--web.console.libraries=/opt/prometheus/console_libraries \
--web.max-connections=512 \
--web.external-url "http://自己服務器IP地址:9090" \
--web.listen-address "0.0.0.0:9090" \
--web.enable-admin-api \
--web.enable-lifecycle
Restart=on-failure[Install]
WantedBy=multi-user.target
啟動驗證
systemctl daemon-reload
systemctl enable prometheus
systemctl start  prometheus
systemctl status prometheus
# 查看服務端口
ss -tunlp | grep 9090
訪問 http://自己服務器IP:9090
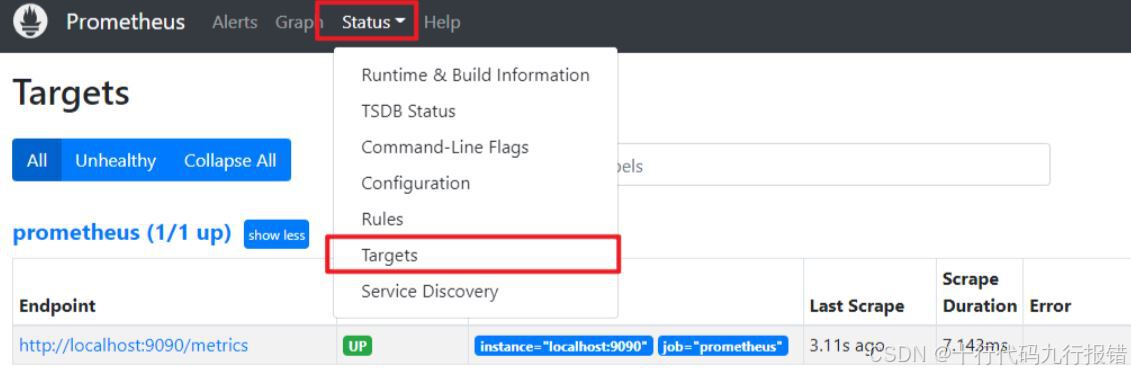
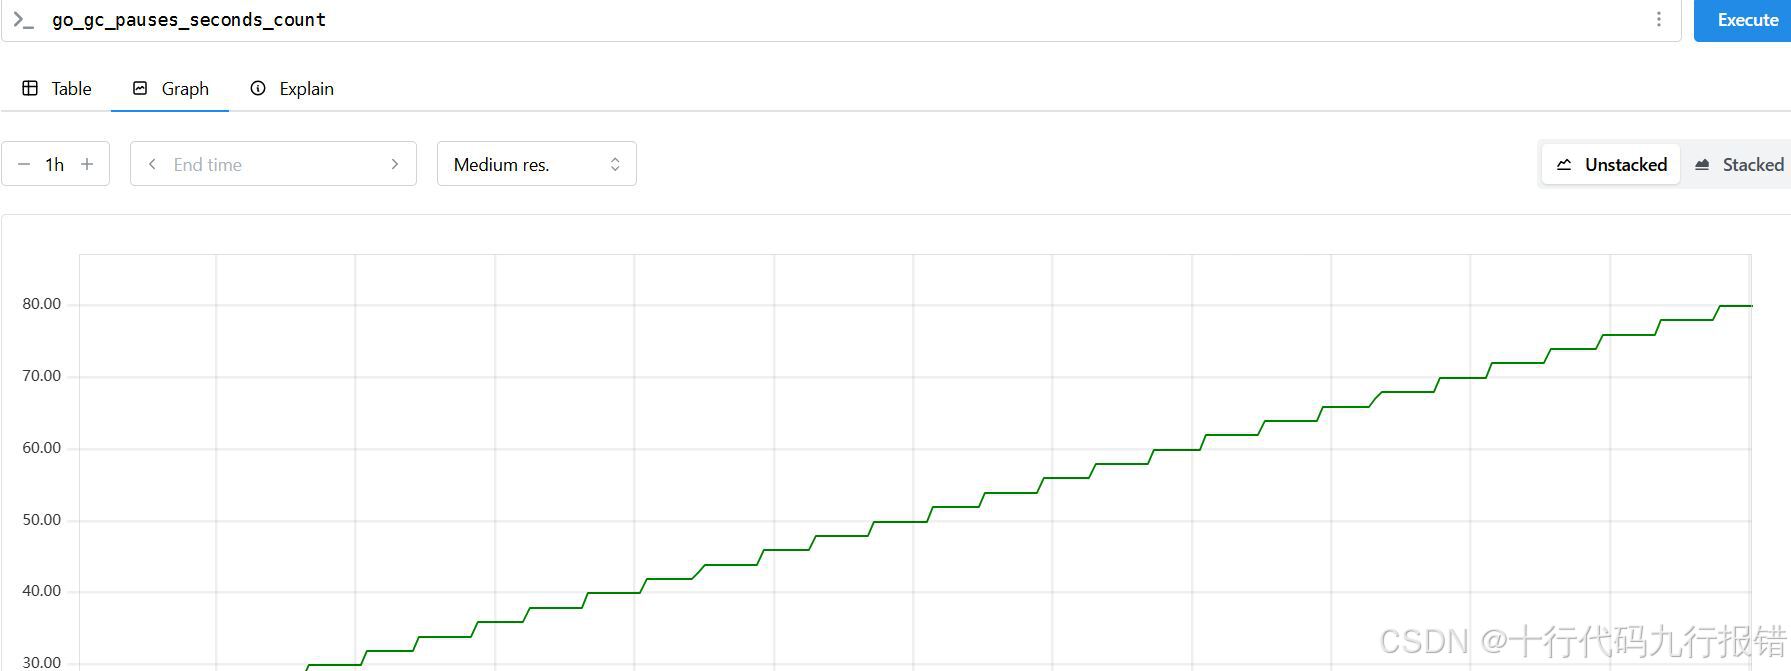
點擊Endpoint目標的值,再從exporter具體能抓到的數據,隨便復制一個值就好,比如go_gc_pauses_seconds_count
部署node_exporter
Node_exporter收集機器的系統數據,采用prometheus官方提供的exporte
安裝
# 安裝node_exporter
wget https://github.com/prometheus/node_exporter/releases/download/v1.6.1/node_exporter-1.6.1.linux-amd64.tar.gz
tar -zxvf node_exporter-1.6.1.linux-amd64.tar.gz -C /opt/
cd /opt/
mv node_exporter-1.6.1.linux-amd64/  node_exporter# 添加用戶
groupadd prometheus
useradd -g prometheus -s /sbin/nologin prometheus
chown -R prometheus:prometheus /opt/node_exporter# 設置開機啟動
vim  /lib/systemd/system/node_exporter.service
[Unit]
Description=Prometheus Node_exporter
After=network.target prometheus.service[Service]
Type=simple
User=prometheus
Group=prometheus
ExecStart=/opt/node_exporter/node_exporter --web.listen-address=0.0.0.0:9101
Restart=on-failure[Install]
WantedBy=multi-user.target
設置啟動服務
systemctl daemon-reload
systemctl enable node_exporter
systemctl start node_exporter
添加 node_exporter到配置文件
cat >> prometheus.yml <<EOF- job_name: 'node'static_configs:- targets: ['IP地址:9101']
EOF
注意:這里添加的一定要在 /opt/prometheus/prometheus.yml文件中操作,否則會導致后續prometheus中沒有node節點,grafana表盤中無數據
重啟prometheus服務
systemctl restart prometheus.service
驗證
查看監控指標 http://IP地址:9101/metrics
這里跟部署prometheus啟動驗證一樣,隨機拿一個數據驗證。
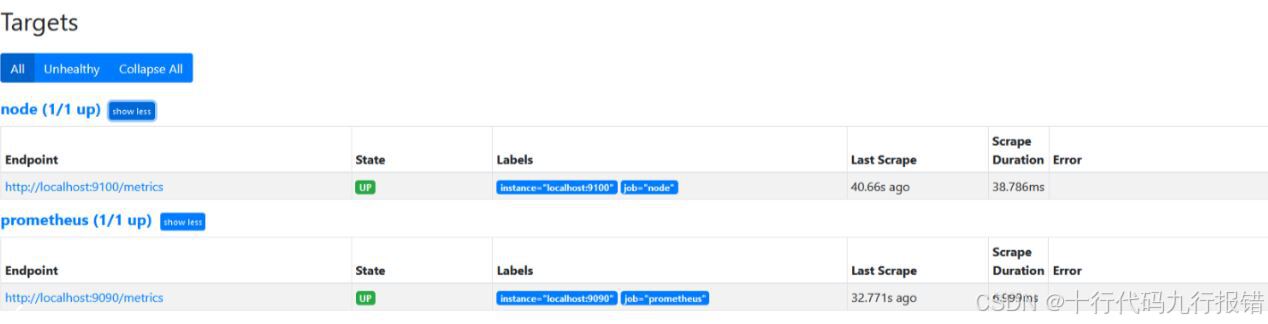
查看target
部署grafana
安裝配置
# 安裝
wget https://dl.grafana.com/enterprise/release/grafana-enterprise-10.2.0-1.x86_64.rpm
yum -y install grafana-enterprise-10.2.0-1.x86_64.rpm# 設置開啟自啟
systemctl enable grafana-server
systemctl start grafana-server
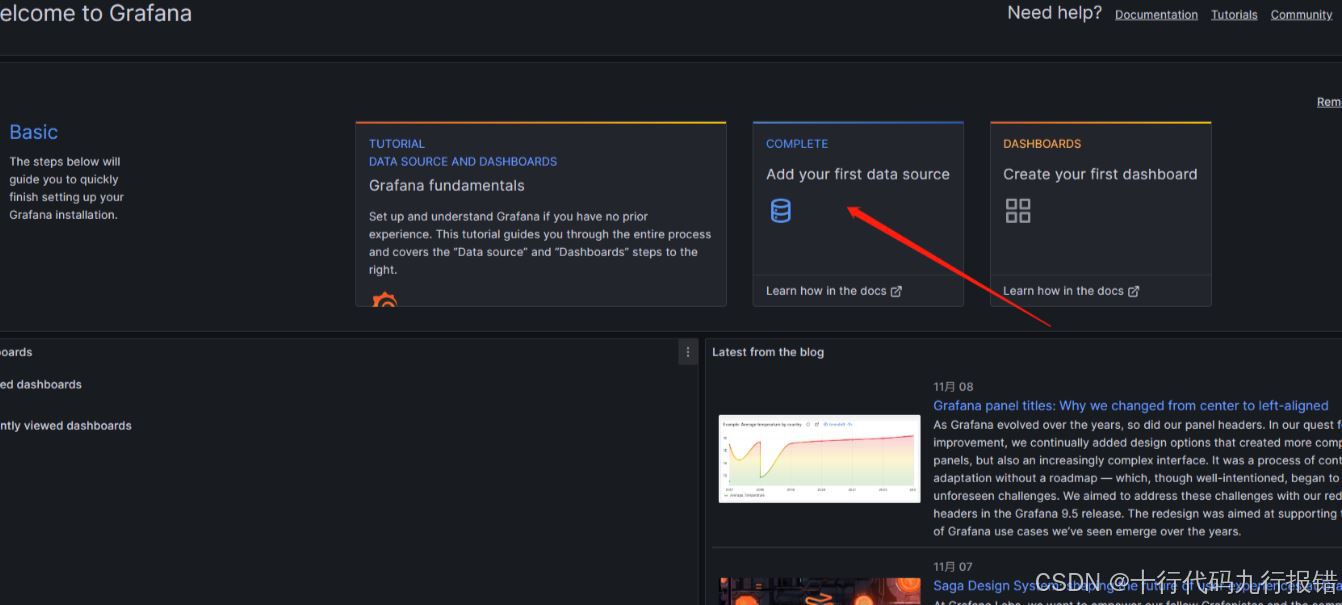
登錄訪問
訪問:http://IP地址:3000,默認賬號/密碼:admin/admin,首次登陸需要修改默認的管理員密碼
添加數據
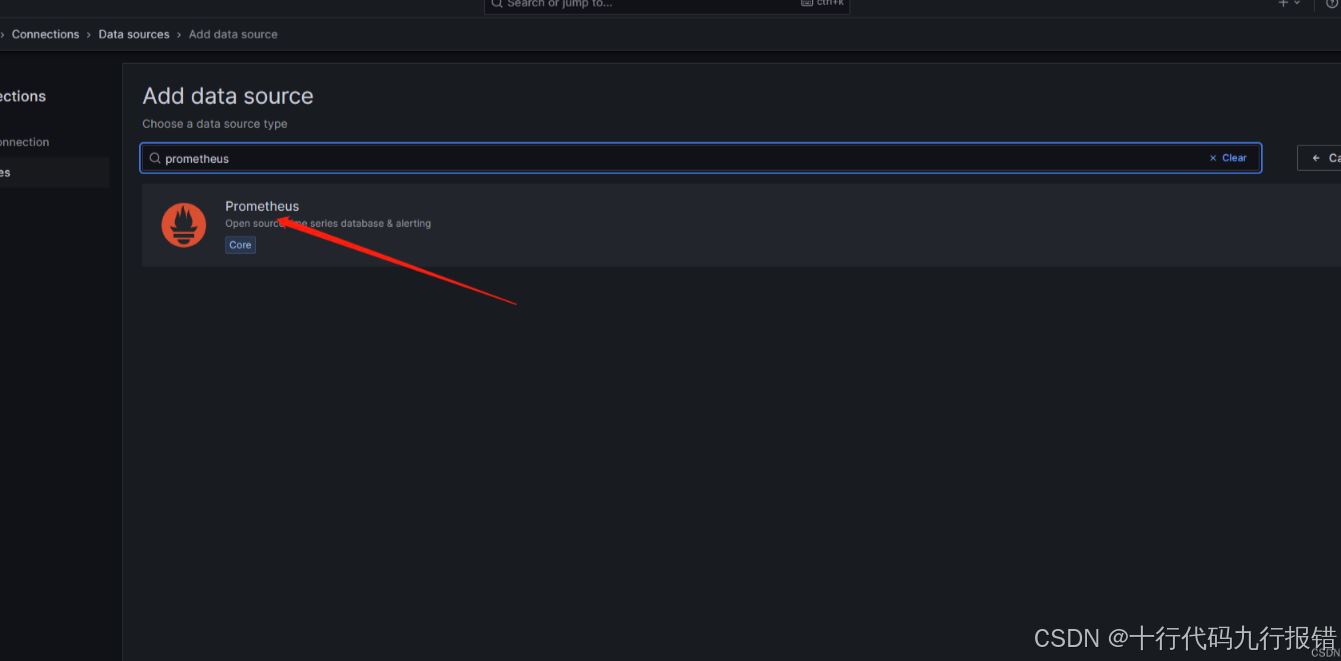
這里URL填http:localhost:9090/或者http:IP地址:9090/都行
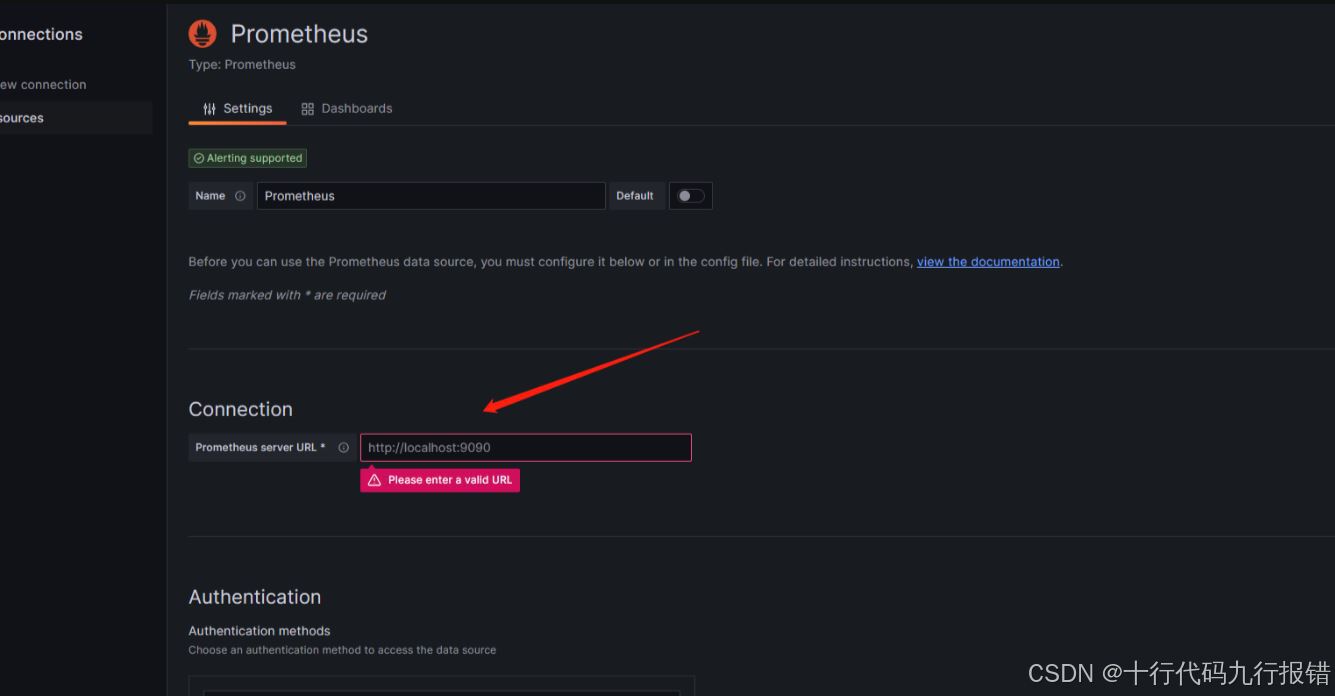
然后點擊保存

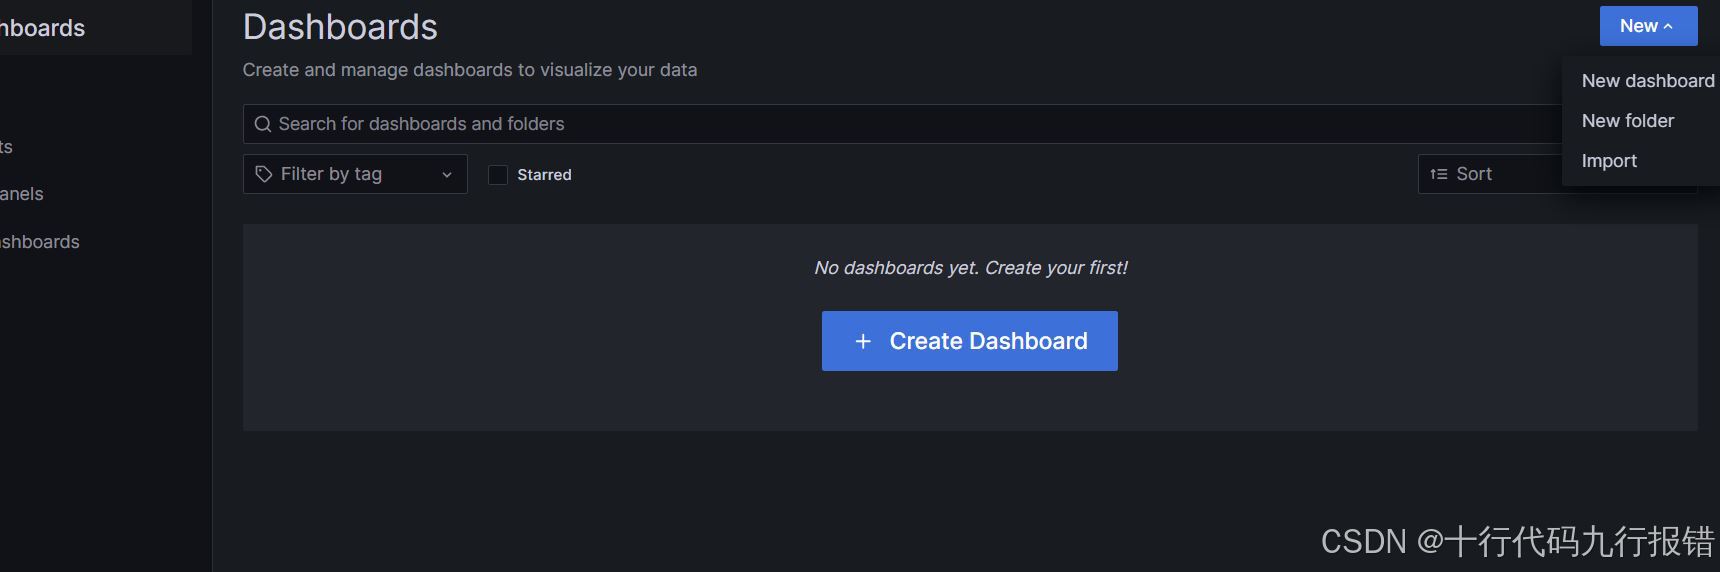
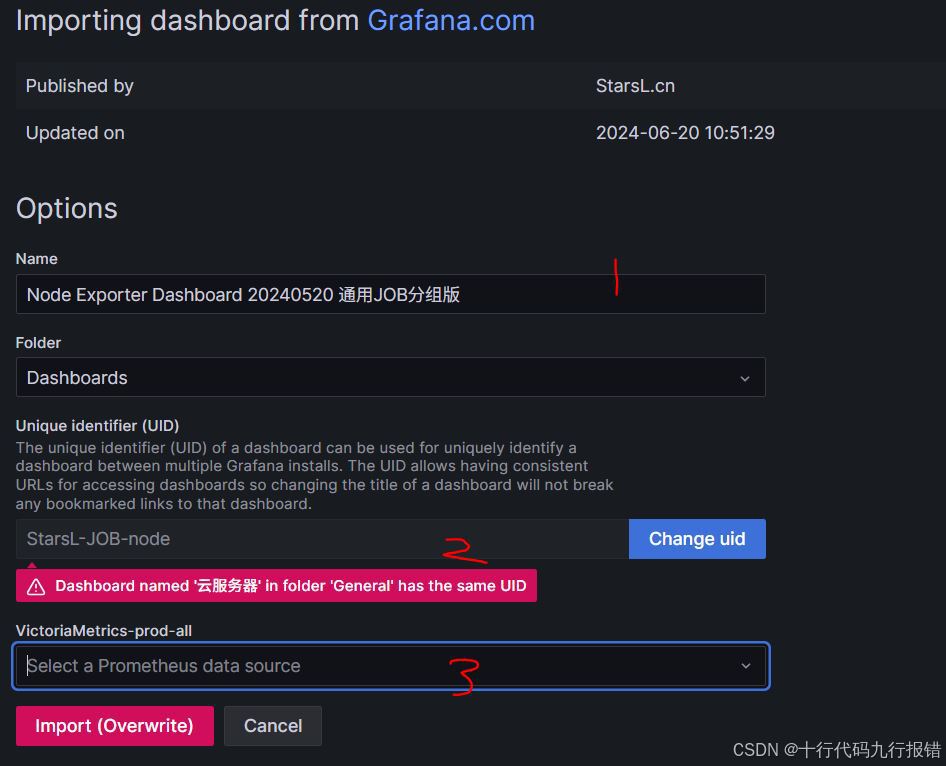
導入儀表盤
new->import
這里1是填官方提供的表盤形式,填寫11074或者16098都行
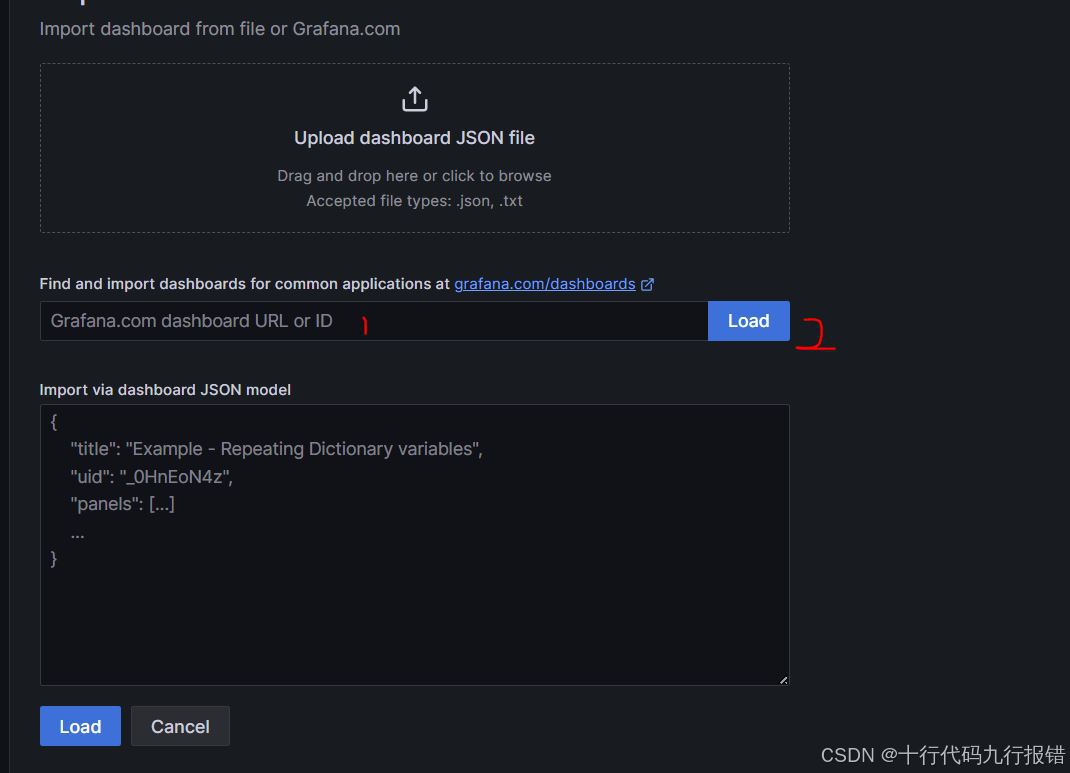
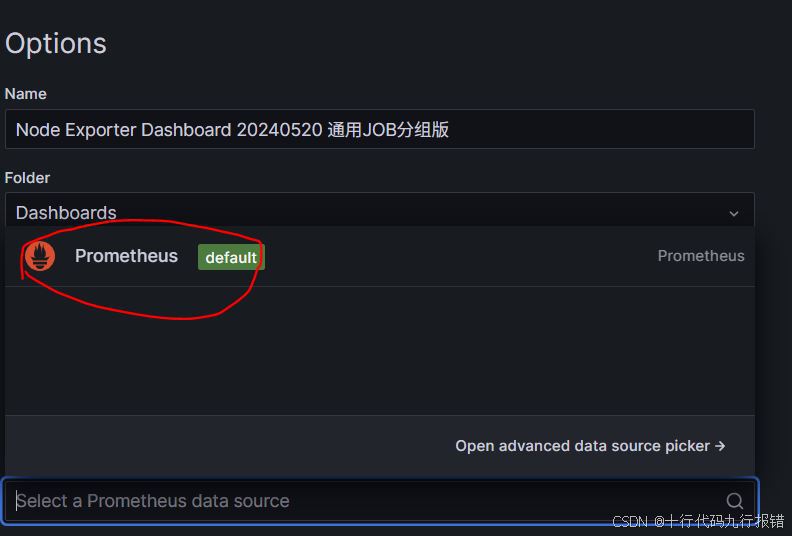
這里名字隨便填,2默認,3點擊后有個prometheus標志出來點擊就行。然后import
可能遇到的問題
xshell無法傳文件給遠程主機
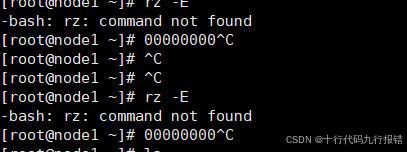
原因:遠程服務器中沒有安裝響應相對應的驅動
解決辦法:服務器安轉就行
yum install lrzsz下載超時

原因:服務器訪問github比較慢或者訪問不上
解決方法:修改網絡文件或者直接下載相應的文件然后用xshell等遠程工具上傳到服務器
grafana儀表盤無數據
檢查部署node_exporter步驟時,驗證的時候是否會有node節點出現。沒有出現則在配置node_exporter文件步驟中,prometheus.yml文件是否配置正確,注意scrape_configs:節點下
- job_name: "prometheus"# metrics_path defaults to '/metrics'# scheme defaults to 'http'.static_configs:- targets: ["IP地址:9090"]# The label name is added as a label `label_name=<label_value>` to any timeseries scraped from this config.labels:app: "prometheus"- job_name: 'node'static_configs:- targets: ['IP地址:9101']在grafana中dashboards中url是否配置正確
無法打開prometheus和grafana網站
用的阿里云服務器做的實驗的話,查看安全組是否放行了9090,9101等這些端口。
參考文章
prometheus+grafana部署

:Table類型高效用法與數據處理實戰)

)
![[CISCN2019 總決賽 Day2 Web1]Easyweb](http://pic.xiahunao.cn/[CISCN2019 總決賽 Day2 Web1]Easyweb)
詳解)


![【python實用小腳本-205】[HR揭秘]手工黨逐行查Bug的終結者|Python版代碼質量“CT機”加速器(建議收藏)](http://pic.xiahunao.cn/【python實用小腳本-205】[HR揭秘]手工黨逐行查Bug的終結者|Python版代碼質量“CT機”加速器(建議收藏))


——網絡連接場景的 C++ 實戰)


