離群值如何處理
ARIMA models can be quite adept when it comes to modelling the overall trend of a series along with seasonal patterns.
ARIMA模型可以很好地建模一系列總體趨勢以及季節性模式。
In a previous article titled SARIMA: Forecasting Seasonal Data with Python and R, the use of an ARIMA model for forecasting maximum air temperature values for Dublin, Ireland was used.
在上一篇名為SARIMA:使用Python和R預測季節性數據的文章中,使用了ARIMA模型來預測愛爾蘭都柏林的最高氣溫。
The results showed significant accuracy, with 70% of the predictions ranging within 10% of the actual temperature values.
結果顯示出顯著的準確性,其中70%的預測值在實際溫度值的10%范圍內。
預測更多極端天氣情況 (Forecasting More Extreme Weather Conditions)
That said, the data that was being used for the previous example took temperature values that did not particularly show extreme values. For instance, the minimum temperature value was 4.8°C while the maximum temperature value was 28.7°C. Neither of these values lie outside the norm for typical yearly Irish weather.
就是說,先前示例中使用的數據采用的溫度值并未特別顯示極端值。 例如,最小溫度值為4.8°C,而最大溫度值為28.7°C。 這些值都不超出典型的愛爾蘭年度天氣的標準。
However, let’s consider a more extreme example.
但是,讓我們考慮一個更極端的例子。
Braemar is a village located in the Scottish highlands in Aberdeenshire, and is known as one of the coldest places in the United Kingdom in winter. In January 1982, a low of -27.2°C was recorded at this location according to the UK Met Office — which deviates strongly from the average minimum temperature of -1.5°C that was recorded between 1981–2010.
Braemar是位于阿伯丁郡蘇格蘭高地的一個村莊,被譽為冬季英國最冷的地方之一。 根據英國氣象局的數據 ,1982年1月,該地點的最低溫度為-27.2°C,這與1981-2010年間記錄的平均最低溫度 -1.5°C明顯不同。
How would an ARIMA model perform when forecasting an abnormally cold winter for Braemar?
預測Braemar異常寒冷的冬天時,ARIMA模型將如何執行?
An ARIMA model is built using monthly Met Office data from January 1959 — July 2020 (contains public sector information licensed under the Open Government Licence v1.0).
ARIMA模型是使用1959年1月至2020年7月的大都會辦公室每月數據構建的(包含根據開放政府許可證v1.0 許可的公共部門信息)。
The time series is defined:
時間序列定義為:
weatherarima <- ts(mydata$tmin[1:591], start = c(1959,1), frequency = 12)
plot(weatherarima,type="l",ylab="Temperature")
title("Minimum Recorded Monthly Temperature: Braemar, Scotland")
Here is a plot of the monthly data:
以下是每月數據的圖表:

Here is an overview of the individual time series components:
以下是各個時間序列組成部分的概述:

ARIMA模型配置 (ARIMA Model Configuration)
80% of the dataset (the first 591 months of data) are used to build the ARIMA model. The latter 20% of time series data is then used as validation data to compare the accuracy of the predictions to the actual values.
數據集的80%(最初的591個月的數據)用于構建ARIMA模型。 然后將時間序列數據的后20%用作驗證數據,以將預測的準確性與實際值進行比較。
Using auto.arima, the p, d, and q coordinates of best fit are selected:
使用auto.arima,選擇最合適的p , d和q坐標:
# ARIMA
fitweatherarima<-auto.arima(weatherarima, trace=TRUE, test="kpss", ic="bic")
fitweatherarima
confint(fitweatherarima)
plot(weatherarima,type='l')
title('Minimum Recorded Monthly Temperature: Braemar, Scotland')
The best configuration is selected as follows:
最佳配置選擇如下:
> # ARIMA
> fitweatherarima<-auto.arima(weatherarima, trace=TRUE, test="kpss", ic="bic")Fitting models using approximations to speed things up...ARIMA(2,0,2)(1,1,1)[12] with drift         : 2257.369
 ARIMA(0,0,0)(0,1,0)[12] with drift         : 2565.334
 ARIMA(1,0,0)(1,1,0)[12] with drift         : 2425.901
 ARIMA(0,0,1)(0,1,1)[12] with drift         : 2246.551
 ARIMA(0,0,0)(0,1,0)[12]                    : 2558.978
 ARIMA(0,0,1)(0,1,0)[12] with drift         : 2558.621
 ARIMA(0,0,1)(1,1,1)[12] with drift         : 2242.724
 ARIMA(0,0,1)(1,1,0)[12] with drift         : 2427.871
 ARIMA(0,0,1)(2,1,1)[12] with drift         : 2259.357
 ARIMA(0,0,1)(1,1,2)[12] with drift         : Inf
 ARIMA(0,0,1)(0,1,2)[12] with drift         : 2252.908
 ARIMA(0,0,1)(2,1,0)[12] with drift         : 2341.9
 ARIMA(0,0,1)(2,1,2)[12] with drift         : 2249.612
 ARIMA(0,0,0)(1,1,1)[12] with drift         : 2264.59
 ARIMA(1,0,1)(1,1,1)[12] with drift         : 2248.085
 ARIMA(0,0,2)(1,1,1)[12] with drift         : 2246.688
 ARIMA(1,0,0)(1,1,1)[12] with drift         : 2241.727
 ARIMA(1,0,0)(0,1,1)[12] with drift         : Inf
 ARIMA(1,0,0)(2,1,1)[12] with drift         : 2261.885
 ARIMA(1,0,0)(1,1,2)[12] with drift         : Inf
 ARIMA(1,0,0)(0,1,0)[12] with drift         : 2556.722
 ARIMA(1,0,0)(0,1,2)[12] with drift         : Inf
 ARIMA(1,0,0)(2,1,0)[12] with drift         : 2338.482
 ARIMA(1,0,0)(2,1,2)[12] with drift         : 2248.515
 ARIMA(2,0,0)(1,1,1)[12] with drift         : 2250.884
 ARIMA(2,0,1)(1,1,1)[12] with drift         : 2254.411
 ARIMA(1,0,0)(1,1,1)[12]                    : 2237.953
 ARIMA(1,0,0)(0,1,1)[12]                    : Inf
 ARIMA(1,0,0)(1,1,0)[12]                    : 2419.587
 ARIMA(1,0,0)(2,1,1)[12]                    : 2256.396
 ARIMA(1,0,0)(1,1,2)[12]                    : Inf
 ARIMA(1,0,0)(0,1,0)[12]                    : 2550.361
 ARIMA(1,0,0)(0,1,2)[12]                    : Inf
 ARIMA(1,0,0)(2,1,0)[12]                    : 2332.136
 ARIMA(1,0,0)(2,1,2)[12]                    : 2243.701
 ARIMA(0,0,0)(1,1,1)[12]                    : 2262.382
 ARIMA(2,0,0)(1,1,1)[12]                    : 2245.429
 ARIMA(1,0,1)(1,1,1)[12]                    : 2244.31
 ARIMA(0,0,1)(1,1,1)[12]                    : 2239.268
 ARIMA(2,0,1)(1,1,1)[12]                    : 2249.168Now re-fitting the best model(s) without approximations...ARIMA(1,0,0)(1,1,1)[12]                    : Inf
 ARIMA(0,0,1)(1,1,1)[12]                    : Inf
 ARIMA(1,0,0)(1,1,1)[12] with drift         : Inf
 ARIMA(0,0,1)(1,1,1)[12] with drift         : Inf
 ARIMA(1,0,0)(2,1,2)[12]                    : Inf
 ARIMA(1,0,1)(1,1,1)[12]                    : Inf
 ARIMA(2,0,0)(1,1,1)[12]                    : Inf
 ARIMA(0,0,1)(0,1,1)[12] with drift         : Inf
 ARIMA(0,0,2)(1,1,1)[12] with drift         : Inf
 ARIMA(1,0,1)(1,1,1)[12] with drift         : Inf
 ARIMA(1,0,0)(2,1,2)[12] with drift         : Inf
 ARIMA(2,0,1)(1,1,1)[12]                    : Inf
 ARIMA(0,0,1)(2,1,2)[12] with drift         : Inf
 ARIMA(2,0,0)(1,1,1)[12] with drift         : Inf
 ARIMA(0,0,1)(0,1,2)[12] with drift         : Inf
 ARIMA(2,0,1)(1,1,1)[12] with drift         : Inf
 ARIMA(1,0,0)(2,1,1)[12]                    : Inf
 ARIMA(2,0,2)(1,1,1)[12] with drift         : Inf
 ARIMA(0,0,1)(2,1,1)[12] with drift         : Inf
 ARIMA(1,0,0)(2,1,1)[12] with drift         : Inf
 ARIMA(0,0,0)(1,1,1)[12]                    : Inf
 ARIMA(0,0,0)(1,1,1)[12] with drift         : Inf
 ARIMA(1,0,0)(2,1,0)[12]                    : 2355.279Best model: ARIMA(1,0,0)(2,1,0)[12]
The parameters of the model are as follows:
該模型的參數如下:
> fitweatherarima
Series: weatherarima
ARIMA(1,0,0)(2,1,0)[12]Coefficients:
         ar1     sar1     sar2
      0.2372  -0.6523  -0.3915
s.e.  0.0411   0.0392   0.0393
Using the configured model ARIMA(1,0,0)(2,1,0)[12], the forecasted values are generated:
使用配置的模型ARIMA(1,0,0)(2,1,0)[12] ,將生成預測值:
forecastedvalues=forecast(fitweatherarima,h=148)
forecastedvalues
plot(forecastedvalues)
Here is a plot of the forecasts:
這是預測的圖:

Now, a data frame can be generated to compare the forecasted with actual values:
現在,可以生成一個數據框以將預測值與實際值進行比較:
df<-data.frame(mydata$tmin[592:739],forecastedvalues$mean)
col_headings<-c("Actual Weather","Forecasted Weather")
names(df)<-col_headings
attach(df)
Additionally, using the Metrics library in R, the RMSE (root mean squared error) value can be calculated.
此外,使用R中的Metrics庫,可以計算RMSE(均方根誤差)值。
> library(Metrics)
> rmse(df$`Actual Weather`,df$`Forecasted Weather`)
[1] 1.780472
> mean(df$`Actual Weather`)
[1] 2.876351
> var(df$`Actual Weather`)
[1] 17.15774
It is observed that with a mean temperature of 2.87°C, the recorded RMSE of 1.78 is significantly large when compared to the mean.
可以看出,平均溫度為2.87°C,與平均溫度相比,記錄的RMSE為1.78很大。
Let’s investigate the more extreme values in the data further.
讓我們進一步研究數據中更極端的值。

We can see that when it comes to forecasting particularly extreme minimum temperatures (below -4°C for the sake of argument), we see that the ARIMA model significantly overestimates the value of the minimum temperature.
我們可以看到,在預測特別極端的最低溫度(出于爭論的目的,低于-4°C)時,我們可以看到ARIMA模型大大高估了最低溫度的值。
In this regard, the size of the RMSE is just over 60% relative to the mean temperature of 2.87°C in the test set — for the reason that RMSE penalises larger errors more heavily.
在這方面,RMSE的大小相對于測試集中的平均溫度2.87°C剛好超過60%,這是因為RMSE會更嚴厲地懲罰較大的誤差。
In this regard, it would seem that the ARIMA model is effective at capturing temperatures that are more in the normal range of values.
在這方面,ARIMA模型似乎可以有效地捕獲更多處于正常值范圍內的溫度。

However, the model falls short in predicting values at the more extreme ends of the scales — particularly for the winter months.
但是,該模型無法預測更極端的數值,尤其是在冬季。
That said, what if the lower end of the ARIMA forecast was used?
就是說,如果使用ARIMA預測的下限怎么辦?
df<-data.frame(mydata$tmin[592:739],forecastedvalues$lower)
col_headings<-c("Actual Weather","Forecasted Weather")
names(df)<-col_headings
attach(df)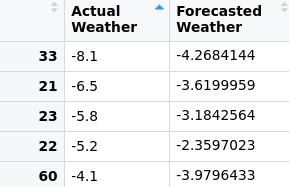
We see that while the model is performing better in forecasting the minimum values, the actual minimums still exceed that of the forecast.
我們看到,盡管模型在預測最小值方面表現更好,但實際最小值仍超過了預測值。
Moreover, this does not solve the problem as it means that the model will now significantly underestimate temperature values above the mean.
此外,這不能解決問題,因為這意味著該模型現在將大大低估高于平均值的溫度值。
As a result, the RMSE increases significantly:
結果,RMSE顯著增加:
> library(Metrics)
> rmse(df$`Actual Weather`,df$`Forecasted Weather`)
[1] 3.907014
> mean(df$`Actual Weather`)
[1] 2.876351
In this regard, ARIMA models should be interpreted with caution. While they can be effective in capturing seasonality and the overall trend, they can fall short in forecasting values that fall significantly outside the norm.
在這方面,ARIMA模型應謹慎解釋。 盡管它們可以有效地捕獲季節性和總體趨勢,但在預測值超出正常范圍的情況下可能會不足。
When it comes to forecasting such values, statistical tools such as Monte Carlo simulations can be more effective in modelling a potential range of more extreme values. Here is a follow-up article that discusses how extreme weather events can potentially be modelled using this method.
在預測此類值時,諸如蒙特卡洛模擬之類的統計工具可以更有效地建模更極端值的潛在范圍。 以下是后續文章 ,討論了如何使用這種方法來模擬極端天氣事件。
結論 (Conclusion)
In this example, we have seen that ARIMA can be limited in forecasting extreme values. While the model is adept at modelling seasonality and trends, outliers are difficult to forecast for ARIMA for the very reason that they lie outside of the general trend as captured by the model.
在此示例中,我們已經看到ARIMA在預測極值時可能受到限制。 盡管該模型擅長于對季節和趨勢進行建模,但由于ARIMA超出了模型捕獲的總體趨勢,因此很難預測ARIMA。
Many thanks for reading, and you can find more of my data science content at michael-grogan.com.
非常感謝您的閱讀,您可以在michael-grogan.com上找到更多我的數據科學內容。
Disclaimer: This article is written on an “as is” basis and without warranty. It was written with the intention of providing an overview of data science concepts, and should not be interpreted as professional advice in any way. The findings and interpretations in this article are those of the author and are not endorsed by or affiliated with the UK Met Office in any way.
免責聲明:本文按“原樣”撰寫,不作任何擔保。 它旨在提供數據科學概念的概述,并且不應以任何方式解釋為專業建議。 本文中的發現和解釋僅歸作者所有,并不以任何方式得到英國氣象局的認可或附屬。
翻譯自: https://towardsdatascience.com/limitations-of-arima-dealing-with-outliers-30cc0c6ddf33
離群值如何處理
本文來自互聯網用戶投稿,該文觀點僅代表作者本人,不代表本站立場。本站僅提供信息存儲空間服務,不擁有所有權,不承擔相關法律責任。 如若轉載,請注明出處:http://www.pswp.cn/news/389954.shtml 繁體地址,請注明出處:http://hk.pswp.cn/news/389954.shtml 英文地址,請注明出處:http://en.pswp.cn/news/389954.shtml
如若內容造成侵權/違法違規/事實不符,請聯系多彩編程網進行投訴反饋email:809451989@qq.com,一經查實,立即刪除!相關文章


10生活便捷:購物、美食、看病時這樣搜,至少能省一半心

ppt圖表圖表類型起始_梅科圖表

Tomcat日志亂碼了怎么處理?

python 編碼規范

5888. 網絡空閑的時刻

django框架預備知識

現實世界 機器學習_公司溝通分析簡介現實世界的機器學習方法

拷貝構造函數和賦值函數
![[bzoj3036]綠豆蛙的歸宿](http://pic.xiahunao.cn/[bzoj3036]綠豆蛙的歸宿)
[bzoj3036]綠豆蛙的歸宿

5902. 檢查句子中的數字是否遞增


Chrome keyboard shortcuts

數據中心細節_當細節很重要時數據不平衡

辛普森悖論_所謂的辛普森悖論

查看NVIDIA使用率工具目錄

2043. 簡易銀行系統

余弦相似度和歐氏距離_歐氏距離和余弦相似度

bzoj2152 聰聰可可
)