辛普森悖論
We all know the Simpsons family from Disneyland, but have you heard about the Simpson’s Paradox from statistic theory? This article will illustrate the definition of Simpson’s Paradox with an example, and show you how can it harm your statistical tests and analysis.
我們都知道迪斯尼樂園的辛普森一家,但您是否從統計理論中聽說過辛普森悖論? 本文將通過一個示例說明Simpson's Paradox的定義,并向您展示它如何危害您的統計測試和分析。
What is Simpson’s Paradox?
什么是辛普森悖論?
Simpson’s paradox refers to the situations in which a trend or relationship that is observed within multiple groups disappears or reverses when the groups are combined. The quick answer to why there is Simpson's paradox is the existence of confounding variables. I will illustrate it with the example below.
辛普森悖論是指當組合在一起時,在多個組中觀察到的趨勢或關系消失或逆轉的情況。 為何存在辛普森悖論的快速答案是存在混雜變量。 我將通過以下示例進行說明。
An example of Simpson’s Paradox
辛普森悖論的一個例子
Let’s take a simple example from a study analyzing the mortality rate difference between smokers and non-smokers, which was conducted by Appleton, French, and Vanderpump in 1996. Here is the data they have collected in the study:
讓我們舉一個簡單的例子,該研究是由Appleton,French和Vanderpump于1996年進行的一項分析吸煙者和非吸煙者之間的死亡率差異的研究。以下是他們在研究中收集的數據:

One would expect the mortality rate to be higher for smokers compared to non-smokers due to the harm caused by smoking. However, the data shows that the mortality rate is higher for non-smokers. The relationship is better represented here:
人們會認為,由于吸煙造成的危害,與不吸煙者相比,吸煙者的死亡率更高。 但是,數據顯示,非吸煙者的死亡率較高。 該關系在這里可以更好地表示:

The grey line in the chart represents the mortality rate, and it is higher for non-smokers. Why is that? Let’s bring down the data into multiple groups by ages:
圖表中的灰線代表死亡率,非吸煙者死亡率更高。 這是為什么? 讓我們按年齡將數據分為多個組:

Here is the chart plotting the mortality rate by age groups and by smoking or not:
這是按年齡組和吸煙與否繪制死亡率的圖表:

The chart shows that in the dataset, the mortality rate increase as age increases for both smokers and non-smokers. It is reasonable to conclude that age is positively correlated with the mortality rate, no matter by the evidence from this data, or from common sense.
圖表顯示,在數據集中,吸煙者和非吸煙者的死亡率都隨著年齡的增長而增加。 可以合理地得出結論,無論是根據該數據還是常識,年齡與死亡率呈正相關。
In the meantime, if we compare the smoking rate across different age groups, as the chart presented below:
同時,如果我們比較不同年齡段的吸煙率,如下圖所示:
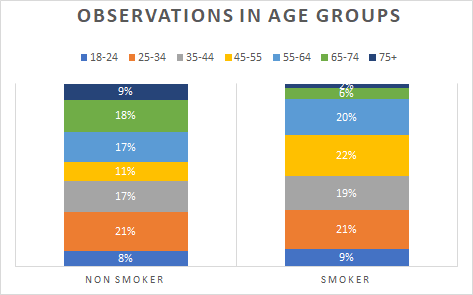
There are more smokers than non-smokers for all age groups except 65–74, and 75+. 27% of the non-smokers are older than 65, and only 8% of the smokers are older than 65. Thus, the chart shows that the age distributions are substantially different between smokers and non-smokers. The smoking population is younger than the non-smoking population from the data. In other words, age is negatively correlated with the probability of being in the smoking group or not.
除了65-74歲和75歲以上的年齡段外,所有年齡段的吸煙者都比不吸煙者多。 27%的不吸煙者年齡在65歲以上,只有8%的吸煙者年齡在65歲以上。因此,圖表顯示,吸煙者與不吸煙者之間的年齡分布存在很大差異。 根據數據,吸煙人口比非吸煙人口年輕。 換句話說,年齡與是否參加吸煙組負相關。
The previous evidence supports the statement that when we examine the relationship between smoking and mortality rate, we cannot ignore age, which is called a confounding variable(or a lurking variable). Age is positively correlated with mortality rate but is negatively correlated with smoking. Older groups have a higher mortality rate, but fewer of them are smokers. Thus, a greater proportion of older non-smokers, with a 100% mortality rate in this dataset, pushes up the average mortality rate for the non-smoker group. That is why we observe that the mortality rate is lower for the non-smokers across all age groups, but it is higher in the non-smoker group when we combine all groups together. This example perfectly illustrates what is Simpson’s Paradox, and why it happens.
先前的證據支持這樣的說法:當我們檢查吸煙與死亡率之間的關系時,我們不能忽略年齡,這被稱為混雜變量(或潛伏變量)。 年齡與死亡率呈正相關,但與吸煙呈負相關。 年齡較大的人群死亡率較高,但吸煙者較少。 因此,在此數據集中具有較高死亡率的年齡較大的不吸煙者比例為100%,從而推高了不吸煙者群體的平均死亡率。 這就是為什么我們觀察到所有年齡段的不吸煙者的死亡率都較低,但將所有年齡段的人群合并在一起,則不吸煙者的死亡率較高。 這個例子完美地說明了什么是辛普森悖論,以及它為什么發生。
How to deal with Simpson’s Paradox?
如何應對辛普森悖論?
Now we know what and why, it is time to know how to fix it. Simpson’s Paradox can cause great harm for statistical analyses or tests because of the reversed or insignificant relationship when ignoring the confounding variables. Thus, the way to deal with Simpson’s Paradox is to find the confounding variable and control it during your analysis. Take the previous data as an example, you cannot jump to the conclusion that non-smokers have a higher mortality rate thus smoking is good for health, when you are only observing the results from group averages. Breaking down the data into different age groups will give you a better understanding of the relationship.
現在我們知道了什么以及為什么,現在該知道如何修復它了。 辛普森悖論可能會給統計分析或測試造成極大傷害,因為當忽略混淆變量時,它們之間的關系相反或無關緊要。 因此,處理辛普森悖論的方法是找到混淆變量,并在分析過程中對其進行控制。 以以前的數據為例,當您僅觀察小組平均值的結果時,您無法得出結論,即非吸煙者的死亡率較高,因此吸煙有益于健康。 將數據分為不同年齡段可以使您更好地了解這種關系。
Hope this article helps you understand Simpson’s Paradox. Thank you for reading!
希望本文能幫助您理解辛普森悖論。 感謝您的閱讀!
翻譯自: https://medium.com/the-innovation/the-so-called-simpsons-paradox-6d0efdca6fdc
辛普森悖論
本文來自互聯網用戶投稿,該文觀點僅代表作者本人,不代表本站立場。本站僅提供信息存儲空間服務,不擁有所有權,不承擔相關法律責任。 如若轉載,請注明出處:http://www.pswp.cn/news/389939.shtml 繁體地址,請注明出處:http://hk.pswp.cn/news/389939.shtml 英文地址,請注明出處:http://en.pswp.cn/news/389939.shtml
如若內容造成侵權/違法違規/事實不符,請聯系多彩編程網進行投訴反饋email:809451989@qq.com,一經查實,立即刪除!相關文章

查看NVIDIA使用率工具目錄

2043. 簡易銀行系統

余弦相似度和歐氏距離_歐氏距離和余弦相似度

bzoj2152 聰聰可可
)
七、 面向對象(二)

機器學習 客戶流失_通過機器學習預測流失

2044. 統計按位或能得到最大值的子集數目

redis系列:分布式鎖


預測股票價格 模型_建立有馬模型來預測股票價格

Python 模塊 timedatetime


檸檬工會_工會經營者

229. 求眾數 II

寫給Java開發者看的JavaScript對象機制

Pythonic---------詳細講解

大數據ab 測試_在真實數據上進行AB測試應用程序


node:爬蟲爬取網頁圖片
