數據eda
數據科學和機器學習統計 (STATISTICS FOR DATA SCIENCE AND MACHINE LEARNING)
Categorical variables are the ones where the possible values are provided as a set of options, it can be pre-defined or open. An example can be the gender of a person. In the case of Ordinal variables, the options can be ordered by some rule, like the Likert Scale:
分類變量是將可能的值作為一組選項提供的變量,可以預定義或打開。 一個例子可以是一個人的性別。 對于序數變量,可以按照某些規則對選項進行排序,例如Likert Scale:
- Like 喜歡
- Like Somewhat 有點像
- Neutral 中性
- Dislike Somewhat 有點不喜歡
- Dislike 不喜歡
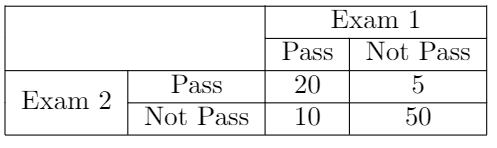
To simplify further examples, we will use a simple example, based on a group of students that have passed or not 2 distinct exams, the results are represented in the next RxC table:
為了簡化更多示例,我們將使用一個簡單示例,該示例基于一組已通過或未通過2次不同考試的學生,結果顯示在下一個RxC表中:
Statisticians have developed specific techniques to analyze this data, the most important are:
統計人員已經開發出分析此數據的特定技術,其中最重要的是:
協議措施 (Measures of Agreement)
百分比協議 (Percent Agreement)
Calculated as the divisions between the number of cases where the rates are in a certain class by the total number of rates.
計算為費率在特定類別中的案例數除以費率總數。
- The percent agreement for Passing the exam 2 is 25/(25+60) = 0.29, so 29.4% 通過考試2的百分比協議是25 /(25 + 60)= 0.29,所以29.4%
- The percent agreement for Passing the exam 1 is 30/85 = 0.35, so 35.3% 通過考試1的百分比協議是30/85 = 0.35,所以35.3%
- The percent agreement of passing the exam 1 and not passing the exam 2 is 10/85 = 0.117, so 11.7%. 通過考試1和未通過考試2的百分比協議是10/85 = 0.117,所以11.7%。
The problem with the percent agreement is that the data can be obtained only by chance.
百分比一致性的問題在于只能偶然獲得數據。
科恩的卡帕 (Cohen’s Kappa)
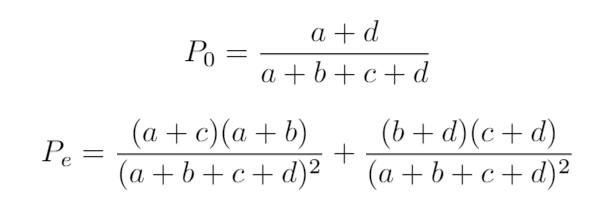
To overcome the problems of percent agreement, we calculate Kappa as:
為了克服百分比協議的問題,我們將Kappa計算為:

where P0 is the observed agreement and Pe the expected agreement, calculated as:
其中P0是觀察到的協議, Pe是期望的協議,計算公式為:
In our example:
在我們的示例中:
P0 = 70/85 = 0.82
P0 = 70/85 = 0.82
Pe = 30 x 25 / 852 + 55 x 60 / 852 = 0.56
Pe = 30 x 25 /852+ 55 x 60 /852= 0.56
K = 0.26 / 0.44 = 0.59
K = 0.26 / 0.44 = 0.59
The Kappa results are in possible range is (-1,1), where 0 means that observed agreement and chance agreement is the same, 1 if all cases were in agreement and -1 if all cases were in disagreement.
Kappa結果的可能范圍是(-1,1),其中0表示觀察到的一致和機會一致是相同的,如果所有情況都一致,則為1;如果所有情況都不一致,則為-1。
卡方分布 (The Chi-Squared Distribution)
To do hypothesis testing with categorical variables, we need to use custom distributions, the most common is the Chi-Square, being a continuous theoretical probability distribution.
要使用分類變量進行假設檢驗,我們需要使用自定義分布,最常見的是卡方,即連續的理論概率分布。
This distribution has only one parameter, k which means degrees of freedom. As k approaches infinity, the chi-Squared distribution becomes similar to the normal distribution.
這種分布只有一個參數, k表示自由度。 當k接近無窮大時,卡方分布變得類似于正態分布。
卡方檢驗 (Chi-Squared Test)
This test is used to check if two categorical variables are independent, we will use the same example to explain how to calculate it:
該測試用于檢查兩個類別變量是否獨立,我們將使用相同的示例來說明如何計算它:
First, we define the hypothesis that we want to test, in our case, we want to check if passing exam 1 and exam 2 are independent, so:
首先,我們定義要測試的假設,在本例中,我們要檢查通過考試1和考試2是否獨立,因此:
- H0 = Pass exam 1 and pass exam 2 are independent. H0 =通過考試1和通過考試2是獨立的。
- Ha = Pass exam 1 and pass exam 2 are dependent. Ha =通過考試1和通過考試2是相關的。
This test relies on the difference between expected and observed values, to calculate the expected values(what you expect to find if both variables were independent), we use:
該測試依賴于期望值與觀察值之間的差異,以計算期望值(如果兩個變量都是獨立的,您會發現什么),我們使用:
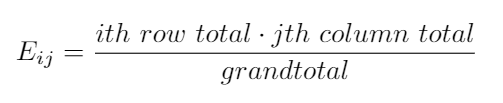
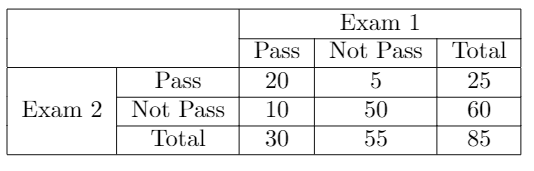
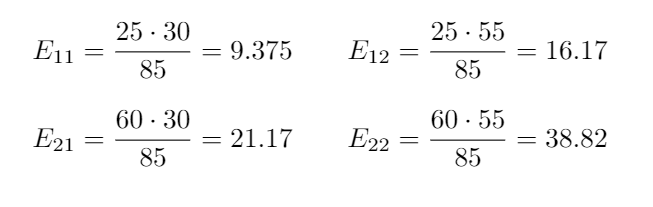
To simplify the calculations first we calculate the marginals, these values are the sums per row and column that we already calculated in the second table if this post. The expected values are calculated as:
為了簡化計算,首先我們計算邊際,這些值是我們在第二張表中已經計算出的每行和每列的總和。 期望值的計算公式為:
Now we have all we need to calculate the chi-squared formula:
現在我們有了計算卡方公式所需的全部:
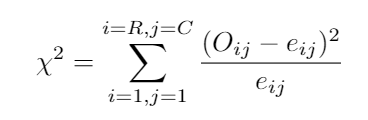
With the sum symbol, we mean that we have to calculate the formula for all combinations of our variables, in our case 4, and sum the results:
對于總和符號,我們的意思是我們必須為變量4的所有組合計算公式,并對結果求和:
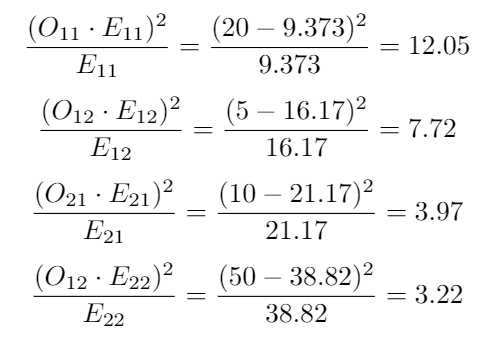
The final values are the sum of all 4, being 26.96, now we have to compare this result with the statistical tables, for this we need to know the degrees of freedom, they are calculated as (num rows-1)*(num columns-1), in our case we have a degree of freedom = 1.
最終值是所有4的總和,即26.96 ,現在我們必須將此結果與統計表進行比較,為此,我們需要知道自由度,它們的計算方式為(num rows-1)*(num columns -1) ,在我們的情況下,我們的自由度= 1。
According to the tables found easy searching Chi-Squared table at Google(statistical packages for any language should have them in a function), the critical value for 𝝰 = 0.05, is 3.841, our result is much larger, so, we reject the null hypothesis which means that pass exam 1 and pass exam 2 are dependent.
根據在Google上發現的易于搜索的Chi-Squared表(任何語言的統計軟件包都應在函數中包含它們),, = 0.05的臨界值為3.841,我們的結果要大得多,因此,我們拒絕空值假設意味著通過考試1和通過考試2是相互依賴的。
分類數據的相關統計 (Correlation statistics for categorical data)
As person correlation requires variables to be measured on at least interval level, we need to adopt a new calculation for binary and ordinal variables, let’s introduce them:
由于人的相關性要求至少在區間水平上測量變量,因此我們需要對二進制和序數變量采用新的計算方法,讓我們對其進行介紹:
二進制變量 (Binary Variables)
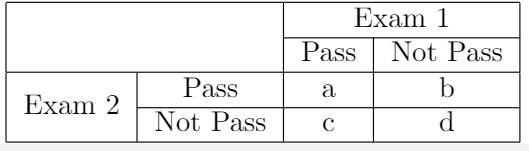
Phi is a measure of the degree of association between two binary variables, based on the table introduced at the Cohen’s Kappa sections, it’s calculated as:
Phi是兩個二進制變量之間關聯度的度量,基于Cohen Kappa部分介紹的表,其計算公式為:
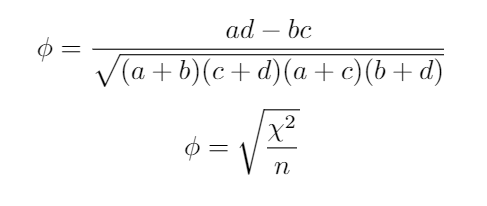
Using the second formula, in our example, Φ = (26.96/85)^(1/2) = 0.1
在我們的示例中,使用第二個公式,Φ=( 26.96 / 85)^(1/2)= 0.1
Notice that the first formula can obtain negative values, meanwhile, the second one can only result in positive values, we don't care about the direction of our result, we just analyze the absolute value.
注意,第一個公式可以得出負值,而第二個公式只能得出正值,我們不在乎結果的方向,我們只分析絕對值。
If the distribution of the data is 50–50, so data is evenly distributed, phi can reach the value of 1, else the potential max value is lower. In our case, we have very little relationship.
如果數據的分布是50–50,則數據分布均勻,phi可以達到1的值,否則潛在的最大值較低。 就我們而言,我們之間的關系很少。
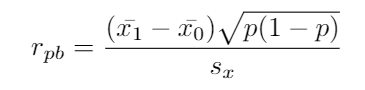
點-雙相關 (The Point-Biserial Correlation)
It’s a measure that calculates the correlation between dichotomous and continuous variables, the formula is the next-one:
這是一種計算二分變量和連續變量之間的相關性的度量,公式為下一個:
Where:
哪里:
x?1 = mean of the continuous variable for group 1
x?1 =組1連續變量的平均值
x?2 = mean of the continuous variable for group 2
x?2 =第2組連續變量的平均值
p = proportion of class 1 in the dichotomous variable
p = 1類在二分變量中的比例
s_x = Standart deviation of the continuous variable
s_x =連續變量的標準偏差
To follow our example we will suppose the next values, obtained comparing the exam 1 variable with the number of hours studied:
遵循我們的示例,我們將假定下一個值,該值是將考試1變量與學習的小時數進行比較而獲得的:
x? pass = 5.5
x?通過 = 5.5
x? not pass = 3.1
x?不及格 = 3.1
p = 20/25 = 0.8
p = 20/25 = 0.8
s_x = 2
s_x = 2
With these values, we obtain a result of 2.4 * 0.4 / 2 = 0.48, indicating that there’s some relation between our variables.
使用這些值,我們得到的結果為2.4 * 0.4 / 2 = 0.48 ,表明變量之間存在某種關系。
序數變數 (Ordinal Variables)
The most used correlation coefficient for ordinal variables is the Spearman’s rank-order coefficient, usually called Spearman’s r.
序數變量最常用的相關系數是Spearman的秩序系數 ,通常稱為Spearman的r 。
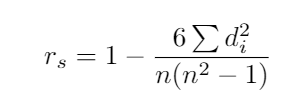
where d_i means the difference between 2 variables for each individual and n the size of the sample.
其中d_i表示每個個體的2個變量與樣本大小的n之差。
摘要 (Summary)
In data science, we’re used to do some scatter plots of the binary, categorical or ordinary variables, use them as color differences in other plots, but when we calculate the correlations it’s easy to skip this variable, because of the built-in functions for pandas in the case of python or Dplyr in R don't use them.
在數據科學中,我們習慣于對二進制,分類或普通變量進行散點圖繪制,將它們用作其他圖中的色差,但是當我們計算相關性時,由于內置變量,很容易跳過此變量R中的python或Dplyr的熊貓函數不使用它們。
In this post, we showed how to analyze these variables' distribution and their correlation with all the other variables.
在這篇文章中,我們展示了如何分析這些變量的分布以及它們與所有其他變量的相關性。
This is the tenth post of my particular #100daysofML, I will be publishing the advances of this challenge at GitHub, Twitter, and Medium (Adrià Serra).
這是我特別#十后100daysofML,我會發布在GitHub上,Twitter和中型企業(這一挑戰的進步阿德里亞塞拉 )。
https://twitter.com/CrunchyML
https://twitter.com/CrunchyML
https://github.com/CrunchyPistacho/100DaysOfML
https://github.com/CrunchyPistacho/100DaysOfML
翻譯自: https://medium.com/ai-in-plain-english/eda-on-categorical-and-ordinal-data-22f8a4407836
數據eda
本文來自互聯網用戶投稿,該文觀點僅代表作者本人,不代表本站立場。本站僅提供信息存儲空間服務,不擁有所有權,不承擔相關法律責任。 如若轉載,請注明出處:http://www.pswp.cn/news/389430.shtml 繁體地址,請注明出處:http://hk.pswp.cn/news/389430.shtml 英文地址,請注明出處:http://en.pswp.cn/news/389430.shtml
如若內容造成侵權/違法違規/事實不符,請聯系多彩編程網進行投訴反饋email:809451989@qq.com,一經查實,立即刪除!相關文章

PyTorch官方教程中文版:PYTORCH之60MIN入門教程代碼學習

Flexbox 最簡單的表單


jdk重啟后步行_向后介紹步行以一種新穎的方式來預測未來

PyTorch官方教程中文版:入門強化教程代碼學習

css3-2 CSS3選擇器和文本字體樣式

mongodb仲裁者_真理的仲裁者

優化 回歸_使用回歸優化產品價格

Node.js——異步上傳文件

用 JavaScript 的方式理解遞歸

PyTorch官方教程中文版:Pytorch之圖像篇

大數據數據科學家常用面試題_進行數據科學工作面試

scrapy模擬模擬點擊_模擬大流行

公司想申請網易企業電子郵箱,怎么樣?

莫煩Matplotlib可視化第二章基本使用代碼學習

vue.js python_使用Python和Vue.js自動化報告過程

plsql中導入csvs_在命令行中使用sql分析csvs

第十八篇 Linux環境下常用軟件安裝和使用指南

莫煩Matplotlib可視化第三章畫圖種類代碼學習
