一、Canvas 畫布
canvas 組件 提供了繪制界面,可以在之上進行任意繪制
功能描述
Canvas 畫布。2.9.0 起支持一套新 Canvas 2D 接口(需指定 type 屬性),同時支持同層渲染,原有接口不再維護。
二、Canvas 和Canvas 2D 區別
- Canvas 2D 需指定 type 屬性
- Canvas 屬性 canvas-id ,Canvas 2D改成 id
- Canvas 標簽默認寬度300px、高度150px
- Canvas 2D(新接口)需要顯式設置畫布寬高,默認:300*150,最大:1365*1365
<canvas class="pie-chart" canvas-id="chartOrg"></canvas>
<canvas class="pie-chart" type="2d" id="chart2d"></canvas>
API的區別
| Canvas | 新版 Canvas 2D |
|---|---|
| canvasContext.draw() | canvasContext接口沒有 draw 方法 |
| canvasContext.setFillStyle(“#000000”) | canvasContext.fillStyle = “#000000” |
| canvasContext.setFontSize(16) | canvasContext.font = ‘16px PingFang SC’ |
| canvasContext.setTextAlign(‘center’) | canvasContext.textAlign = “center” |
提醒:上面API的區別是下面示例用到的,還有其他API的變化,感興趣的讀者自行查閱。
三、示例用到的uni API
3.1 uni.createCanvasContext(canvasId, componentInstance)
3.1.1 定義
創建 canvas 繪圖上下文(指定 canvasId)。在自定義組件下,第二個參數傳入組件實例this,以操作組件內 組件
提醒: 需要指定 canvasId,該繪圖上下文只作用于對應的
參數
| 參數 | 類型 | 說明 |
|---|---|---|
| canvasId | String | 畫布標識,傳入定義在 的 canvas-id或id(支付寶小程序是id、其他平臺是canvas-id) |
| componentInstance | Object | 自定義組件實例 this ,表示在這個自定義組件下查找擁有 canvas-id 的 ,如果省略,則不在任何自定義組件內查找 |
返回值:CanvasContext
3.2 uni.getSystemInfoSync()
獲取系統信息的同步接口。調用參數和返回值和調用 uni.getSystemInfo() 一樣。
3.3 uni.createSelectorQuery()
提醒:
- 使用 uni.createSelectorQuery() 需要在生命周期 mounted 后進行調用。
- 默認需要使用到 selectorQuery.in 方法。
selectorQuery.in(component)
將選擇器的選取范圍更改為自定義組件 component 內,返回一個 SelectorQuery 對象實例。(初始時,選擇器僅選取頁面范圍的節點,不會選取任何自定義組件中的節點)。
示例代碼
const query = uni.createSelectorQuery().in(this);
query.select("#id").boundingClientRect((data) => {console.log("得到布局位置信息" + JSON.stringify(data));console.log("節點離頁面頂部的距離為" + data.top);}).exec();
注意: 支付寶小程序不支持 in(component),使用無效果
四、微信小程序使用Canvas 和Canvas 2D繪制圖形示例
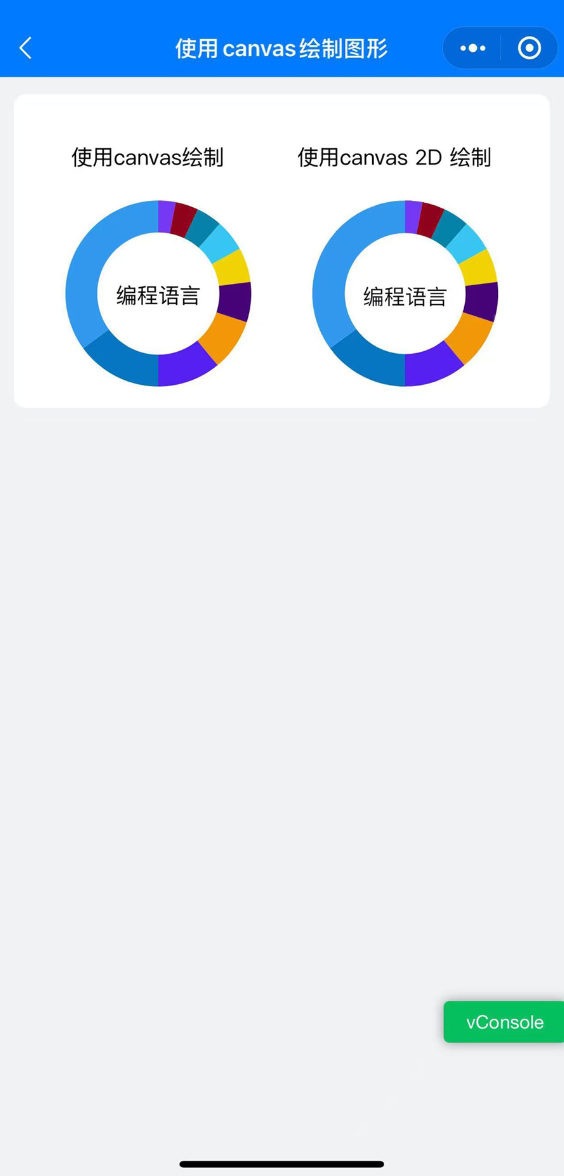
示例效果圖
testCanvas.vue代碼
<template><view class="view-root-wrap"><view class="view-content-wrap"><view class="view-content"><text>使用canvas繪制</text><text>使用canvas 2D 繪制</text></view><view class="view-content"><canvas class="pie-chart" canvas-id="chartOrg"></canvas><canvas class="pie-chart"  type="2d" id="chart2d"></canvas></view></view></view>
</template>
<script>
export default {data() {return {isReady: false,}},onReady() {this.isReady = true// this.drawChartOrg()// this.startDrawChart2D()},onLoad(options) {this.drawChartOrg()this.startDrawChart2D()},methods: {// 繪制餅圖drawChartOrg() {console.log(`執行了 drawChartOrg 方法  this.isReady = ${this.isReady}`)const canvasContext = uni.createCanvasContext('chartOrg', this)const centerX = 70 // 圓心x坐標const centerY = 70 // 圓心y坐標const innerRadius = 46;// 內圓半徑const outerRadius = 70; // 外圓半徑let chartData = [{ value: 3, color: '#7539f5', name: 'Fortran' },{ value: 4, color: '#91041c', name: 'Delphi/Object Pascal' },{ value: 4.5, color: '#0582a9', name: 'Visual Basic' },{ value: 5.5, color: '#39c8f5', name: 'Go' },{ value: 6, color: '#f2d407', name: 'JavaScript' },{ value: 7, color: '#480479', name: 'C#' },{ value: 9, color: '#f29707', name: 'Java' },{ value: 11, color: '#5620f3', name: 'C' },{ value: 15, color: '#0676c2', name: 'C++' },{ value: 35, color: '#339AF0', name: 'Python' },];const totalPercent = 100let startAngle = 1.5 * Math.PI // 起始角度// 繪制外圓chartData.forEach(item => {const sliceAngle = (2 * Math.PI * item.value) / totalPercentconst endAngle = startAngle + sliceAnglecanvasContext.beginPath()canvasContext.moveTo(centerX, centerY)canvasContext.arc(centerX, centerY, outerRadius, startAngle, endAngle)canvasContext.closePath()canvasContext.setFillStyle(item.color)canvasContext.fill()startAngle = endAngle})// 繪制內圓canvasContext.beginPath()canvasContext.arc(centerX, centerY, innerRadius, 0, 2 * Math.PI)canvasContext.setFillStyle('#FFFFFF')canvasContext.fill()// 添加中間文字canvasContext.setFontSize(16)canvasContext.setFillStyle('#000000')canvasContext.setTextAlign('center')canvasContext.fillText("編程語言", centerX, centerY + 8)canvasContext.draw()},startDrawChart2D() {console.log(`執行了 startDrawChart 方法  this.isReady = ${this.isReady}`)let delayTime = 500;if (this.isReady) {delayTime = 150}setTimeout(() => {this.drawChart2D()}, delayTime);},// 使用 Canvas2D 繪制餅圖drawChart2D() {const query = uni.createSelectorQuery().in(this)query.select('#chart2d').fields({ node: true, size: true }).exec((res) => {try {let { node, width, height } = res[0];const canvas = nodeconst canvasContext = canvas.getContext('2d')const dpr = uni.getSystemInfoSync().devicePixelRatioconst tempWidth = width * dprcanvas.width = tempWidthcanvas.height = tempWidthcanvasContext.scale(dpr, dpr)const radius = width / 2const centerX = radius  // 圓心x坐標const centerY = radius // 圓心y坐標const outerRadius = radius; // 外圓半徑const innerRadius = outerRadius * 0.65; // 內圓半徑let chartData = [{ value: 3, color: '#7539f5', name: 'Fortran' },{ value: 4, color: '#91041c', name: 'Delphi/Object Pascal' },{ value: 4.5, color: '#0582a9', name: 'Visual Basic' },{ value: 5.5, color: '#39c8f5', name: 'Go' },{ value: 6, color: '#f2d407', name: 'JavaScript' },{ value: 7, color: '#480479', name: 'C#' },{ value: 9, color: '#f29707', name: 'Java' },{ value: 11, color: '#5620f3', name: 'C' },{ value: 15, color: '#0676c2', name: 'C++' },{ value: 35, color: '#339AF0', name: 'Python' },];const totalPercent = 100let startAngle = 1.5 * Math.PI // 起始角度// 繪制外圓chartData.forEach(item => {const sliceAngle = (2 * Math.PI * item.value) / totalPercentconst endAngle = startAngle + sliceAnglecanvasContext.beginPath()canvasContext.moveTo(centerX, centerY)canvasContext.arc(centerX, centerY, outerRadius, startAngle, endAngle)canvasContext.closePath()canvasContext.fillStyle = item.colorcanvasContext.fill()startAngle = endAngle})// 繪制內圓canvasContext.beginPath()canvasContext.arc(centerX, centerY, innerRadius, 0, 2 * Math.PI)canvasContext.fillStyle = "#FFFFFF"canvasContext.fill()// 添加中間文字canvasContext.font = '16px PingFang SC'canvasContext.fillStyle = "#000000"canvasContext.textAlign = "center"canvasContext.fillText("編程語言", centerX, centerY + 8)} catch (error) {console.log("drawChart2D 繪制發生異常: " + error)}})},}
}
</script>
<style scoped>
.view-root-wrap {padding: 12px;
}.view-content-wrap {display: flex;flex-direction: column;justify-content: center;background-color: white;padding: 28rpx;border-radius: 16rpx;
}.view-content {display: flex;flex-direction: row;justify-content: space-around;margin-top: 32rpx;
}.pie-chart {width: 140px;height: 140px;
}
</style>


:一個用于兩性關系動力學建模的隨機耦合系統框架)

 一個二叉樹)
:ADC (模數轉換))


![小楊的 X 字矩陣(舉一反三)-洛谷B3865 [GESP202309 二級]](http://pic.xiahunao.cn/小楊的 X 字矩陣(舉一反三)-洛谷B3865 [GESP202309 二級])

(含halcon代碼))

)
