前言:
????????react+echarts實現圖表展示。
1、直接用echarts的插件來實現
1)安裝
npm install echarts2)使用
1、useEffect是react中集合onload/watch監聽等方法與一體的hook函數,他的第二個參數是空數組,則等同于onload,只執行一次,如果給他傳入有內容的數據,則等同于watch,當參數發生改變就會實時調用數據。
2、useRef 是react中類似ref的 hook 函數,實現元素的獲取
案例源碼:
// 引入依賴插件
import React, { useEffect, useRef } from 'react';
import echarts from 'echarts';// 輸入js邏輯
const EchartsDemo = () => {// useRef = 我們的ref方法const chartRef = useRef(null);// 第二個參數為空的時候,等同于onload方法useEffect(() => {const chartDom = chartRef.current;// 傳統的echarts.init+dom元素方法const myChart = echarts.init(chartDom);const option = {title: {text: '示例圖表',},tooltip: {trigger: 'axis',},xAxis: {type: 'category',data: ['蘋果', '香蕉', '橙子', '葡萄', '西瓜'],},yAxis: {type: 'value',},series: [{name: '銷量',type: 'bar',data: [100, 200, 150, 80, 90],},],};myChart.setOption(option);return () => {myChart.dispose();};}, []);// 這里因為傳入[],所以只執行一次return (<div className="echarts-container"><div ref={chartRef} style={{ width: '100%', height: '400px' }} /></div>);
};export default EchartsDemo;
1、使用useState 這個react的hook來實現變量的雙休綁定,注意他的用法是兩個參數,第一個是定義的變量,第二個是修改這個變量的方法,比如:
const [echartData, setData] = useState([12, 20, 15, 18, 18])
意思就是,定義了一個變量echartData ,默認值是 【12, 20, 15, 18, 18】
然后調用setData這個方法,就可以修改echartData變量的內容
2、將useEffect 的hook的第二個參數設置成echartData,那么echartData發生改變的時候,useEffect的邏輯會再次觸發,實現數據監聽改變邏輯
源碼2
?
import React, { useEffect, useRef, useState } from 'react';
import echarts from 'echarts';const EchartsDemo = () => {const chartRef = useRef(null);// 使用useState來修改數據const [echartData, setData] = useState([12, 20, 15, 18, 18]);useEffect(() => {const chartDom = chartRef.current;const myChart = echarts.init(chartDom);const option = {title: {text: '示例圖表',},tooltip: {trigger: 'axis',},xAxis: {type: 'category',data: ['蘋果', '香蕉', '橙子', '葡萄', '西瓜'],},yAxis: {type: 'value',},series: [{name: '銷量',type: 'bar',data: data,},],};myChart.setOption(option);return () => {myChart.dispose();};}, [echartData]);// 點擊更新數據方法const updateData = () => {   // 可以在這里異步獲取數據然后直接更改變量就行了let arr = [100, 200, 150, 80, 90]setData(arr);};return (<div className="echarts-container"><div ref={chartRef} style={{ width: '100%', height: '400px' }} /><button onClick={updateData}>更新數據</button></div>);
};export default EchartsDemo;?
2、使用 echarts-for-react 插件來更好的實現
1)安裝
npm install echarts echarts-for-react2)使用
1、memo:?是一個高階組件(Higher-Order Component,HOC),用于優化函數組件的性能。它的作用是阻止組件在父組件重新渲染時不必要的重新渲染,除非組件的?
props?發生變化2、useEffect就是onload+watch的hook函數
3、useState是定義變量,修改變量的hook函數
和第一種方法區別:
使用了ReactEChartsCore這個標簽,還有像提示框,彈框等都可以單獨引入,TooltipComponent, GridComponent 等等,還有canvas等
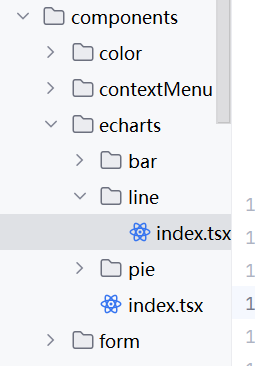
ReactEChartsCoreline/index.jsx源碼:
import React, { memo, useEffect, useState } from "react";
import ReactEChartsCore from "echarts-for-react/lib/core";
import * as echarts from "echarts/core";
import { BarChart } from "echarts/charts";
import { TooltipComponent, GridComponent } from "echarts/components";
import { CanvasRenderer } from "echarts/renderers";echarts.use([TooltipComponent, GridComponent, BarChart, CanvasRenderer]);function Line({ theme = "light", style = {}, option = {} }) {const [echartRef, setRef] = useState<ReactEChartsCore | null>(null);useEffect(() => {if (echartRef) {echartRef.getEchartsInstance().setOption(option);}}, [option]);return (<ReactEChartsCorekey="echart"ref={setRef}echarts={echarts}option={option}theme={theme}style={style}notMerge={true}lazyUpdate={true}/>);
}export default memo(Line, (prev, next) => prev.option === next.option);
封裝一個echarts/index.jsx來管理所有的圖表,里面放個antd的loading效果
import loadable from "@loadable/component";
import { Spin } from "antd";const loaddingCom = (<Spinstyle={{display: "flex",alignItems: "center",justifyContent: "center",minHeight: 20,fontSize: 14,}}tip="組件加載中...."/>
);const Line = loadable(() => import("./line"), { fallback: loaddingCom });
export { Line};
界面中調用
// 引入echarts
import { Line as LineEchart } from "@/components/echarts";const visitorOpt = {xAxis: {type: 'category', // 橫軸類型data: ['Mon', 'Tue', 'Wed', 'Thu', 'Fri', 'Sat', 'Sun'] // 橫軸數據},yAxis: {type: 'value' // 縱軸類型},series: [{data: [150, 230, 224, 218, 135, 147, 260], // 數據type: 'line' // 圖表類型,折線圖}]
}
const echartStyle = {height: 50,
}// 具體使用
<LineEchart option={visitorOpt} style={echartStyle} />


和docker的連接,詳細分析說明)


-W2 AI項目工作流程)


