近期關注 Qt 6.10 的分支進展, 發現了 Qt 6.10 的 charts 和 data visualization (以下簡稱 DV)已經被deprecated, 功能將會合并到 graphs 模塊。如果后面 charts\ DV 被棄用,那算是很大的API變化了。從Qt 6.5 以后開始引入的 graphs 使用的是QML的渲染器,和之前的 Qt Widgets GraphicsView 完全不同。如果有依賴上述模塊的應用,需要提前評估API的變化。
1. 可能遇到的主要問題
只要是和QML相關的東西,那問題無外乎就是老電腦的兼容性,以及跨語言的API。
1.1 老舊和低成本環境可能不再適用
QML的渲染器過度依賴OS的本地3D加速API,如 Windows的 DirectX。在VMWare/VirtualBox環境下,QML有概率無法正常渲染圖形。在只有核心顯卡,沒有配置獨立顯卡的低成本計算機上,QML也非常卡頓,甚至可能無法啟動(如果驅動比較老或者配置不正確)。
與之形成對比的,是Widgets的2D渲染,基本是在backend里自繪的,因此,不但可以支持老舊計算機,還能在 vnc、framebuf里使用。
1.2 跨語言API調用和性能問題
charts和DV是支持C++ Only模式的開發的。但是, graphs 卻不是。官網的例子里,C++ Widgets 程序使用 graphs 必須要進行QML混合編程。這里就牽扯到三個場景:
- 從C++中動態向 QML 刷新曲線,特別是1秒刷新23次的這種動畫。
- 從C++中精確獲得QML圖元的signal,如橡皮筋選擇、有圖元被雙擊等等。
- 從C++中查詢各個圖元的屬性和狀態。比如查詢視圖的寬度、高度,選中的狀態等。
這些操作要達到高性能、易于使用,需要特別注意不出現內存深度拷貝,且管理好QObject對象樹的生命周期(life-cycle)。
2. 初步試用
抱著試試看的態度,初步對 Qt Graphs的API進行了研究,并以最簡單的動態折線圖進行了開發測試。
pro文件
模塊包括 quickwidgets graphs quick 等模塊。
QT += core gui widgets quickwidgets graphs quickCONFIG += c++17SOURCES += \main.cpp \graphstest.cppHEADERS += \graphstest.hFORMS += \graphstest.ui2.2 main.cpp
#include "graphstest.h"#include <QApplication>int main(int argc, char *argv[])
{QApplication a(argc, argv);graphsTest w;w.show();return a.exec();
}
2.3 graphstest.h
#ifndef GRAPHSTEST_H
#define GRAPHSTEST_H#include <QDateTimeAxis>
#include <QDialog>
#include <QLineSeries>
#include <QValueAxis>
#include <QVector>
QT_BEGIN_NAMESPACE
namespace Ui
{
class graphsTest;
}
QT_END_NAMESPACEclass graphsTest : public QDialog
{Q_OBJECTpublic:graphsTest(QWidget *parent = nullptr);~graphsTest();protected:void timerEvent(QTimerEvent *evt) override;
private slots:void on_pushButton_add_clicked();void on_checkBox_update_clicked();private:Ui::graphsTest *ui;QDateTimeAxis *m_ax;QValueAxis *m_ay;int m_timerEvent;QVector<QLineSeries *> m_lineSeries;
};
#endif // GRAPHSTEST_H
2.4 graphstest.cpp
#include "graphstest.h"
#include <QDateTime>
#include <QDebug>
#include <QQuickItem>
#include "ui_graphstest.h"
graphsTest::graphsTest(QWidget *parent): QDialog(parent), ui(new Ui::graphsTest), m_ax(new QDateTimeAxis(this)), m_ay(new QValueAxis(this)), m_timerEvent(-1)
{ui->setupUi(this);QDateTime dtmNow = QDateTime::currentDateTime();m_ax->setMin(dtmNow.addDays(-1));m_ax->setMax(dtmNow);m_ay->setRange(-100, 100);QList<QObject *> seriesList;ui->graphsView->setResizeMode(QQuickWidget::SizeRootObjectToView);ui->graphsView->setInitialProperties({{"seriesList", QVariant::fromValue(seriesList)},{"axisX", QVariant::fromValue(m_ax)},{"axisY", QVariant::fromValue(m_ay)},{"zoomAreaEnabled", true}});ui->graphsView->loadFromModule("QtGraphs", "GraphsView");
}graphsTest::~graphsTest()
{delete ui;
}void graphsTest::timerEvent(QTimerEvent *evt)
{if (evt->timerId() == m_timerEvent){QList<QPointF> data;QDateTime dtmNow = QDateTime::currentDateTime();const int N = m_lineSeries.size();for (int n = 0; n < N; ++n){for (int i = 0; i < 30; ++i){data << QPointF(dtmNow.addSecs(-3600 * 24.0 / 30 * (29 - i)).toMSecsSinceEpoch(),(rand() % 500 - 250) / 100.0 + n * 16 - 80);}m_lineSeries[n]->replace(data);}m_ax->setMin(dtmNow.addDays(-1));m_ax->setMax(dtmNow);if (!ui->checkBox_update->isChecked()){killTimer(m_timerEvent);m_timerEvent = -1;}}QDialog::timerEvent(evt);
}void graphsTest::on_pushButton_add_clicked()
{if (m_lineSeries.size() >= 10)return;//Add to GraphQVariant seriesListVariant = ui->graphsView->rootObject()->property("seriesList");if (seriesListVariant.canConvert<QQmlListProperty<QObject>>()){QLineSeries *newLine = new QLineSeries(this);newLine->setColor(QColor(rand() % 128, rand() % 128, rand() % 128));newLine->setHoverable(true);newLine->setName(QString("Testing %1").arg(m_lineSeries.size()));connect(newLine,&QAbstractSeries::hover,[this](const QString &seriesName, QPointF position, QPointF value) -> void{ui->lineEdit_msg->setText(QString("%1:%2 %3 = %4 %5").arg(seriesName).arg(position.x()).arg(position.y()).arg(value.x()).arg(value.y()));});//AddQQmlListProperty<QObject> prop = seriesListVariant.value<QQmlListProperty<QObject>>();prop.append(&prop, newLine);m_lineSeries.append(newLine);}if (m_timerEvent < 0)m_timerEvent = startTimer(500);
}void graphsTest::on_checkBox_update_clicked()
{if (ui->checkBox_update->isChecked())m_timerEvent = startTimer(500);
}
2.5 graphstest.ui
<?xml version="1.0" encoding="UTF-8"?>
<ui version="4.0"><class>graphsTest</class><widget class="QDialog" name="graphsTest"><property name="geometry"><rect><x>0</x><y>0</y><width>579</width><height>332</height></rect></property><property name="windowTitle"><string>graphsTest</string></property><layout class="QVBoxLayout" name="verticalLayout_2"><item><layout class="QHBoxLayout" name="horizontalLayout"><item><widget class="QQuickWidget" name="graphsView"><property name="resizeMode"><enum>QQuickWidget::ResizeMode::SizeRootObjectToView</enum></property></widget></item><item><layout class="QVBoxLayout" name="verticalLayout"><property name="sizeConstraint"><enum>QLayout::SizeConstraint::SetMaximumSize</enum></property><item><widget class="QPushButton" name="pushButton_add"><property name="sizePolicy"><sizepolicy hsizetype="Fixed" vsizetype="Fixed"><horstretch>0</horstretch><verstretch>0</verstretch></sizepolicy></property><property name="text"><string>Add Serials</string></property></widget></item><item><widget class="QCheckBox" name="checkBox_update"><property name="sizePolicy"><sizepolicy hsizetype="Maximum" vsizetype="Fixed"><horstretch>0</horstretch><verstretch>0</verstretch></sizepolicy></property><property name="text"><string>Updating</string></property></widget></item><item><spacer name="verticalSpacer"><property name="sizePolicy"><sizepolicy hsizetype="Fixed" vsizetype="Expanding"><horstretch>0</horstretch><verstretch>0</verstretch></sizepolicy></property><property name="orientation"><enum>Qt::Orientation::Vertical</enum></property><property name="sizeHint" stdset="0"><size><width>20</width><height>40</height></size></property></spacer></item></layout></item></layout></item><item><widget class="QLineEdit" name="lineEdit_msg"><property name="sizePolicy"><sizepolicy hsizetype="Expanding" vsizetype="Fixed"><horstretch>0</horstretch><verstretch>0</verstretch></sizepolicy></property></widget></item></layout></widget><customwidgets><customwidget><class>QQuickWidget</class><extends>QWidget</extends><header location="global">QtQuickWidgets/QQuickWidget</header></customwidget></customwidgets><resources/><connections/>
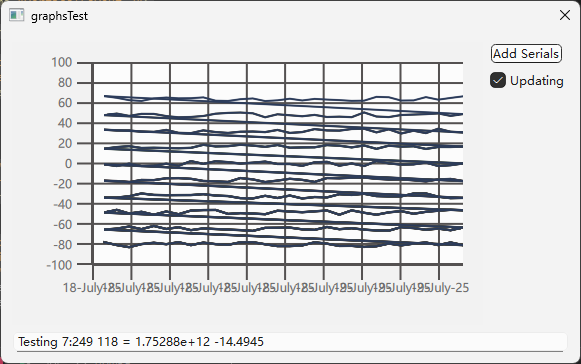
</ui>3. 運行效果
運行效果如下,主要問題包括(BUG):
- 新插入的對象的色彩,會影響到舊對象的色彩。
- 各個連線的收尾會連接起來。
4 評價
Qt 團隊看起來對傳統的 Widgets 已經不是很愿意維護了,這種大規模的API變化,以及完全不顧及兼容老計算機、集成顯卡的環境的激進改進,要么是公司no zuo no die,要么說明QML技術的趨勢已經勢不可擋。
QML技術與C++的緊密互動,相當程度的緩解了API跨語言的問題,其實QML就是個調用C++ QObject 運行時的膠水語言,其和C++的聯系非常緊密。對Qt Widgets而言,如果使用了 QML的功能,就會在硬件兼容性上面大打折扣,這對于很多桌面場景而言是不能接受的。對未來技術的發展,我們會保持持續的跟蹤,并適時為我們使用 charts 的既有代碼進行 graphs的適配,并在具備 charts 的環境下優先使用 charts.
)


)


![[Python] -項目實戰7- 用Python和Tkinter做一個圖形界面小游戲](http://pic.xiahunao.cn/[Python] -項目實戰7- 用Python和Tkinter做一個圖形界面小游戲)
+ OpenCV 顯示圖片的3種方法)


