在現代應用程序開發中,數據可視化是一個關鍵部分。本文將介紹如何使用 Java Swing 和 XChart 庫創建各種類型的圖表。XChart 是一個輕量級的圖表庫,支持多種類型的圖表,非常適合在 Java 應用中進行快速的圖表繪制。
1、環境配置
在開始之前,我們需要確保項目中包含了 XChart 的依賴。以下是在 Maven 項目中的 pom.xml 文件中添加 XChart 依賴的方法:
<dependency><groupId>org.knowm.xchart</groupId><artifactId>xchart</artifactId><version>3.8.0</version>
</dependency>
2、創建不同類型的圖表
以下是如何使用 XChart 創建不同類型的圖表的示例代碼。
面積圖
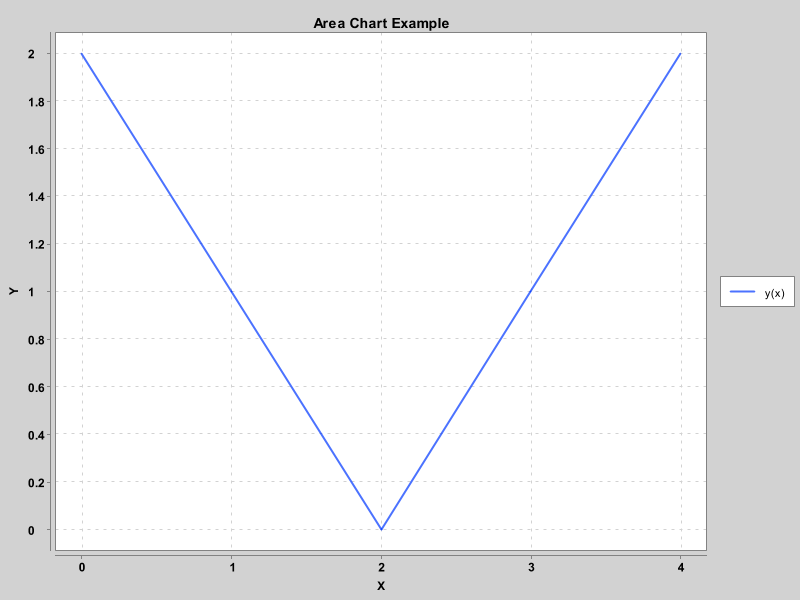
public class AreaChartExample extends JFrame {public AreaChartExample() {// 創建圖表XYChart chart = new XYChartBuilder().width(800).height(600).title("Area Chart Example").xAxisTitle("X").yAxisTitle("Y").build();// 添加數據double[] xData = new double[] {0.0, 1.0, 2.0, 3.0, 4.0};double[] yData = new double[] {2.0, 1.0, 0.0, 1.0, 2.0};chart.addSeries("y(x)", xData, yData).setMarker(SeriesMarkers.NONE).setFillColor(new Color(0, 0, 255, 50));// 將圖表面板添加到 JFrameJPanel chartPanel = new XChartPanel<>(chart);getContentPane().add(chartPanel, BorderLayout.CENTER);}public static void main(String[] args) {SwingUtilities.invokeLater(() -> {AreaChartExample example = new AreaChartExample();example.setDefaultCloseOperation(WindowConstants.EXIT_ON_CLOSE);example.pack();example.setVisible(true);});}
}
柱狀圖
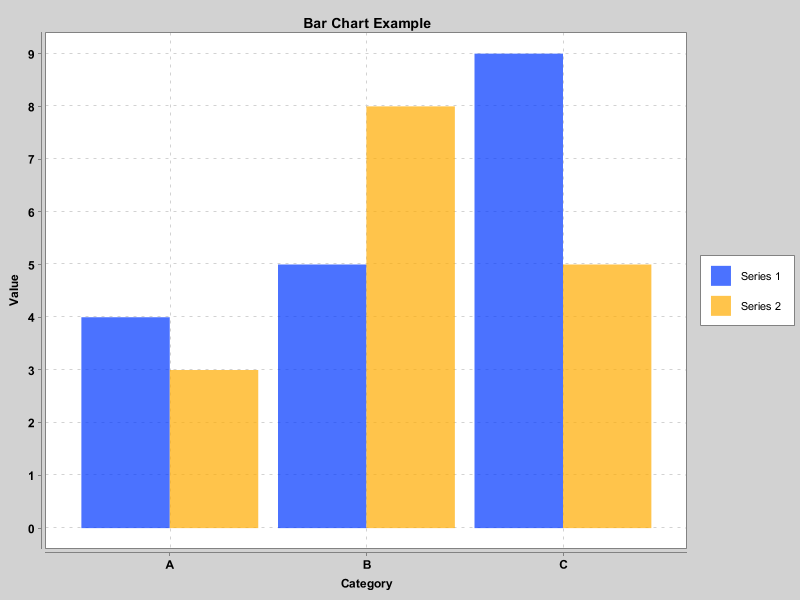
public class BarChartExample extends JFrame {public BarChartExample() {// 創建圖表CategoryChart chart = new CategoryChartBuilder().width(800).height(600).title("Bar Chart Example").xAxisTitle("Category").yAxisTitle("Value").build();// 添加數據List<String> categories = Arrays.asList("A", "B", "C");List<Number> series1Values = Arrays.asList(4, 5, 9);List<Number> series2Values = Arrays.asList(3, 8, 5);chart.addSeries("Series 1", categories, series1Values);chart.addSeries("Series 2", categories, series2Values);// 將圖表面板添加到 JFrameJPanel chartPanel = new XChartPanel<>(chart);getContentPane().add(chartPanel, BorderLayout.CENTER);}public static void main(String[] args) {SwingUtilities.invokeLater(() -> {BarChartExample example = new BarChartExample();example.setDefaultCloseOperation(WindowConstants.EXIT_ON_CLOSE);example.pack();example.setVisible(true);});}
}
氣泡圖
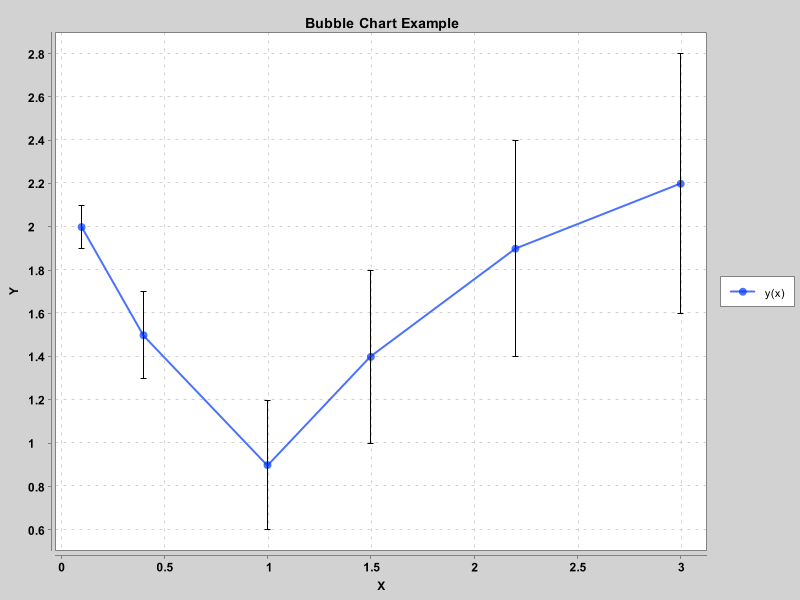
public BubbleChartExample() {// 創建圖表XYChart chart = new XYChartBuilder().width(800).height(600).title("Bubble Chart Example").xAxisTitle("X").yAxisTitle("Y").build();// 添加數據double[] xData = new double[] {0.1, 0.4, 1.0, 1.5, 2.2, 3.0};double[] yData = new double[] {2.0, 1.5, 0.9, 1.4, 1.9, 2.2};double[] bubbleSize = new double[] {0.1, 0.2, 0.3, 0.4, 0.5, 0.6};chart.addSeries("y(x)", xData, yData, bubbleSize).setMarker(SeriesMarkers.CIRCLE);// 將圖表面板添加到 JFrameJPanel chartPanel = new XChartPanel<>(chart);getContentPane().add(chartPanel, BorderLayout.CENTER);}public static void main(String[] args) {SwingUtilities.invokeLater(() -> {BubbleChartExample example = new BubbleChartExample();example.setDefaultCloseOperation(WindowConstants.EXIT_ON_CLOSE);example.pack();example.setVisible(true);});}
折線圖
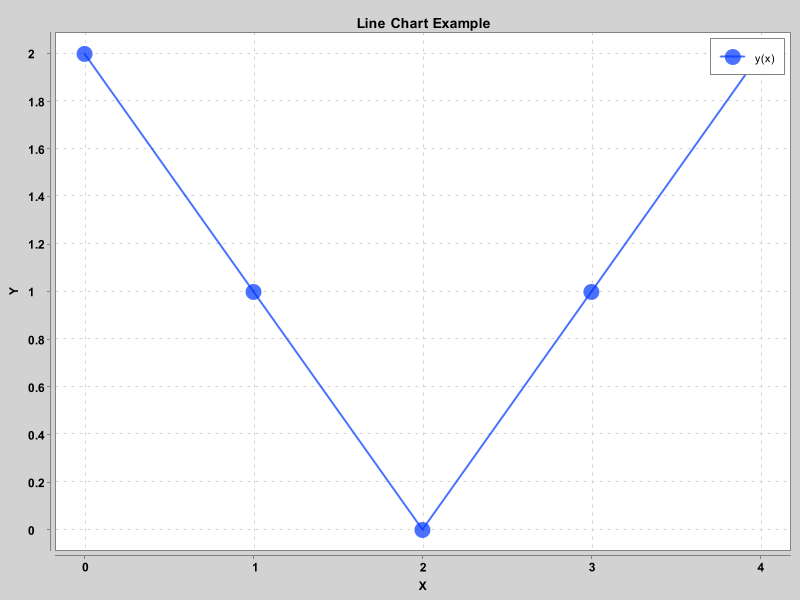
public class LineChartExample extends JFrame {public LineChartExample() {// 創建圖表XYChart chart = new XYChartBuilder().width(800).height(600).title("Line Chart Example").xAxisTitle("X").yAxisTitle("Y").build();// 自定義圖表樣式chart.getStyler().setLegendPosition(Styler.LegendPosition.InsideNE);chart.getStyler().setMarkerSize(16);// 添加數據double[] xData = new double[] {0.0, 1.0, 2.0, 3.0, 4.0};double[] yData = new double[] {2.0, 1.0, 0.0, 1.0, 2.0};chart.addSeries("y(x)", xData, yData);// 將圖表面板添加到 JFrameJPanel chartPanel = new XChartPanel<>(chart);getContentPane().add(chartPanel, BorderLayout.CENTER);}public static void main(String[] args) {SwingUtilities.invokeLater(() -> {LineChartExample example = new LineChartExample();example.setDefaultCloseOperation(WindowConstants.EXIT_ON_CLOSE);example.pack();example.setVisible(true);});}
}
餅圖
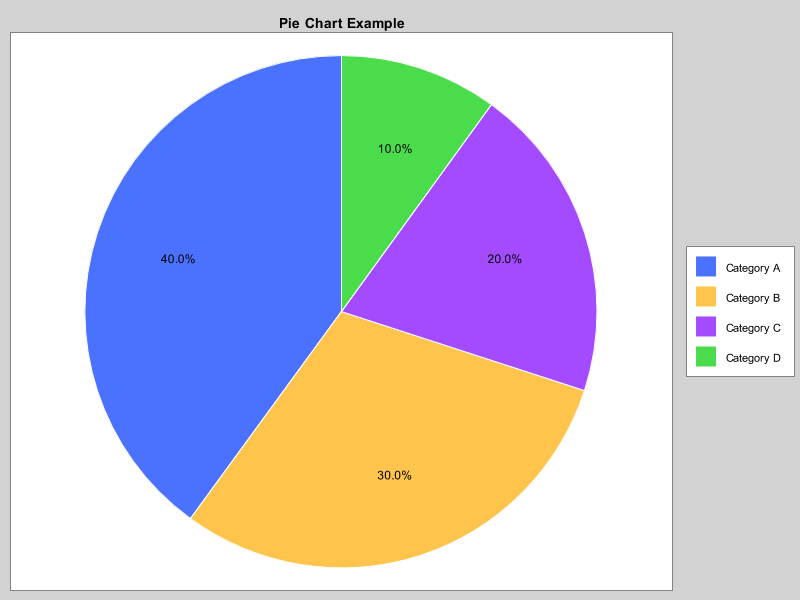
public class PieChartExample extends JFrame {public PieChartExample() {// 創建圖表PieChart chart = new PieChartBuilder().width(800).height(600).title("Pie Chart Example").build();// 添加數據chart.addSeries("Category A", 40);chart.addSeries("Category B", 30);chart.addSeries("Category C", 20);chart.addSeries("Category D", 10);// 將圖表面板添加到 JFrameJPanel chartPanel = new XChartPanel<>(chart);getContentPane().add(chartPanel, BorderLayout.CENTER);}public static void main(String[] args) {SwingUtilities.invokeLater(() -> {PieChartExample example = new PieChartExample();example.setDefaultCloseOperation(WindowConstants.EXIT_ON_CLOSE);example.pack();example.setVisible(true);});}
}
階梯圖
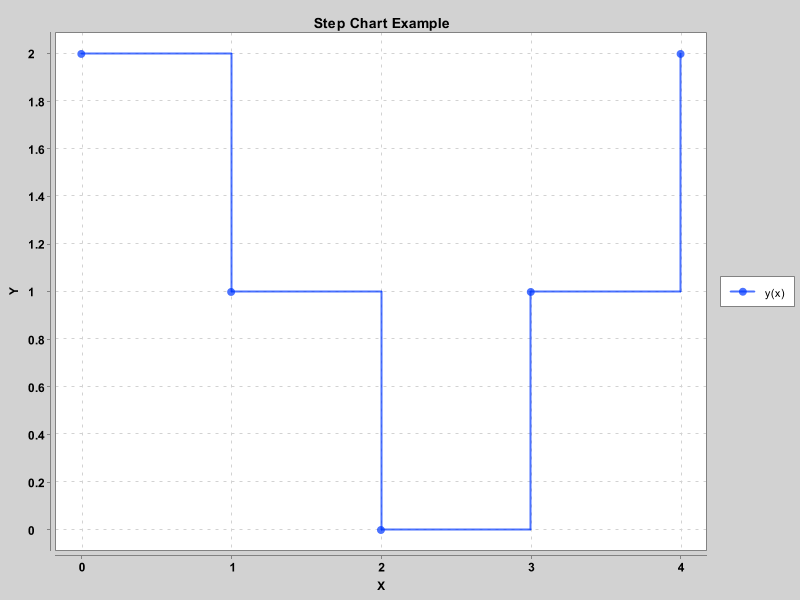
public class StepChartExample extends JFrame {public StepChartExample() {// 創建圖表XYChart chart = new XYChartBuilder().width(800).height(600).title("Step Chart Example").xAxisTitle("X").yAxisTitle("Y").build();// 添加數據double[] xData = new double[] {0.0, 1.0, 2.0, 3.0, 4.0};double[] yData = new double[] {2.0, 1.0, 0.0, 1.0, 2.0};chart.addSeries("y(x)", xData, yData).setXYSeriesRenderStyle(XYSeries.XYSeriesRenderStyle.Step);// 將圖表面板添加到 JFrameJPanel chartPanel = new XChartPanel<>(chart);getContentPane().add(chartPanel, BorderLayout.CENTER);}public static void main(String[] args) {SwingUtilities.invokeLater(() -> {StepChartExample example = new StepChartExample();example.setDefaultCloseOperation(WindowConstants.EXIT_ON_CLOSE);example.pack();example.setVisible(true);});}
}
3、總結
通過本文的示例代碼,您可以在 Java 應用程序中輕松創建多種類型的圖表。XChart 提供了簡單且強大的 API,能夠滿足大多數數據可視化需求。希望這些示例能幫助您更好地理解如何使用 XChart 進行數據可視化。


在LCD上顯示文字)


】Nios II軟件開發人員手冊中設計位置的錯誤示例)

)


——結合案例正式搭建項目)

- OOM問題排查)
