參考文獻
Recently, I am attracted by the news that Tanzania has attained lower middle income status under the World Bank’s classification, five years ahead of projection. Being curious on how they make the judgement, I take a look of the World Bank’s official website here.
[R ecently,我被這個消息,坦桑尼亞已經達到中等偏下收入水平世界銀行的分類下,領先的投影五年吸引。 我對他們如何做出判斷感到好奇,所以我在這里瀏覽了世界銀行的官方網站。
Basically, the World Bank classifies the world’s economies into four income groups — high, upper-middle, lower-middle and low by considering Gross National Income (GNI) per capita (current US$).
基本上,世界銀行考慮到人均國民總收入(現價美元),將世界經濟分為四個收入組別:高收入,中上收入,低中收入和低收入。
Undoubtedly, the indicator is a great one representing the average income level of residents essentially living in the economy territory, which in turn captures the overall economic development level of the country. Nonetheless, I believe the picture should be more than that since countries within the same income group may still vary a lot in different aspects.
毫無疑問,該指標是一個很好的指標,代表了基本上生活在經濟領土內的居民的平均收入水平,從而反映了該國的總體經濟發展水平。 盡管如此,我相信情況應該不止如此,因為同一收入組中的國家在不同方面仍可能有很大差異。
Therefore, based on a group of interesting indicators selected from the World Bank database, I first try to apply factor analysis to see what dimension these indicators could represent, followed by cluster analysis to re-classify the economies. Hopefully, this article would help us understand the world in a better way. For the codes of this article, you can refer to the Github link here.
因此,基于從世界銀行數據庫中選擇的一組有趣的指標,我首先嘗試進行因子分析以了解這些指標可以代表什么維度 ,然后進行聚類分析以對經濟進行重新分類 。 希望本文能夠幫助我們更好地了解世界。 有關本文的代碼,您可以在此處參考Github鏈接。
數據 (Data)
First of all, 29 indicators in different aspects are selected for this work. To prevent some potential bias caused by numerical indicators with significant scale difference, such as Gross Domestic Products (GDP) or Population size, I have mainly chosen ratio or growth indicators, with some non-traditional ones included, such as diabetes prevalence and mobile cellular subscriptions.
開始步驟的是,在不同的方面29個指標被選擇用于這項工作。 為了避免由具有顯著規模差異的數字指標(例如國內生產總值(GDP)或人口規模)引起的某些潛在偏差,我主要選擇比率或增長指標,其中包括一些非傳統指標,例如糖尿病患病率和移動電話訂閱。
指標選擇 (Indicators selected)
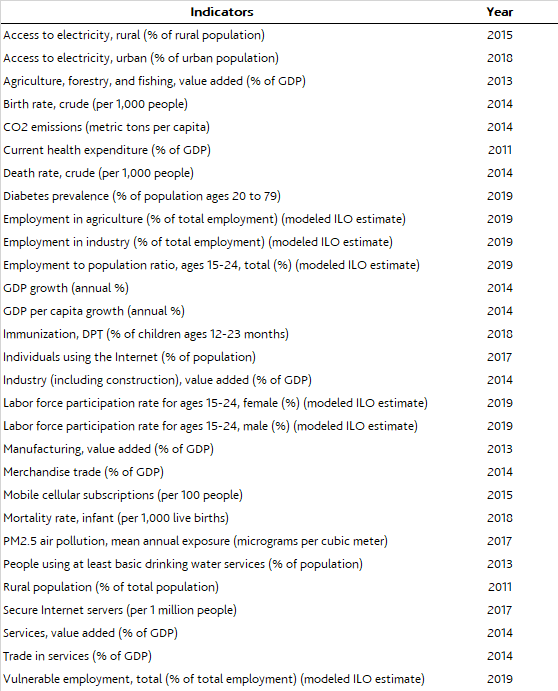
From the above list, you may notice that the year for indicators are not the same due to data availability. And I believe this is one of the major reasons why the World bank uses single indicator (GNI per capita) for economies classification.
從上面的列表中,您可能會注意到由于數據的可用性,指標的年份不相同。 我認為,這是世界銀行使用單一指標(人均國民總收入)進行經濟分類的主要原因之一。
The best we can do is to pick the indicators with a reasonable amount of countries provided the data (> 140 economies), and then choose the most recent year. After filtering, there are totally 159 countries included in this exercise.
我們能做的最好的事情就是從提供數據的國家中選擇合理的指標(> 140個經濟體),然后選擇最近的年份。 篩選之后,此練習總共包括159個國家/地區 。
相關矩陣 (Correlation matrix)
Now, let’s take a look of the relationships between the indicators by plotting a correlation matrix using the following codes.
現在,通過使用以下代碼繪制相關矩陣,讓我們看一下指標之間的關系。
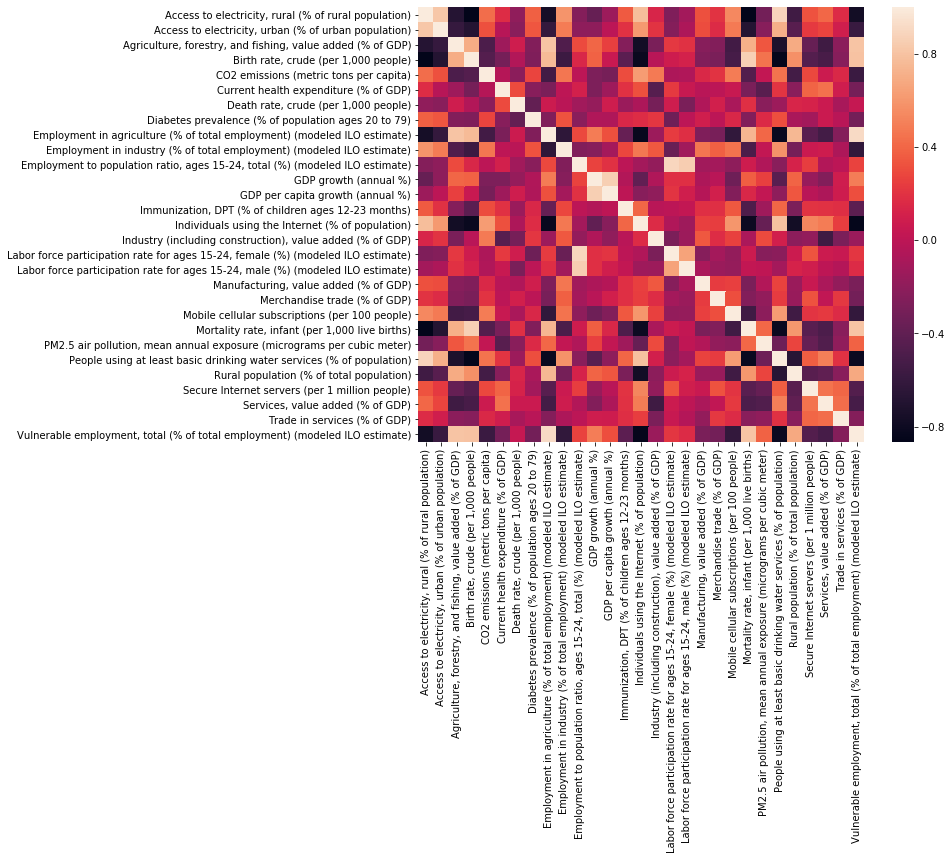
From the correlation matrix, we can observe some interesting but reasonable relationships. For example,
從相關矩陣中,我們可以觀察到一些有趣但合理的關系。 例如,
(a) Positive relationship between access to electricity (% of population) and percentage of people using at least basic drinking water services — Electricity and drinking water are basic services in the society. Both should be developed simultaneously in similar stage, and hence have similar level of accessibility within a country.
(a) 電力供應(人口百分比)與至少使用基本飲用水服務的人口比例之間的正相關關系 —電力和飲用水是社會的基本服務。 兩者應在相似的階段同時開發,因此在一個國家內具有相似的可訪問性級別。
(b) Positive relationship between vulnerable employment (% of total employment) and employment in agriculture (% of total employment) — Compared to employment in industrial and services sector, employment in agriculture should be more vulnerable.
(b) 脆弱就業(占總就業的百分比)與農業就業(占總就業的百分比 ) 之間的正相關關系 -與工業和服務業的就業相比,農業就業應更脆弱。
(c) Negative relationship between rural population (% of population) and individuals using the Internet (% of population) — Higher proportion of rural population in total, less developed the economy may be. So the proportion of rural population is negatively correlated with the percentage of individuals with access to the Internet, which represents the technological development of an economy.
(c) 農村人口(占人口的百分比)與使用互聯網的個人之間的負關系(占人口的百分比) -農村人口占總人口的比例較高,經濟可能較不發達。 因此,農村人口的比例與可以訪問互聯網的個人的比例呈負相關,這代表了經濟的技術發展。
因子分析 (Factor analysis)
In fact, there are many other interesting relationships among the variables. In order to understand the whole picture in a faster and better way, we can apply factor analysis to reduce the 29 indicators into fewer numbers of factors.
事實上 ,還有變量之間許多其他有趣的關系。 為了以更快更好的方式了解整個情況,我們可以應用因子分析將29個指標減少為更少的因子。
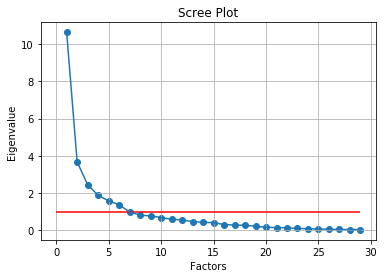
But how many factors should be reduced to ? We can get an idea by plotting a scree plot with number of factors in the x-axis, and the eigenvalue in the y-axis. Generally, if a factor’s eigenvalue is greater than or close to one, we would include that. The scree plot below shows that there could be 7 factors.
但是應該減少多少因素呢? 我們可以通過在x軸上繪制帶有多個因子的scree圖,在y軸上繪制特征值來獲得一個想法。 通常,如果一個因素的特征值大于或接近一個,我們將包括在內。 下面的卵石圖顯示可能有7個因素。
For the concepts behind factor analysis, this article gives a good explanation.
對于因素分析背后的概念, 本文給出了很好的解釋。
碎石圖 (Scree plot)
負載解釋的方差 (Variance explained by loadings)
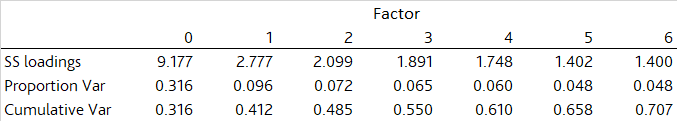
The selection of 7 factors has explained 71% of total variance of the 29 indicators. The higher the percentage, the better the model is.
選擇7個因子可以解釋29個指標的總方差的71%。 百分比越高,模型越好。
因子負荷 (Factor Loadings)
Next, we take a look of the heatmap of factor loading, which is basically the correlation coefficient for the variable and factor. It shows the variance explained by the variable on that particular factor.
接下來,我們看一下因子加載的熱圖,它基本上是變量和因子的相關系數。 它顯示了由該特定因子上的變量解釋的方差。
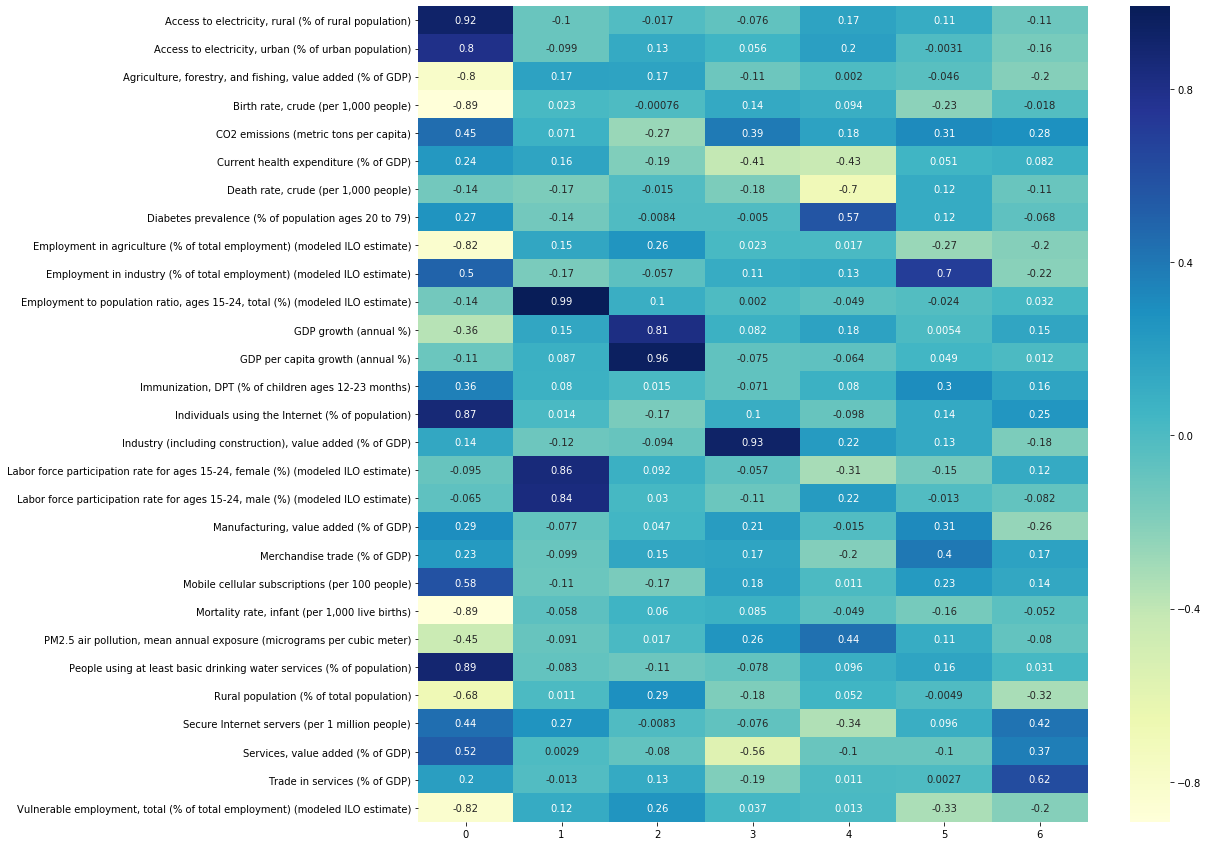
Let’s investigate in-depth of the 7 factors’ meaning, and see which variables have high correlation with each factor. Please note that the below interpretation is subjective.
讓我們深入研究這七個因素的含義,并查看哪些變量與每個因素具有高度相關性。 請注意,以下解釋是主觀的。
Factor 0 — Access to essential services in society (Access to electricity for rural / urban population, individuals using the Internet and people using at least basic drinking water services, mobile cellular subscriptions)
因素0 — 獲得社會基本服務 (農村/城市人口,使用互聯網的人和至少使用基本飲用水服務的人,移動蜂窩訂閱的人獲得電力)
Factor 1 — Youth employment situation (Employment to population ratios, ages 15–24, labor force participation ratio for ages 15–24, female / male)
因素1 — 青年就業狀況 (就業與人口的比例,15-24歲,15-24歲的勞動力參與率,男女)
Factor 2 — Overall economic growth (GDP growth rate and GDP per capita growth rate)
要素2- 總體經濟增長 (GDP增長率和人均GDP增長率)
Factor 3 — Industrial development (Value added of industry (including construction) and CO2 emissions)
因素3 — 工業發展 (工業增加值(包括建筑業)和CO2排放量)
Factor 4 — Health situation (Diabetes prevalence and PM2.5 air pollution) Many studies have solidified the link between particulates from cars and diabetes. If you are interested, this article is a good one.
因素4 — 健康狀況 (糖尿病患病率和PM2.5空氣污染)許多研究已經鞏固了汽車微粒與糖尿病之間的聯系。 如果您有興趣,這篇 文章 是不錯的。
Factor 5 — Capability in manufacturing & trade of manufactured goods (Employment in industry, merchandise trade and value added of manufacturing)
因素5 — 制成品的制造和貿易能力 (工業就業,商品貿易和制造業增加值)
Factor 6 — Professional services development (Trade in services, value added of services and secure internet servers)
要素6- 專業服務開發 ( 服務 貿易,服務增值和安全的互聯網服務器)
Now, we know that the 7 factors are representing seven completely different aspects of an economy. However, a few indicators have very low correlation with all 7 factors, i.e. birth rate, death rate and infant mortality rate. Such low correlation may make sense as these indicators are more like the end-products of many elements in the economy. Thus, it is difficult to group them into any factors mentioned above.
現在,我們知道這七個因素代表了經濟的七個完全不同的方面。 但是,一些指標與所有七個因素(即出生率,死亡率和嬰兒死亡率)的相關性都非常低。 如此低的相關性可能是有道理的,因為這些指標更像經濟中許多要素的最終產品。 因此,很難將它們分為上述任何因素。
聚類分析 (Cluster analysis)
Next, we will apply cluster analysis to classify the economies. In the followings, we would apply one of the most commonly used method — hierarchical clustering, with bottom up approach, Euclidean distance and Ward’s method to calculate the similarity. For detailed explanation of hierarchical clustering, this article gives a very good lesson.
?分機,我們將運用聚類分析,經濟分類。 在下文中,我們將應用最常用的方法之一— 層次聚類,自下而上的方法,歐氏距離和Ward的方法來計算相似度 。 有關層次結構群集的詳細說明, 本文提供了一個很好的課程。
標準化 (Standardization)
Each indicator has its own scale. For example, the proportion of rural population in total is always higher than GDP growth rate. To prevent such scale difference leading to unparalleled weights and unreliable conclusion, we have to first standardize the data.
每個指標都有自己的標度。 例如,農村人口占總人口的比例始終高于GDP增長率。 為了防止這種規模差異導致無與倫比的權重和不可靠的結論,我們必須首先對數據進行標準化。
層次聚類分析 (Hierarchical cluster analysis)
After standardizing the data, we can perform clustering using a library called AgglomerativeClustering.
標準化數據后,我們可以使用稱為AgglomerativeClustering的庫執行聚類。
And to visualize the clustering result, Dendrogram, a tree-like diagram that records the sequences of merges or splits, is applied. However, please note that the number of cluster finally formed is completely based on your judgement. If there are too many clusters, the classification may be too detailed. If too few, the economies may not be well classified.
為了可視化聚類結果, Dendrogram 應用記錄合并或拆分序列的樹狀圖。 但是,請注意,最終形成的簇的數量完全取決于您的判斷。 如果群集太多,分類可能會太詳細。 如果數量太少,可能無法很好地分類經濟。
樹狀圖 (Dendrogram)
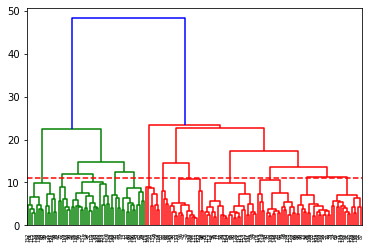
From the dendrogram plot, there could be 12 clusters. And based on this choice, we next apply the function AgglomerativeClustering on the datasets, by setting n_clusters as 12, affinity as euclidean distance, and linkage as Ward’s method.
根據樹狀圖,可能有12個簇。 然后根據此選擇,通過將n_clusters設置為12,將親和力設置為歐氏距離,并將鏈接設置為Ward's方法,將函數AgglomerativeClustering應用于數據集。
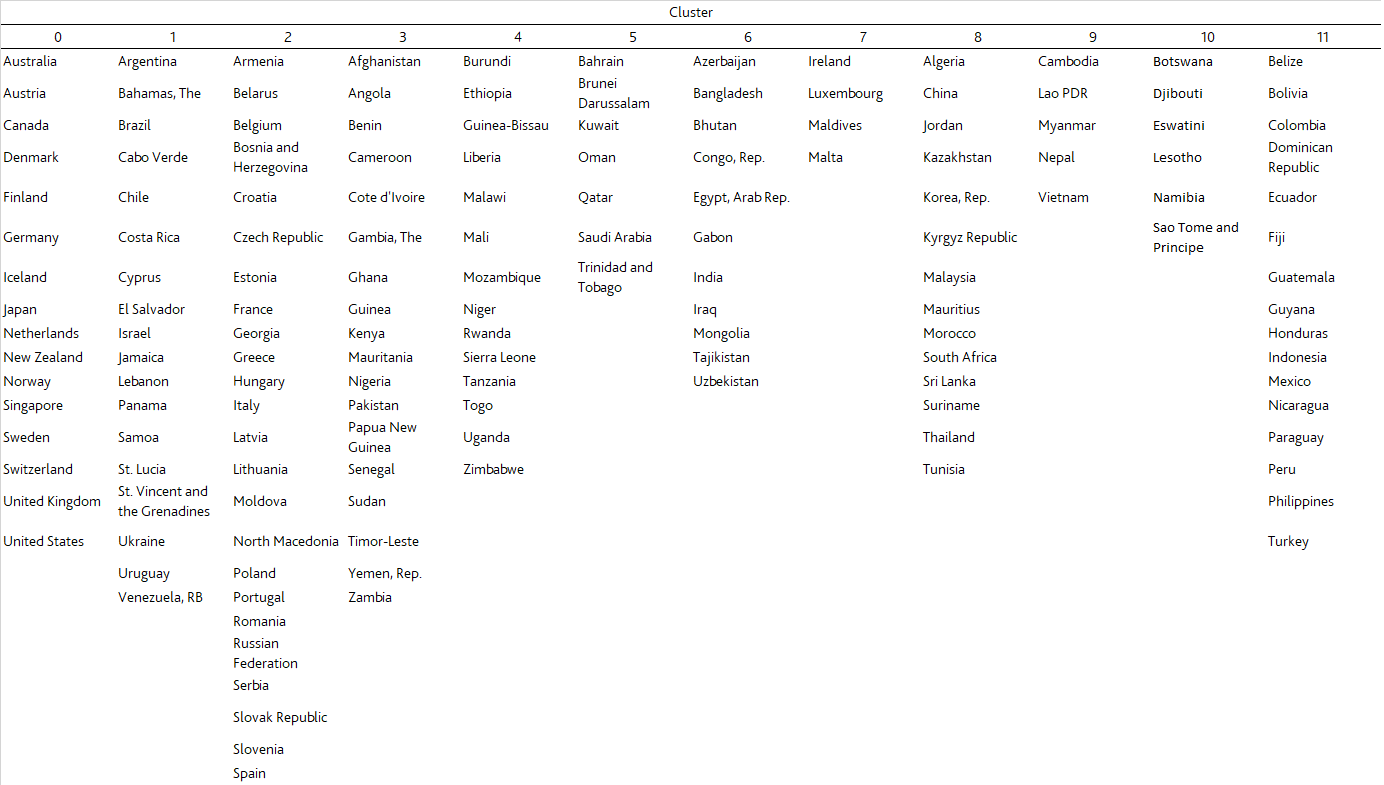
國家按類別列出 (Countries list by clusters)
The clustering result is shown in the form of a country list in the followings.
以下以國家列表的形式顯示聚類結果。
集群的特征 (Characteristics of the clusters)
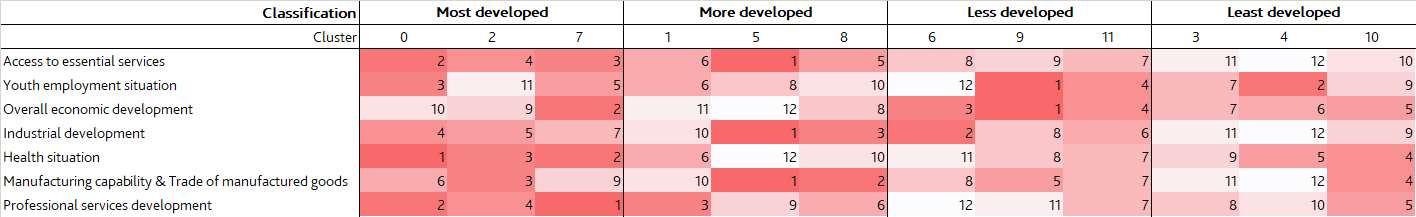
After grouping the 159 countries into 12 clusters, the most important is to understand the characteristics of each cluster, and investigate why the countries are grouped together. So let’s take a look of the heatmap below. I have extracted the 20 variables having high correlation with the 7 factors, and sorted by factor groups, i.e. first five rows represent Factor 0 — Access to essential services in society.
將159個國家/地區劃分為12個類別后,最重要的是了解每個類別的特征,并調查為什么將這些國家/地區分組在一起。 因此,讓我們看一下下面的熱圖。 我提取了與7個因子高度相關的20個變量,并按因子組進行了排序,即前五行代表因子0-獲得社會基本服務的機會。
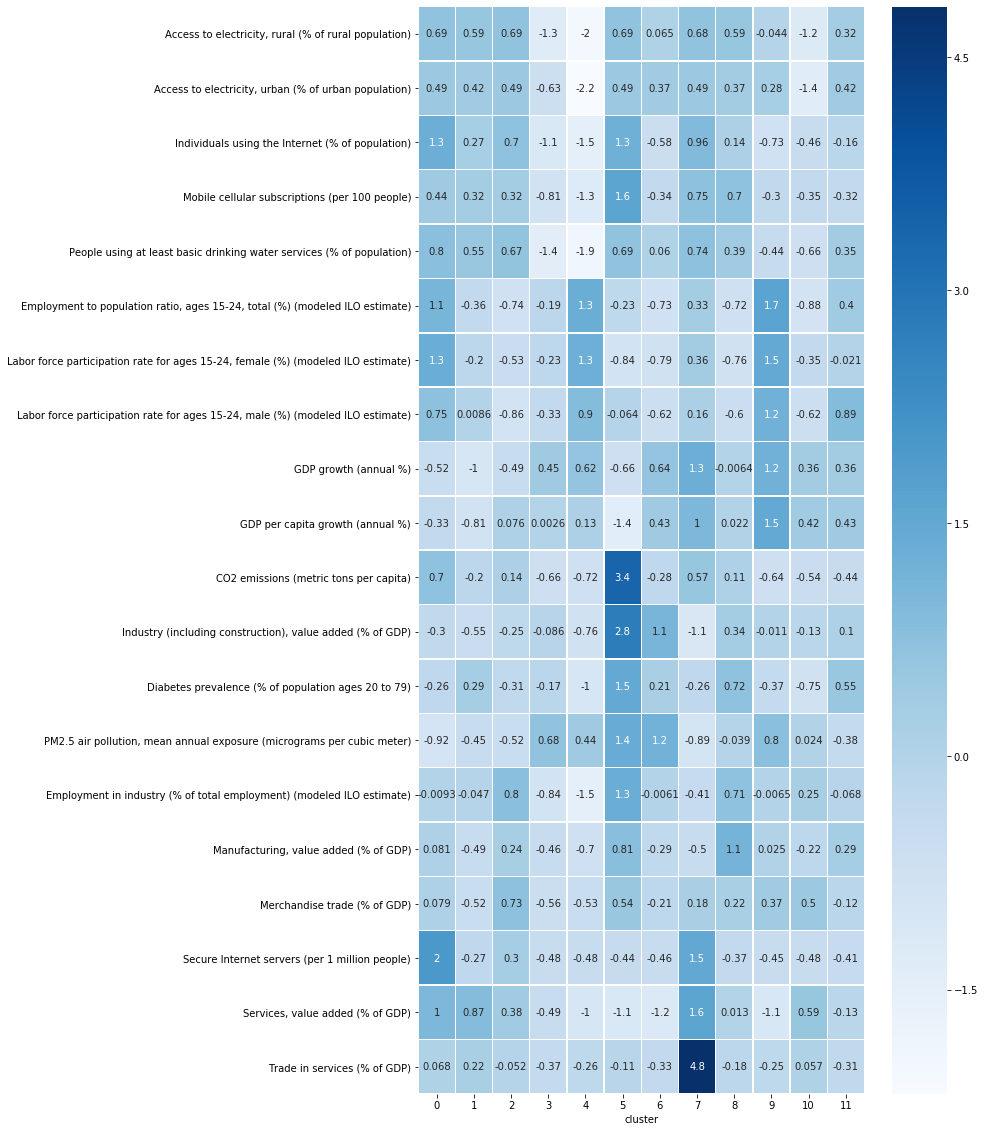
Based on the clusters’ characteristics, I try to further group the 12 clusters into 4 big categories (Most developed, more developed, less developed and least developed economies). However, even within the big group, clusters’ characteristics still vary a bit. Please refer to the detailed descriptions below.
根據集群的特征,我嘗試將12個集群進一步分為4大類( 最發達,較發達,欠發達和最不發達的經濟體 )。 但是,即使在大集團內部,集群的特征仍然有所不同。 請參考下面的詳細說明。
最發達的經濟體 (Most developed economies)
Common characteristics: Excellent accessibility to essential services in society, good industrial development and relatively good health situation
共同特點:良好的社會基本服務可及性,良好的工業發展和相對良好的健康狀況
Cluster 0 (United States, United Kingdom and Japan) — high youth labor force participation level but slow economic growth
第0組 (美國,英國和日本)—青年勞動力參與水平高,但經濟增長緩慢
Cluster 2 (France, Italy and Spain) — Great capability in trading manufactured goods but low youth labor force participation level
第2組 (法國,意大利和西班牙)—交易制成品的能力強,但青年勞動力的參與水平低
Cluster 7 (Ireland and Luxembourg) — very fast economic growth and excellent professional services development but relatively weak capability in manufacturing
第7組 (愛爾蘭和盧森堡)-經濟快速增長和出色的專業服務發展,但制造業能力相對較弱
較發達的經濟體 (More developed economies)
Common characteristics: Good accessibility to essential services but relatively lower level in both youth labor force participation and professional services development
共同特點:基本服務的可及性良好,但青年勞動力參與和專業服務發展水平相對較低
Cluster 1 (Brazil, Argentina and Uruguay) — Poor industrial development and weak capability in manufacturing and trade of manufactured goods
第一組 (巴西,阿根廷和烏拉圭)-工業發展不佳,制成品的制造和貿易能力較弱
Cluster 5 (Qatar and Saudi Arabia) — Excellent industrial development but very poor health situation
第5組 (卡塔爾和沙特阿拉伯)-出色的工業發展,但健康狀況非常差
Cluster 8 (China, Korea and South Africa) — Good industrial development and manufacturing capability with moderate economic growth
第8組 (中國,韓國和南非)-良好的工業發展和制造能力,經濟增長適中
欠發達經濟體 (Less developed economies)
Common characteristics: Moderate capability in manufacturing and trade of manufactured goods but low level in professional services development and poor accessibility to essential services in society
共同特點:制成品的制造和貿易能力中等,但專業服務開發水平較低,社會上難以獲得基本服務
Cluster 6 (India, Egypt and Bangladesh) — great industrial development but very low level in youth labor force participation and poor health situation
第6組 (印度,埃及和孟加拉國)—工業發展良好,但青年勞動力參與水平很低,衛生狀況很差
Cluster 9 (Vietnam and Cambodia) — very high level in youth labor force participation and very fast economic growth
第9組 (越南和柬埔寨)-青年勞動力參與率很高,經濟增長非常快
Cluster 11 (Mexico, Indonesia and Philippines) — average industrial development and economic growth
第11組 (墨西哥,印度尼西亞和菲律賓)—平均工業發展和經濟增長
最不發達國家 (Least developed economies)
Common characteristics: Moderate economic growth but very poor industrial development and accessibility to essential services in society
共同特點:經濟增長適度,但工業發展非常差,無法獲得社會上的基本服務
Cluster 3 (Afghanistan, Pakistan and Cameroon) — very weak capability in manufacturing and trade of manufactured goods and relatively poorer health situation
第3組 (阿富汗,巴基斯坦和喀麥隆)-制成品的制造和貿易能力很弱,健康狀況相對較差
Cluster 4 (Zimbabwe and Uganda) — very high youth labor force participation level but poor professional services development and very weak capability in manufacturing and trade of manufactured goods
第4組 (津巴布韋和烏干達)-青年勞動力參與水平很高,但專業服務發展不佳,制成品的制造和貿易能力很弱
Cluster 10 (Djibouti and Namibia) — Above average capability in manufacturing and trade of manufactured goods but low youth labor force participation level
第10組 (吉布提和納米比亞)-制成品的制造和貿易能力高于平均水平,但青年勞動力參與水平較低
To summarize, please refer to the below heatmap. The number inside the box is the cluster’s ranking among all in that aspect (factor). The smaller the number, the better performance of the cluster in that aspect.
總結一下,請參考下面的熱圖。 框內的數字是該群集在各個方面(因子)中的排名。 數字越小,集群在該方面的性能越好。
與世界銀行當前分類的比較 (Comparison with the World Bank’s current classification)
Last but not least, it would be interesting to compare our classification (Most developed, more developed, less developed and least developed) with the World Bank’s (high, upper-middle, lower-middle and low income).
最后但并非最不重要的一點是,將我們的分類( 最發達,最發達,欠發達和最不發達 )與世界銀行的分類 ( 高,中上,中低和低收入 )進行比較會很有趣。
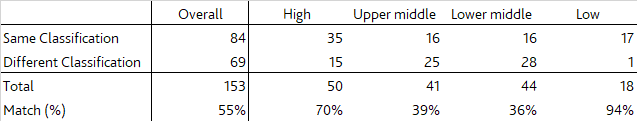
Based on the comparison table, 55% of the countries are classified into same group under the two classification methods. Surprisingly, a matching probability of 70% and 94% is attained for high income and low income group respectively. In contrast, the matching probability is relatively low (<40%) for the two middle income groups.
根據比較表, 采用兩種分類方法將55%的國家分類為同一組。 令人驚訝的是, 高收入和低收入人群的匹配率分別為70%和94% 。 相反,兩個中等收入群體的匹配概率相對較低(<40%)。
結論 (Conclusion)
The above result has indicated that the Gross National Income (GNI) per capita may have only shown half of the picture. There are many other stories beyond that, especially for the middle income group / developing economies. The economic models and social situation for these countries could differentiate a lot even they may have similar level of GNI per capita.
以上結果表明, 人均國民總收入(GNI)可能只顯示了一半 。 除此之外,還有許多其他故事,特別是對于中等收入群體/發展中經濟體而言。 即使這些國家的人均國民總收入水平相近,其經濟模式和社會狀況也可能有很大差異。
This article has made use of two popular statistical methods — Factor analysis and Cluster analysis to help us understand the economies from different dimensions and classify the countries. I hope this would raise your interests to analyze the world’s economies in more dimensions and have a deeper thought beyond the official classification.
本文利用了兩種流行的統計方法- 因子分析和聚類分析,以幫助我們從不同的維度理解經濟并對國家進行分類。 我希望這會引起您的興趣,以便從更多角度分析世界經濟,并在官方分類之外有更深入的思考。
Thank you very much, and see you next time.
非常感謝,下次見。
翻譯自: https://towardsdatascience.com/factor-analysis-cluster-analysis-on-countries-classification-1bdb3d8aa096
參考文獻
本文來自互聯網用戶投稿,該文觀點僅代表作者本人,不代表本站立場。本站僅提供信息存儲空間服務,不擁有所有權,不承擔相關法律責任。 如若轉載,請注明出處:http://www.pswp.cn/news/388750.shtml 繁體地址,請注明出處:http://hk.pswp.cn/news/388750.shtml 英文地址,請注明出處:http://en.pswp.cn/news/388750.shtml
如若內容造成侵權/違法違規/事實不符,請聯系多彩編程網進行投訴反饋email:809451989@qq.com,一經查實,立即刪除!相關文章

java語言靜態分析工具_PMD 6.16.0 發布,跨語言靜態代碼自動分析工具
![B1922 [Sdoi2010]大陸爭霸 最短路](http://pic.xiahunao.cn/B1922 [Sdoi2010]大陸爭霸 最短路)
B1922 [Sdoi2010]大陸爭霸 最短路

WPF中的鼠標事件詳解

數據統計 測試方法_統計測試:了解如何為數據選擇最佳測試!

)
spring的幾個通知(前置、后置、環繞、異常、最終)

每個Power BI開發人員的Power Query提示

c# PDF 轉換成圖片

java finally在return_Java finally語句到底是在return之前還是之后執行?


面試題:二叉樹的深度

a/b測試_如何進行A / B測試?

hibernate h2變mysql_struts2-hibernate-mysql開發案例 -解道Jdon

P5024 保衛王國

提取圖像感興趣區域_從圖像中提取感興趣區域

解決java compiler level does not match the version of the installed java project facet

php模板如何使用,ThinkPHP如何使用模板

理解Windows窗體和WPF中的跨線程調用

