第一步:下載數據集。
https://www.csie.ntu.edu.tw/~cjlin/libsvmtools/datasets/multiclass.html#pendigits
?
第二步:改變數據格式。
注:此數據集的各特征值均為像素,即屬于同一量綱,故無需歸一化步驟。
原格式為:8 1:88 2:92 3:2 4:99 5:16 6:66 7:94 8:37 9:70 12:24 13:42 14:65 15:100 16:100
改為:88 92 2 99 16 66 94 37 70 0 0 24 42 65 100 100 8
Java代碼:
?
public class dataformat {public static void main(String[] args) throws IOException{String filename = "pendigits.t";String outfilename = "pendigits";int demension = 16;try(Scanner in = new Scanner(new FileInputStream(filename));PrintWriter out = new PrintWriter(outfilename)){String line;while( in.hasNextLine()){line = in.nextLine();//按空格將數據切分String[] subComponent = line.trim().split(" ");//data用于記錄對應維度下的特征值String[] data = new String[demension];//第0個是類標,所以從1開始,構造樣例的全部特征值for (int i = 1; i < subComponent.length; ++i){String[] kv = subComponent[i].trim().split(":");//將對應維度下的特征值賦值。data[Integer.parseInt(kv[0])-1] = kv[1];}//sb用來構造一行樣例StringBuilder sb = new StringBuilder();for (int i = 0; i < demension; ++i){if (data[i] != null)sb.append(data[i]+" ");elsesb.append("0 "); //如果對應維度下的字符串為null,說明為0值。}sb.append(subComponent[0].trim());//末尾加類標out.println(sb.toString());	//寫文件}}}
}
第三步:Matlab作圖。
將處理好的文件pendigits加入MATLAB路徑;
新建腳本pcaVisual.m,代碼如下:
load pendigits; % 加載數據集,前提是pendigits文件在MATLAB路徑下
[m,n]=size(pendigits); % 獲得pendigts的行數m,列數n
[pc, score, latent, tsquare]=pca(pendigits(:,1:n-1));% pca是主成分分析算法,參數是需要降維的矩陣pendigits(:,1:n-1)——除去類標列。
% 返回的結果:
% pc是(n-1)*(n-1)系數矩陣,用它將pendigits(:,1:n-1)轉換為score
% score是轉換之后的特征值,大小為m*(n-1),按latent降序排列,按需取前k列,此處我們只需取前三列。
% latent:是一維列向量,大小為(n-1)*1,每一個數據是對應score里相應維的貢獻率,降序排列plot3(0,0,0); % plot(0,0)可用于展示2維圖形,但用旋轉按鈕進行拖動的話,可以看到,其實際就是3維。
hold on;% 根據樣例的列表來畫圖
for i=1:mswitch pendigits(i,n)case 0plot3(score(i,1),score(i,2),score(i,3),'y*');case 1plot3(score(i,1),score(i,2),score(i,3),'m*');case 2plot3(score(i,1),score(i,2),score(i,3),'c*');case 3plot3(score(i,1),score(i,2),score(i,3),'r*');case 4plot3(score(i,1),score(i,2),score(i,3),'g*');case 5plot3(score(i,1),score(i,2),score(i,3),'b*');case 6plot3(score(i,1),score(i,2),score(i,3),'w*');case 7plot3(score(i,1),score(i,2),score(i,3),'k*');case 8plot3(score(i,1),score(i,2),score(i,3),'kd');otherwiseplot3(score(i,1),score(i,2),score(i,3),'kv');end
end
?
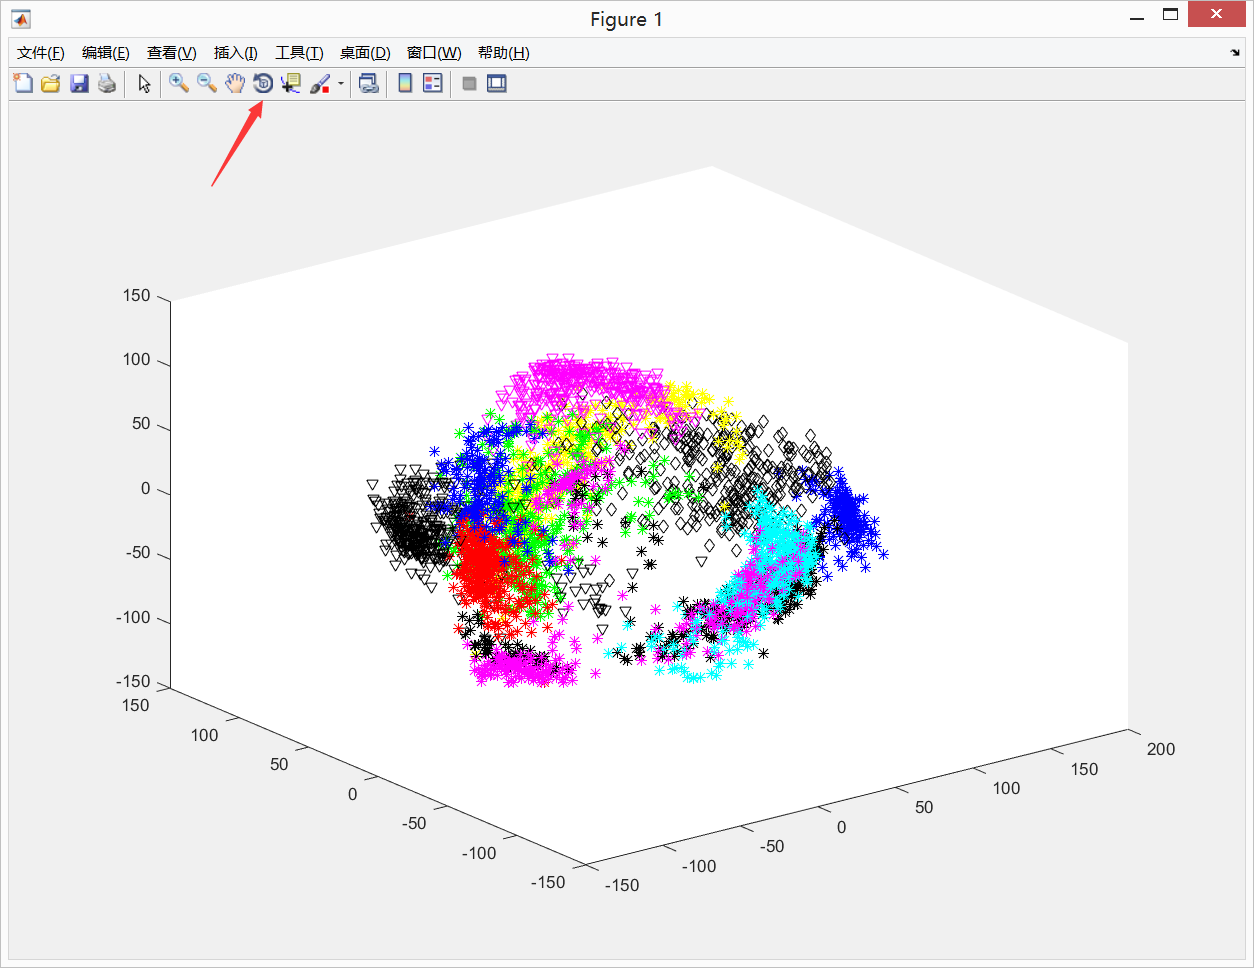
三維立體圖:
?
點擊箭頭所指按鈕可以三維旋轉來觀察其結構。
?
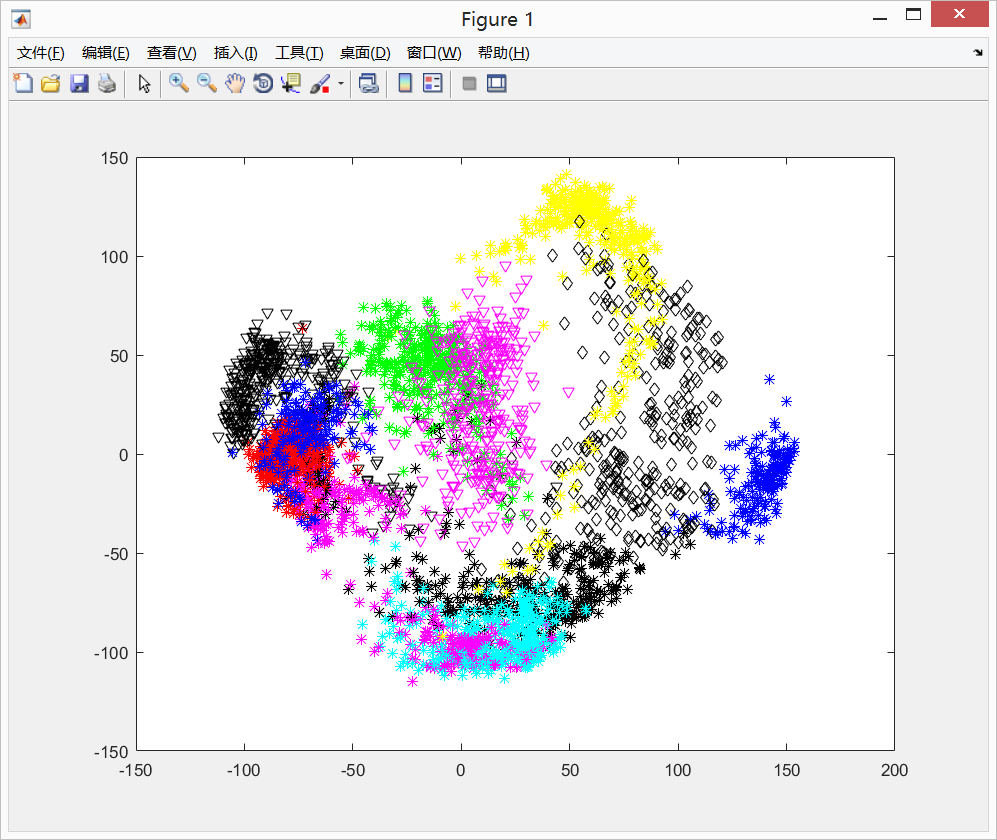
二維平面圖:
?
?


)

)


)


