使用地圖的三種的方式:
- 注冊地圖(用json或svg,注冊為地圖),然后使用map地圖
- 使用geo坐標系,地圖注冊后不是直接使用,而是注冊為坐標系。
- 直接使用百度地圖、高德地圖,使用百度地圖或高德地圖作為坐標系。
用json或svg注冊為地圖,然后使用map地圖
從DataV中獲取地圖數據。
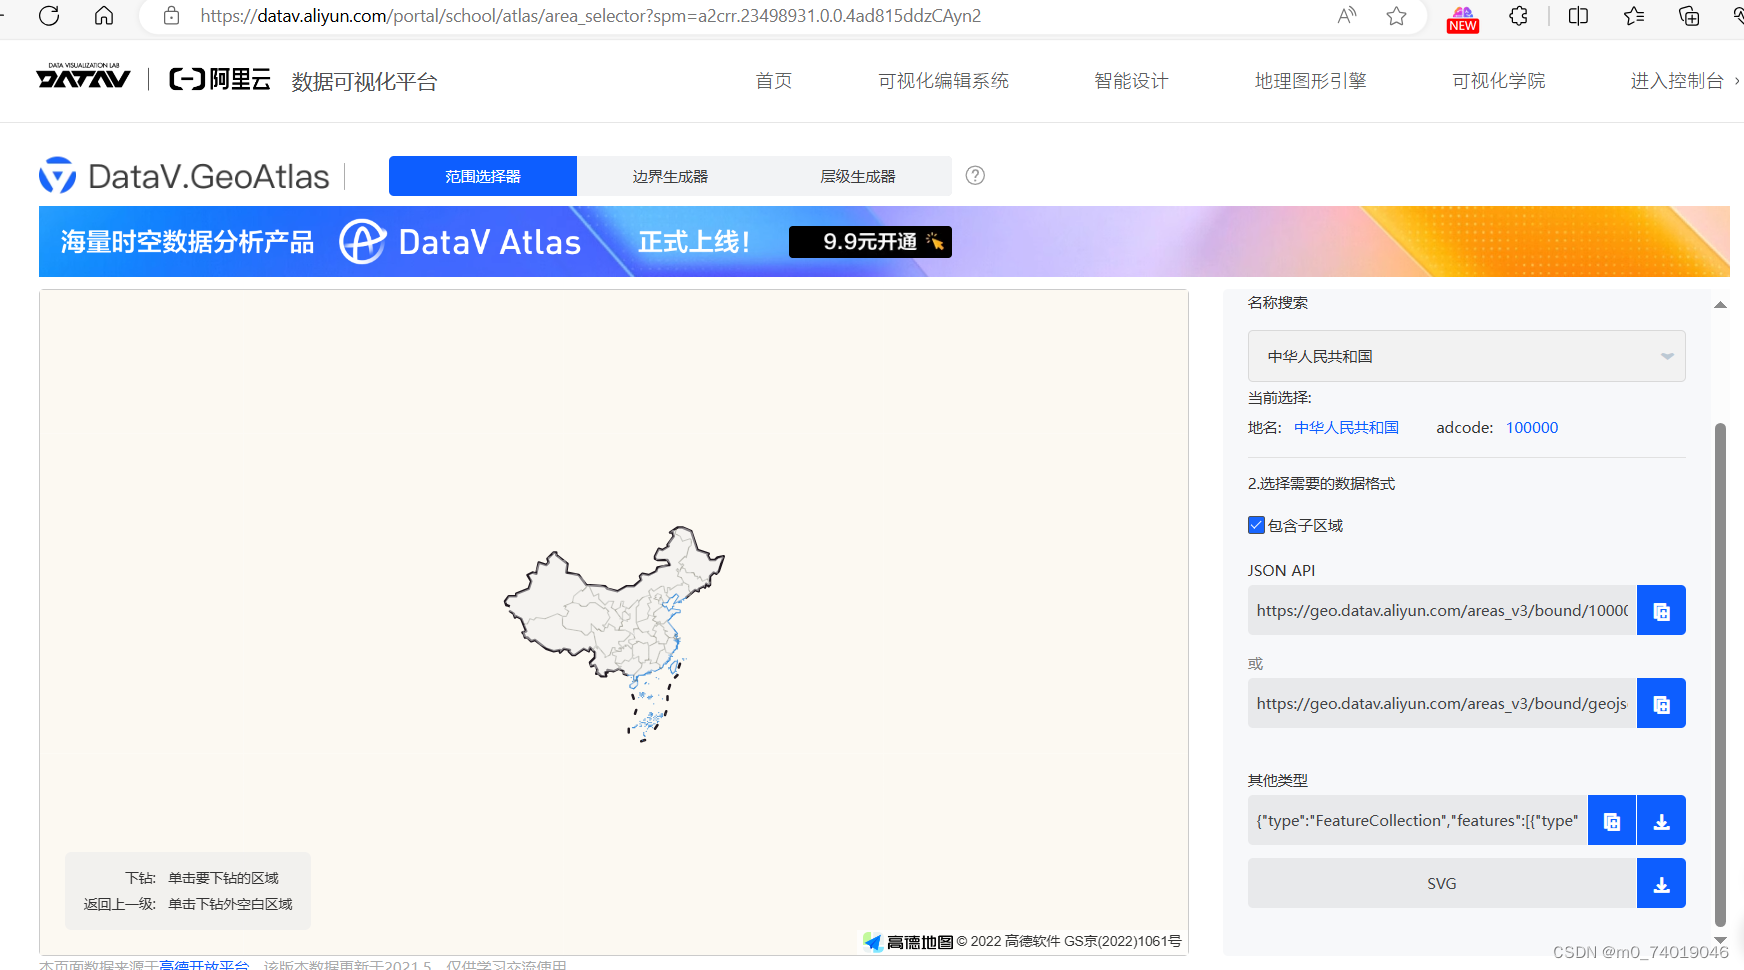
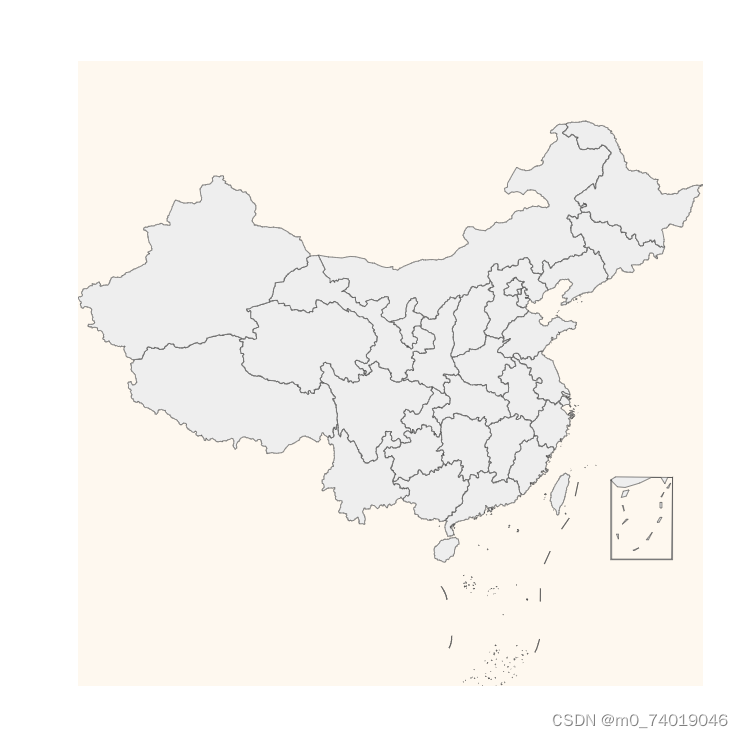
echarts.registerMap(“china”, china) 注冊地圖
map :使用 registerMap 注冊的地圖名稱。
import * as echarts from "echarts";
import { onMounted, watch } from "vue";
import "./vintage";
import china from "./china.json";
let myEcharts;
onMounted(() => {let canvas = document.getElementById("canvas");echarts.registerMap("china", china);myEcharts = echarts.init(canvas, "vintage", {width: 500,height: 500,devicePixelRatio: window.devicePixelRatio,locale: "ZH",});let options = {tooltip: {},series: [{type: "map",roam: true,width: 500,height: 500,map: "china",},],};rednderEcharts(options);
});function rednderEcharts(options) {myEcharts.setOption(options);
}
使用series調節繪制的地圖
地圖中也label,tooltip,lenged等屬性,也可以用itemStyle調整每塊區域的樣式。
地圖特有的屬性:
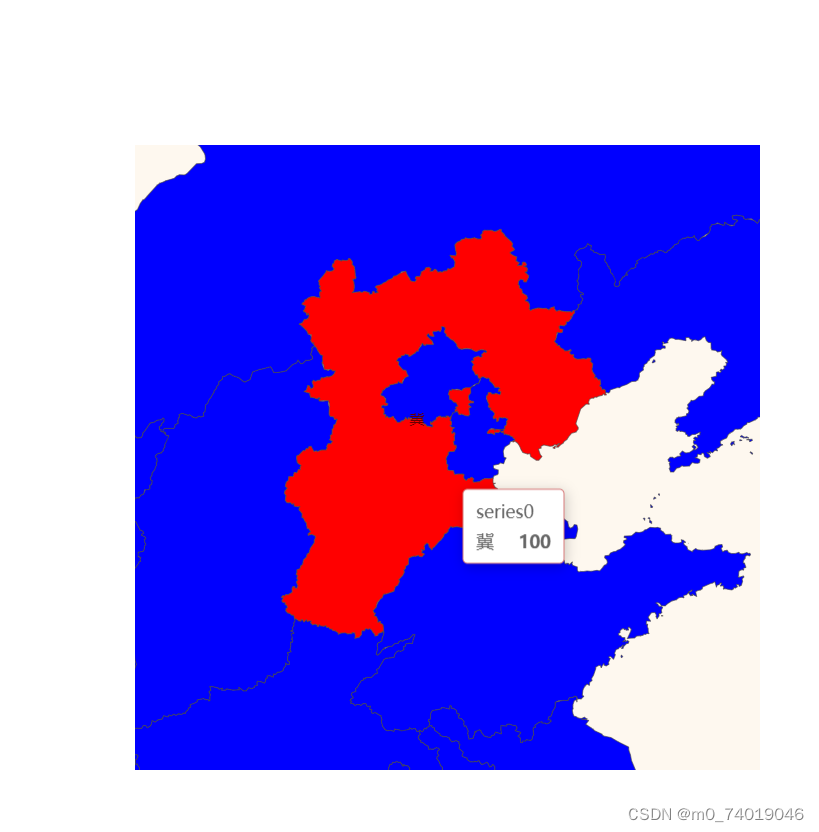
數據映射: nameMap
縮放相關的:scaleLimit,zoom
如果想給某個省份添加數據,可以設置data
let options = {tooltip: {},series: [{type: "map",roam: true,width: 500,height: 500,map: "china",label: {// show: true,},itemStyle: { // 地圖的顏色areaColor: "blue",},emphasis: { //高亮色itemStyle: {areaColor: "red",},},data: [{ name: "天津市", value: 20 }],//name要完全對應},],};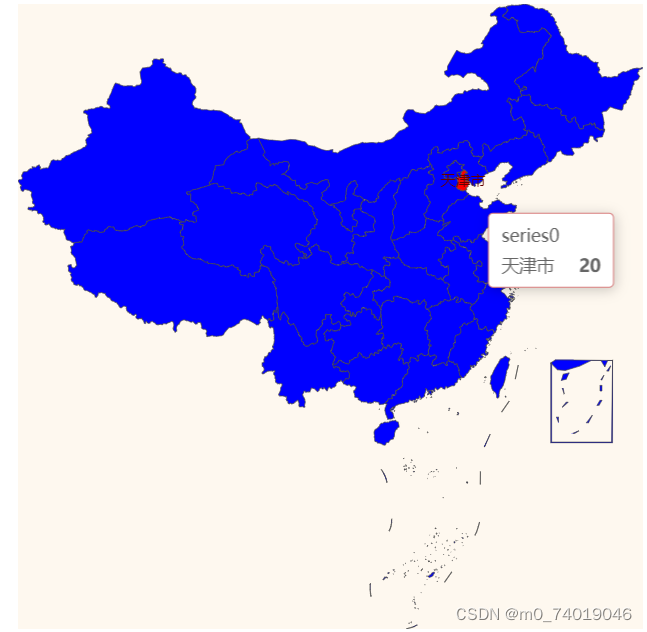
scaleLimit :滾輪縮放的極限控制,通過min, max最小和最大的縮放值。
zoom:當前視角的縮放比例。
nameMap:自定義地區的名稱映射。
 let options = {tooltip: {},series: [{type: "map",roam: true,width: 500,height: 500,map: "china",label: {// show: true,},itemStyle: {// 地圖的顏色areaColor: "blue",},emphasis: {//高亮色itemStyle: {areaColor: "red",},},nameMap: {河北省: "冀",},scaleLimit: {min: 1,max: 5,},zoom: 5,data: [{ name: "天津市", value: 20 },{name: "冀",value: 100,},],},],
};
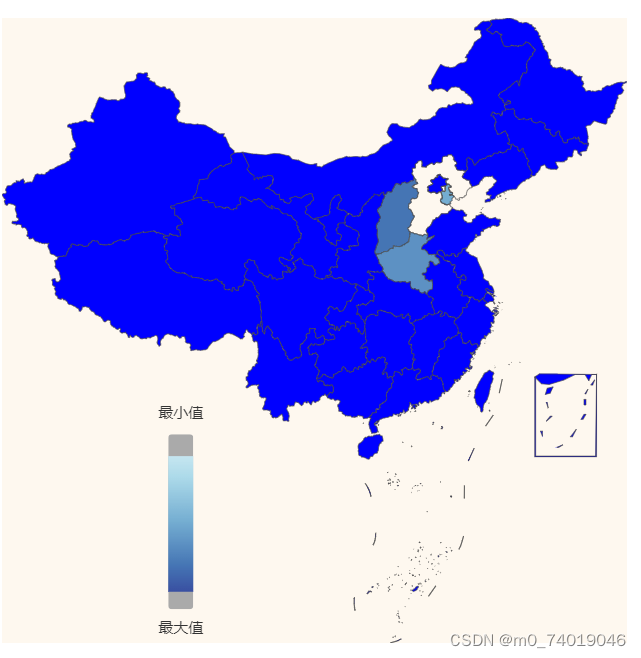
visualMap 根據數值顯示不同的顏色,一般配合熱力圖或地圖
inRange 調控顏色的變化范圍
min,max 調控最大、最小值
left 調節組件的位置
text調節組件最高最低的文本
let options = {tooltip: {},series: [{type: "map",roam: true,width: 500,height: 500,map: "china",label: {// show: true,},itemStyle: {// 地圖的顏色areaColor: "blue",},emphasis: {//高亮色itemStyle: {areaColor: "red",},},nameMap: {河北省: "冀",},scaleLimit: {min: 1,max: 5,},// zoom: 5,data: [{ name: "天津市", value: 20 },{ name: "山西省", value: 10 },{ name: "河南省", value: 15 },{name: "冀",value: 40,},],},],visualMap: {type: "continuous", //"piecewise" 調控顏色的條是連續的還是不連續的min: 0, // max: 40,range: [4, 35], //范圍是從4-35 ,整個范圍是0-40text: ["最小值", "最大值"], // 調控顏色的條上下的文字left: 120,inRange: {color: ["#313695", "#4575b4", "#74add1", "#abd9e9", "#e0f3f8"],},},};
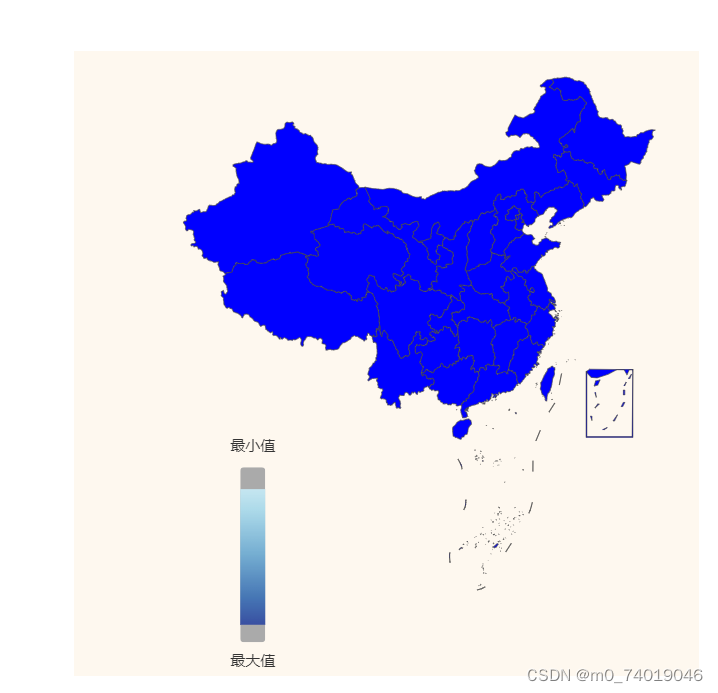
geo 地理坐標系繪制地圖
如果以地圖為基礎,在地圖的某個位置上繪制一些東西,可以使用geo地理坐標系來繪圖
1.圖表的調節與map圖標一致
2. 如果相對地圖中的某一個區域進行特殊的配置,要使用regions
let options = {tooltip: {},geo: {map: "china",roam: true,zoom: 2,itemStyle: {areaColor: "blue",},},visualMap: {type: "continuous", //"piecewise"min: 0,max: 40,range: [4, 35],text: ["最小值", "最大值"],left: 120,inRange: {color: ["#313695", "#4575b4", "#74add1", "#abd9e9", "#e0f3f8"],},},};
在圖中添加數據,以graph關系圖為例
let options = {tooltip: {},geo: {map: "china",roam: true,zoom: 1,itemStyle: {areaColor: "blue",},},series: [{type: "graph",coordinateSystem: "geo",data: [[112.549248, 37.857014],[111.670801, 40.818311],[115.426264, 39.950502],[116.677853, 40.970888],],},],};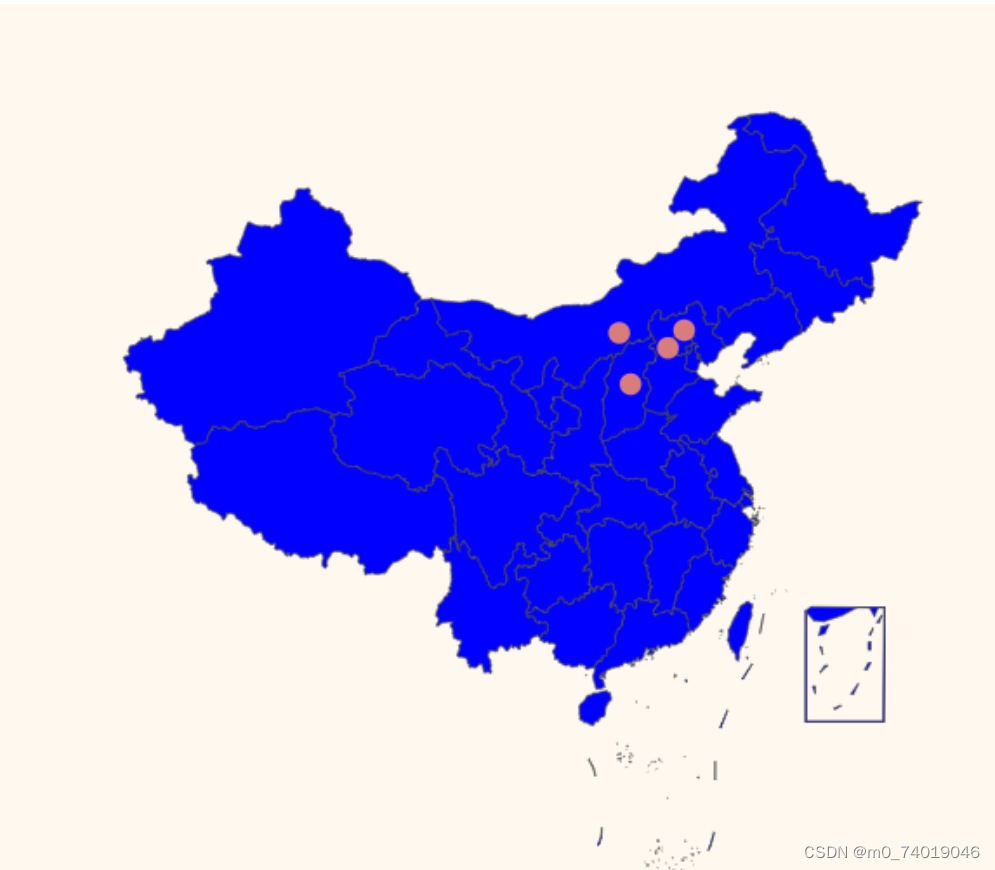
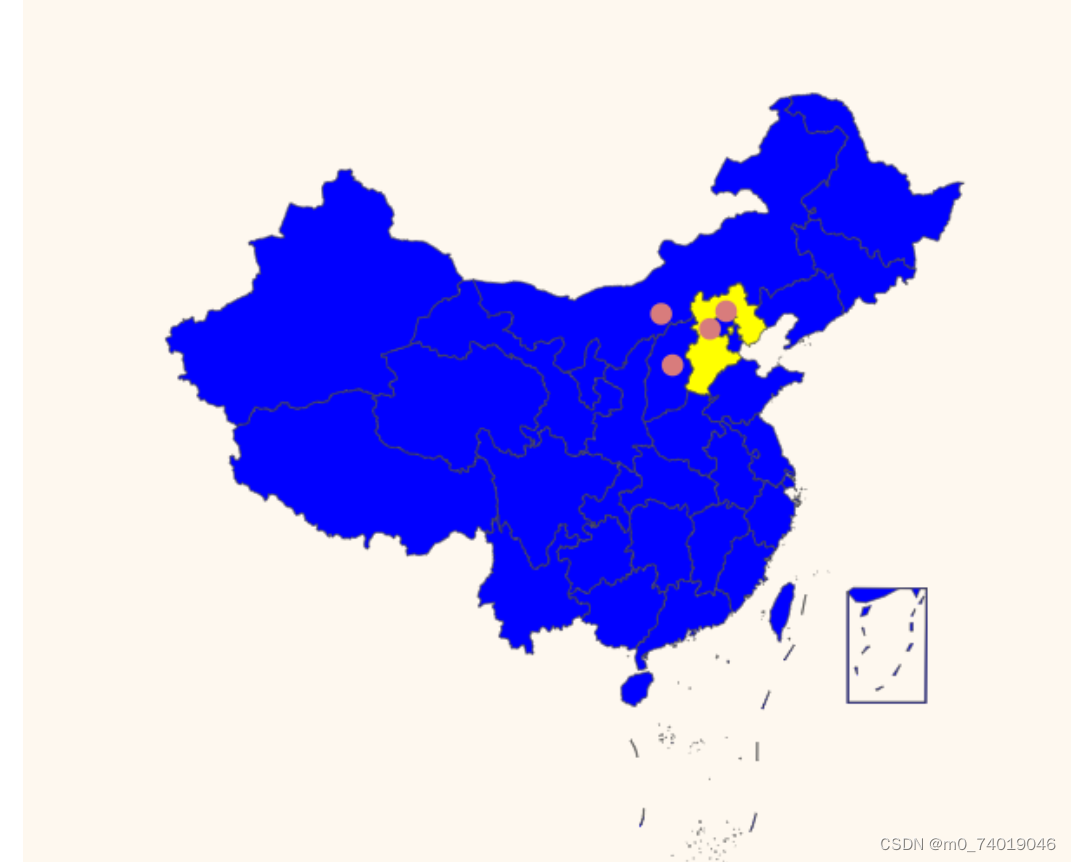
let options = {tooltip: {},geo: {map: "china",roam: true,zoom: 1,itemStyle: {areaColor: "blue",},regions: [{name: "河北省",itemStyle: {areaColor: "yellow",},},],},series: [{type: "graph",coordinateSystem: "geo",data: [[112.549248, 37.857014],[111.670801, 40.818311],[115.426264, 39.950502],[116.677853, 40.970888],],},],};
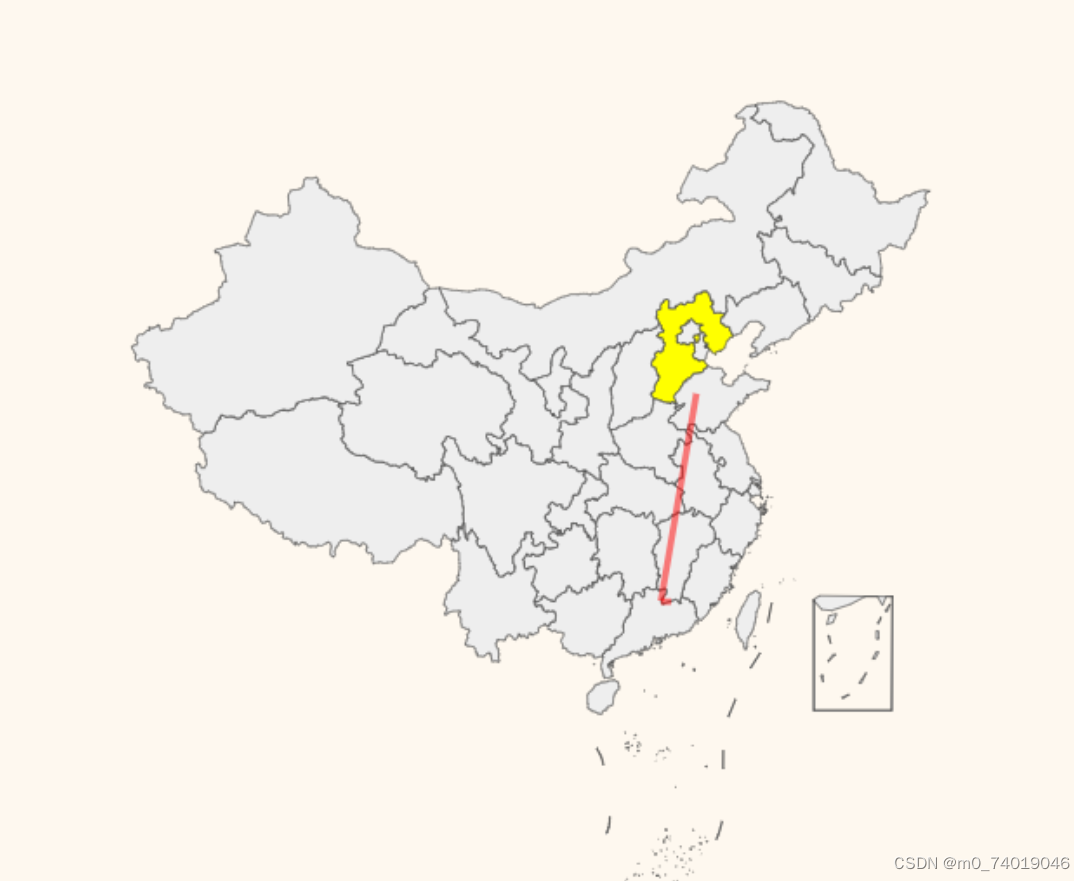
geo地理坐標系搭配lines繪制路線
lines經常配合geo使用,用于繪制路線圖。與line折線圖不同的是,lines主要用來繪制多個線條,數據寫法也不同。
lines:路徑圖
coords:一個包含兩個到多個二維坐標的數組
let options = {tooltip: {},geo: {map: "china",roam: true,zoom: 1,itemStyle: {// areaColor: "blue",},regions: [{name: "河北省",itemStyle: {areaColor: "yellow",},},],},series: [{type: "lines",lineStyle: {color: "red",width: 3,},data: [{coords: [[117.000923, 36.675807],[114.27261, 24.700624],],},{coords: [[115.057317, 24.703343],[114.27261, 24.700624],],},],},],};
使用高德或百度地圖

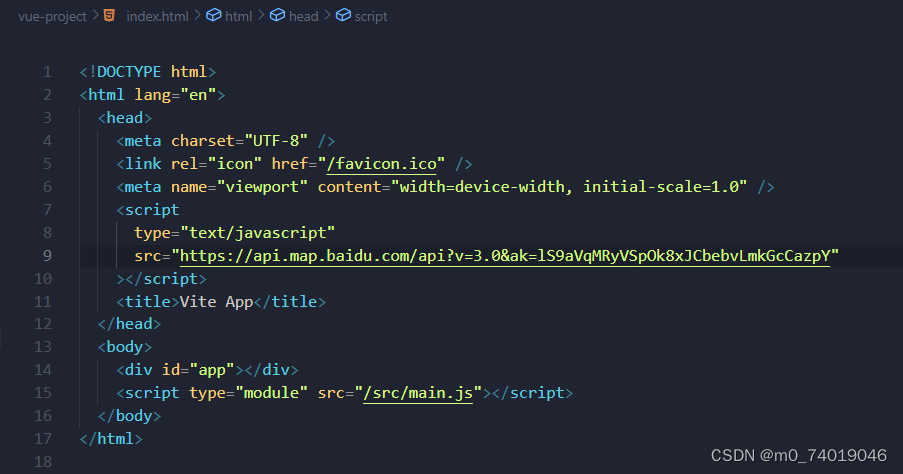
在html中引入百度地圖(要在vue加載前使用,所以放在head中,提前加載)
必須是3.0,1.0會報錯
在echarts中使用
<script setup>
import * as echarts from "echarts";
import { onMounted, watch } from "vue";
import "./vintage";import "echarts/extension/bmap/bmap";let myEcharts;
onMounted(() => {let canvas = document.getElementById("canvas");myEcharts = echarts.init(canvas, null, {width: 1200,height: 1200,devicePixelRatio: window.devicePixelRatio,locale: "ZH",});let options = {tooltip: {},bmap: {center: [116.405285, 39.904989],roam: true,zoom: 18,},series: [],};rednderEcharts(options);
});function rednderEcharts(options) {myEcharts.setOption(options);
}
</script><template><div id="canvas" width="400" height="400"></div>
</template><style scoped>
#canvas {  //一定要在給 元素設置寬高,否則會報錯width: 1200px;height: 1200px;
}
</style>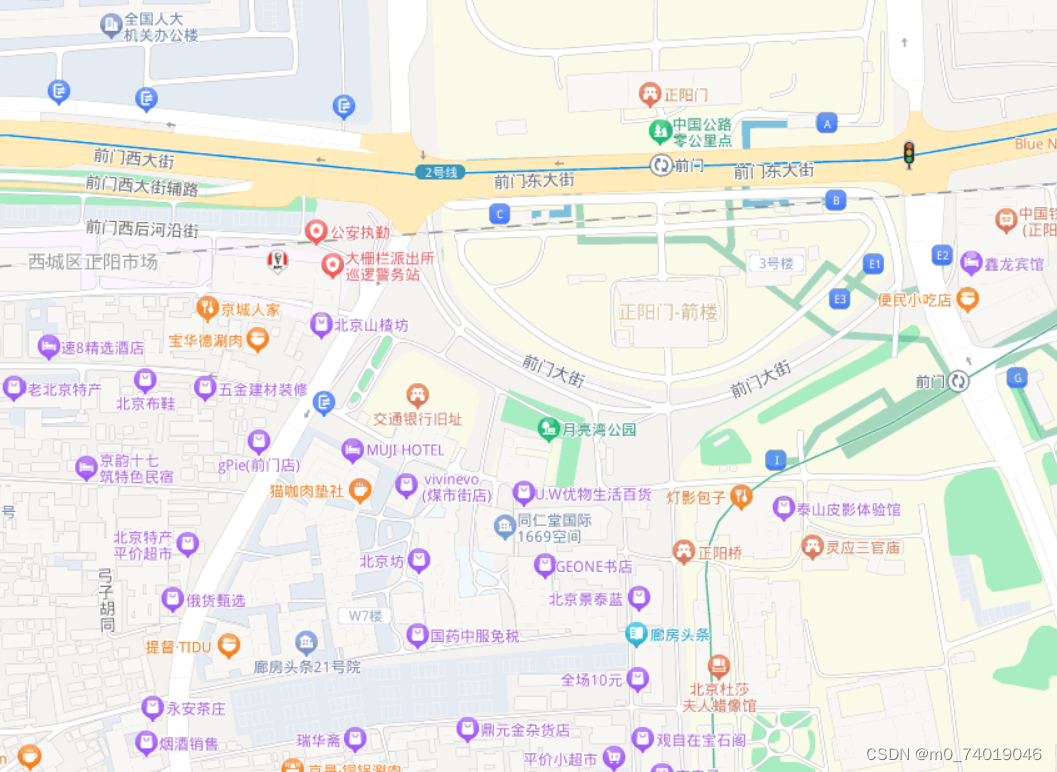
添加數據
let options = {tooltip: {},bmap: {center: [116.405285, 39.904989],roam: true,zoom: 18,},series: [{type: "lines", //這里的線條有動畫效果coordinateSystem: "bmap",lineStyle: {color: "yellow",width: 1,},effect: {show: true,symbol: "",},data: [{coords: [[117.000923, 36.675807],[114.27261, 24.700624],],},{coords: [[115.057317, 24.703343],[114.27261, 24.700624],],},],},],};
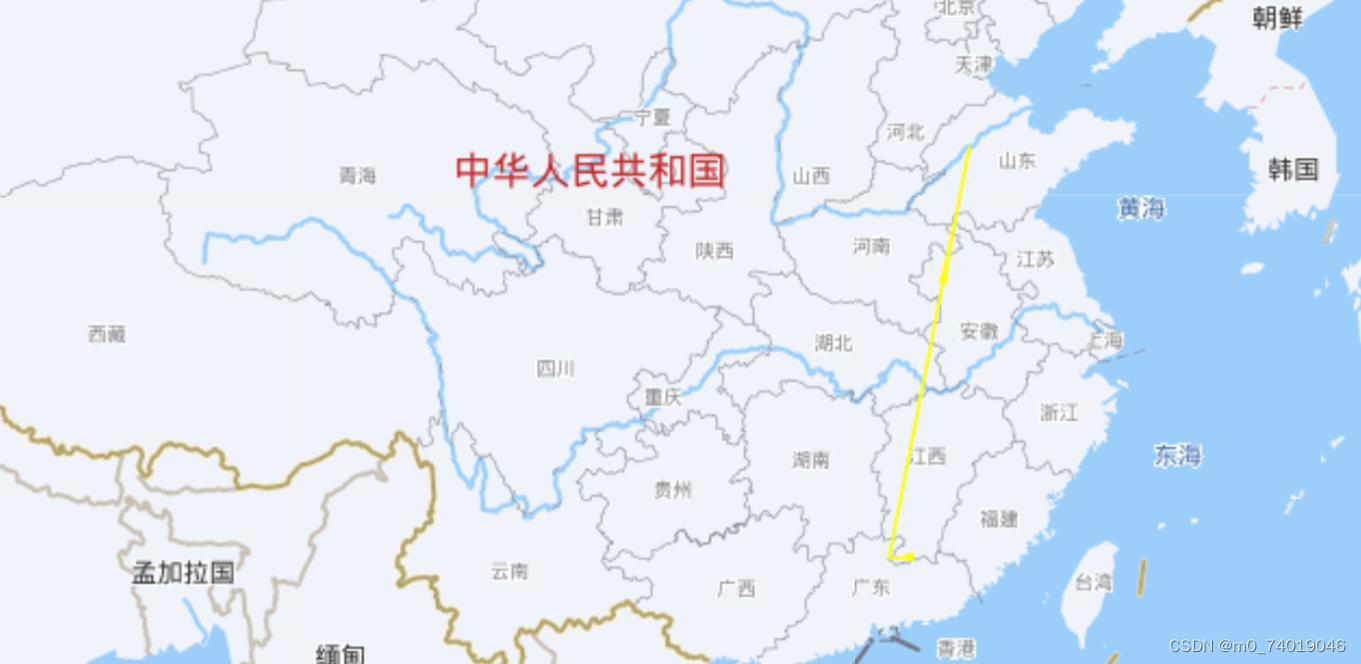
自定義地圖的顏色
可以修改陸地,海洋的顏色
let options = {tooltip: {},bmap: {center: [116.405285, 39.904989],roam: true,zoom: 18,mapStyle: {styleJson: [{featureType: "land",elementType: "all",stylers: {color: "#f3f3f3",},},],},},series: [{type: "lines",coordinateSystem: "bmap",lineStyle: {color: "yellow",width: 1,},effect: {show: true,symbol: "",},data: [{coords: [[117.000923, 36.675807],[114.27261, 24.700624],],},{coords: [[115.057317, 24.703343],[114.27261, 24.700624],],},],},],};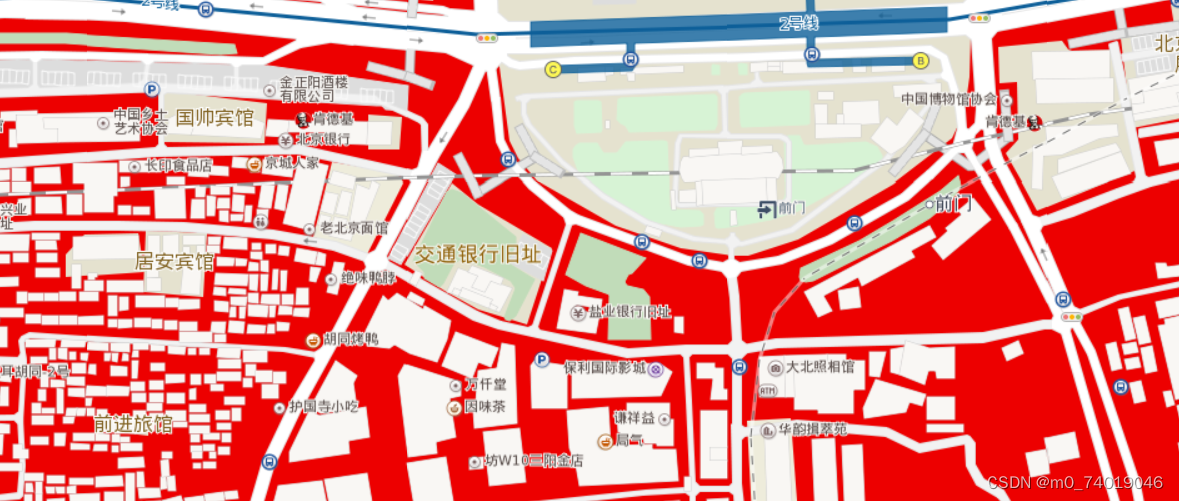


)

選擇IDE和配置環境)


)


Linux基本命令)
