2、接口編寫
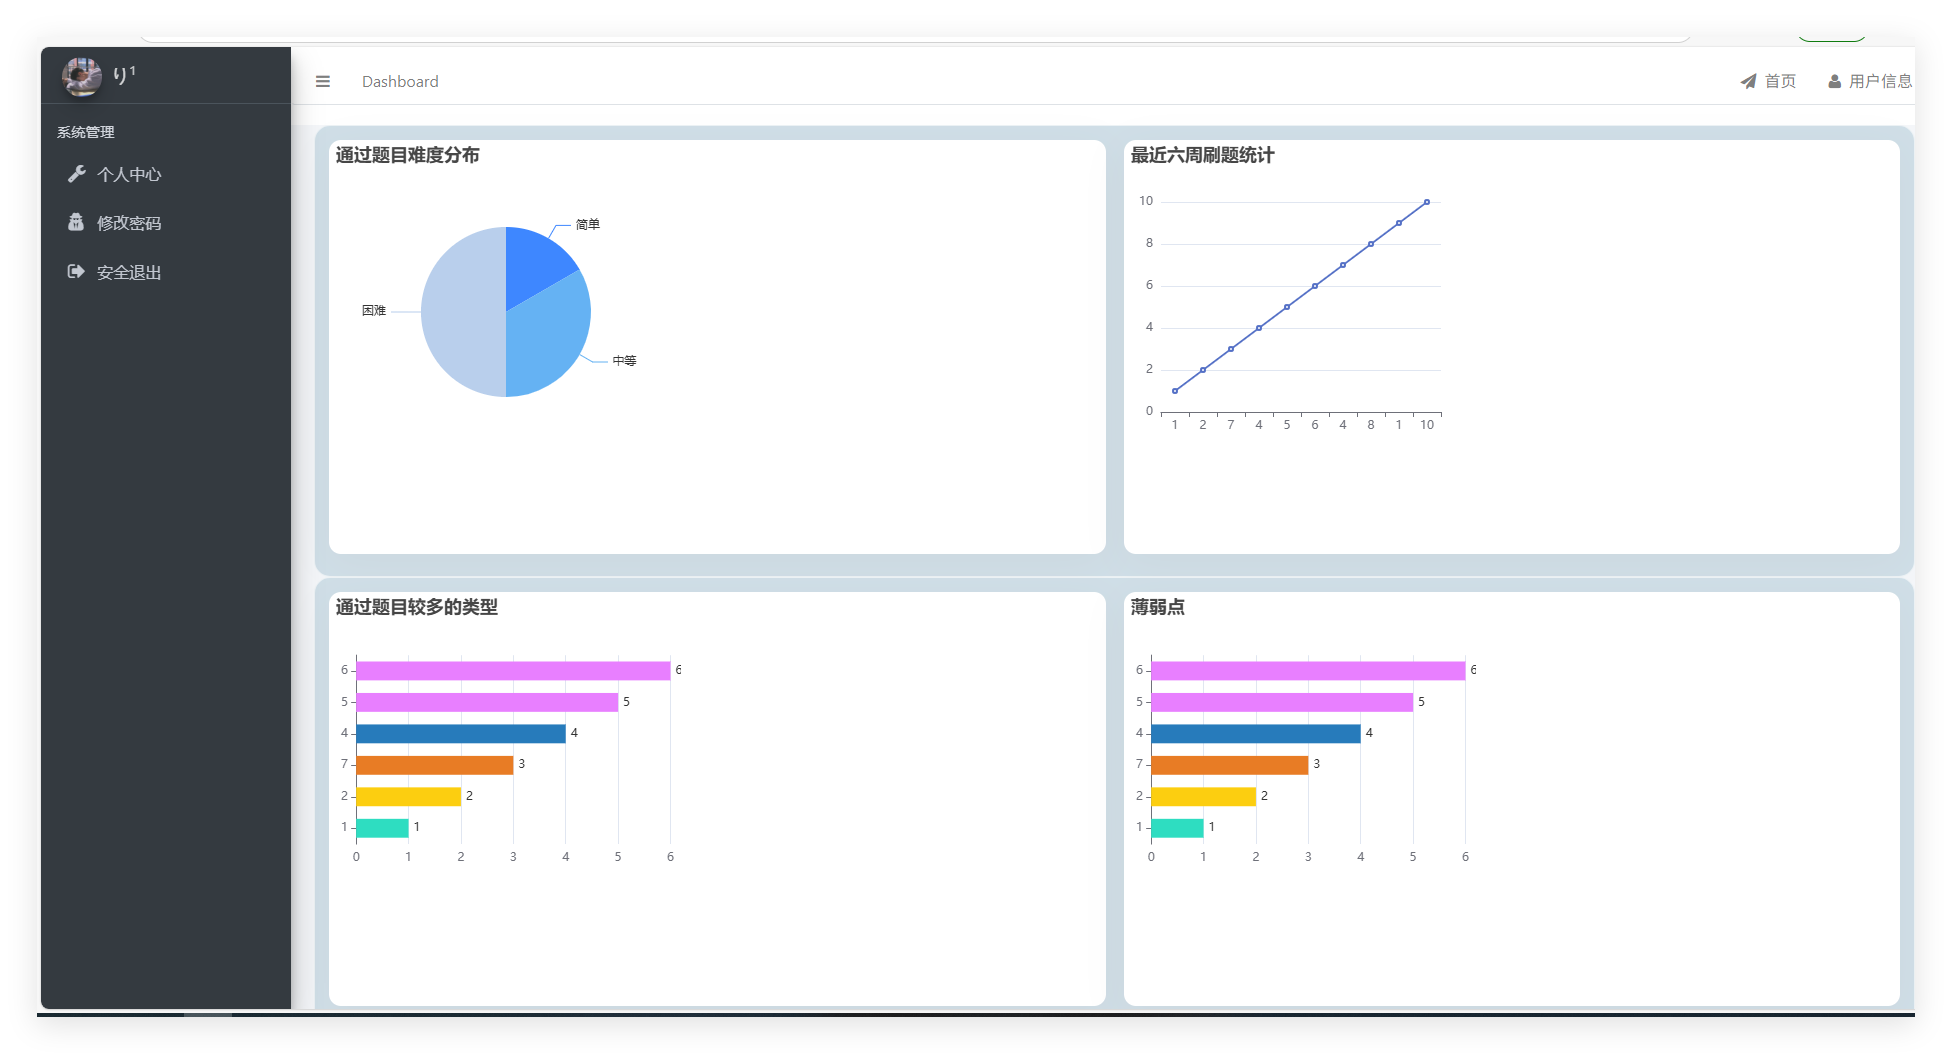
該部分代碼定義了UserController控制器類,用于處理與用戶相關的請求。包含一個用于跳轉頁面的方法和一個返回用戶詳細數據(以 JSON 格式呈現)的接口。前者負責將用戶導航至指定頁面,后者通過構建ChartVO對象并填充數據,為前端展示圖表提供所需的數據支撐。
@Controller
@RequestMapping("/admin")
public class UserController {@RequestMapping("/index")public String toUserDetail() {return "admin/index";}// 返回 JSON 數據@GetMapping("/user/detail/getChartData")@ResponseBodypublic ChartVO getUserDetail() {ChartVO chartVO = new ChartVO();chartVO.setEasy(1);chartVO.setMedium(2);chartVO.setHard(3);chartVO.setXAxis(new String[]{"1", "2", "7", "4", "5", "6", "4", "8", "1", "10"});chartVO.setNums(new Integer[]{1, 2, 3, 4, 5, 6, 7, 8, 9, 10});chartVO.setYAxis4(new String[]{"1", "2", "7", "4", "5", "6"});chartVO.setType4(new Integer[]{1, 2, 3, 4, 5, 6});chartVO.setYAxis3(new String[]{"1", "2", "7", "4", "5", "6"});chartVO.setType3(new Integer[]{1, 2, 3, 4, 5, 6});return chartVO;}
}
3、引入echart組件
ECharts 是一款基于 JavaScript 的數據可視化圖表庫,通過模塊化的加載方式適配不同的環境(如 CommonJS、AMD 或全局變量)。該代碼片段通過自執行函數判斷當前環境,將 ECharts 掛載到全局對象中,為后續在前端頁面中使用 ECharts 渲染圖表提供基礎。
/*
* Licensed to the Apache Software Foundation (ASF) under one
* or more contributor license agreements.  See the NOTICE file
* distributed with this work for additional information
* regarding copyright ownership.  The ASF licenses this file
* to you under the Apache License, Version 2.0 (the
* "License"); you may not use this file except in compliance
* with the License.  You may obtain a copy of the License at
*
*   http://www.apache.org/licenses/LICENSE-2.0
*
* Unless required by applicable law or agreed to in writing,
* software distributed under the License is distributed on an
* "AS IS" BASIS, WITHOUT WARRANTIES OR CONDITIONS OF ANY
* KIND, either express or implied.  See the License for the
* specific language governing permissions and limitations
* under the License.
*/(function (global, factory) {typeof exports === 'object' && typeof module !== 'undefined' ? factory(exports) :typeof define === 'function' && define.amd ? define(['exports'], factory) :(global = typeof globalThis !== 'undefined' ? globalThis : global || self, factory(global.echarts = {}));
}
4、前端頁面代碼
通過 Thymeleaf 模板引擎動態引入頁面的頭部導航、側邊欄和頁腳等公共模塊,并定義了多個用于渲染 ECharts 圖表的容器(如#pie、#line、#echart3、#echart4)。這些容器將與后續 JavaScript 代碼配合,展示從后端獲取的數據可視化圖表。
<div class="wrapper"><!-- 引入頁面頭header-fragment --><div th:replace="admin/common/commons::header-nav"></div><!-- 引入工具欄sidebar-fragment --><div th:replace="admin/common/commons::sidebar-fragment(${path})"></div><!-- Content Wrapper. Contains page content --><div class="content-wrapper"><!-- Main content --><div class="content"><div class="container-fluid"><div class="analyze"><div class="fd-content-wrap fd-flex-wrap"><div class="fd-left-wrap fd-sr-wrap"><div class="fd-inner-wrap"><div class="echart" id="pie"></div></div></div><div class="fd-right-wrap"><div class="fd-inner-wrap fd-zc-wrap"><div class="echart" id="line"></div></div></div></div><div class="fd-content-wrap fd-flex-wrap"><div class="fd-left-wrap"><div class="fd-inner-wrap"><div class="echart" id="echart3"></div></div></div><div class="fd-right-wrap"><div class="fd-inner-wrap fd-szqsfx-chart-wrap"><div class="echart" id="echart4"></div></div></div></div></div></div></div><!-- /.content --></div><!-- /.content-wrapper --><!-- 引入頁腳footer-fragment --><div th:replace="admin/common/commons::footer-fragment"></div>
</div>
5、前端js代碼
通過echarts.init()方法創建圖表實例,結合從后端獲取的數據,定義圖表的標題、顏色、提示框、坐標軸、數據系列等參數,最終使用setOption()方法將配置應用到圖表中,實現 “薄弱點” 和 “通過題目較多的類型” 等數據的可視化展示。
<script th:inline="javascript">var myEchart4 = echarts.init(document.getElementById('echart4'));myEchart4.title = '坐標軸刻度與標簽對齊';option4 = {// 標題title: {text: '薄弱點'},color: ['#3398DB'],tooltip: {trigger: 'axis',axisPointer: { // 坐標軸指示器,坐標軸觸發有效type: 'shadow' // 默認為直線,可選為:'line' | 'shadow'}},grid: {left: '3%',right: '3%',top: '18%', // 調整頂部間距containLabel: true},// 交換X軸和Y軸的定義yAxis: [{type: 'category', // Y軸現在顯示類別data: ['Mon', 'Tue', 'Wed', 'Thu', 'Fri', 'Sat', 'Sun'],axisTick: {alignWithLabel: true}}],xAxis: [{type: 'value' // X軸現在顯示數值}],series: [{name: '直接訪問',type: 'bar',barWidth: '60%',data: [10, 52, 200, 334, 390, 330, 220],itemStyle: {normal: {color: function(params) {var colorList = ['#2eddc1','#FCCE10','#E87C25','#277bbb','#E87fff','#E87fff', 'E87fff'];// 若返回的list長度不足,不足部分自動顯示為最后一個顏色return colorList[params.dataIndex]},label: {show: true,position: 'right' // 標簽顯示在條形的右側}}}}]};myEchart4.setOption(option4);var myChart = echarts.init(document.getElementById('echart3'));myChart.title = '坐標軸刻度與標簽對齊';option = {// 標題title: {text: '通過題目較多的類型'},color: ['#3398DB'],tooltip: {trigger: 'axis',axisPointer: { // 坐標軸指示器,坐標軸觸發有效type: 'shadow' // 默認為直線,可選為:'line' | 'shadow'}},grid: {left: '3%',right: '3%',top: '18%', // 調整頂部間距containLabel: true},// 交換X軸和Y軸的定義yAxis: [{type: 'category', // Y軸現在顯示類別data: ['Mon', 'Tue', 'Wed', 'Thu', 'Fri', 'Sat', 'Sun'],axisTick: {alignWithLabel: true}}],xAxis: [{type: 'value' // X軸現在顯示數值}],series: [{name: '直接訪問',type: 'bar',barWidth: '60%',data: [10, 52, 200, 334, 390, 330, 220],itemStyle: {normal: {color: function(params) {var colorList = ['#2eddc1','#FCCE10','#E87C25','#277bbb','#E87fff','#E87fff', 'E87fff'];// 若返回的list長度不足,不足部分自動顯示為最后一個顏色return colorList[params.dataIndex]},label: {show: true,position: 'right' // 標簽顯示在條形的右側}}}}]};myChart.setOption(option);</script>6、效果圖


![[Survey]SAM2 for Image and Video Segmentation: A Comprehensive Survey](http://pic.xiahunao.cn/[Survey]SAM2 for Image and Video Segmentation: A Comprehensive Survey)


)

:dos2unix)
細節補充)


:閱讀與注釋單選框這個類型的按鈕 QRadioButton,及各種屬性驗證,)


