1. 引言:AI技術概述及其在各行業的重要性
人工智能(AI)技術近年來取得了突破性進展,從理論研究走向了廣泛的商業應用。AI的核心技術包括機器學習、深度學習、自然語言處理、計算機視覺等,這些技術正在深刻改變各行各業的運營模式和服務方式。
在金融領域,AI提高了風險控制能力,優化了投資決策,并改善了客戶服務體驗;在醫療領域,AI輔助診斷、藥物研發和個性化治療方案正在改變傳統的醫療模式;在教育領域,AI實現了個性化學習和智能教學評估;在制造業領域,AI推動了智能制造、預測性維護和質量控制的發展。
隨著計算能力的提升、大數據的積累和算法的優化,AI技術正在從實驗室走向實際應用場景,為各行業帶來效率提升、成本降低和創新服務。本文將詳細探討AI在金融、醫療、教育和制造業四大領域的具體落地案例,并通過代碼、流程圖、Prompt示例和圖表等方式展示這些應用的實際效果。
2. AI在金融領域的應用案例
2.1 智能風控系統
金融行業的核心是風險管理,而AI技術正在革新傳統的風控模式。智能風控系統通過機器學習算法分析大量歷史數據,識別潛在風險,預測違約概率,從而幫助金融機構做出更準確的信貸決策。
案例描述:某銀行的智能信貸風控系統
該銀行利用AI技術構建了全面的信貸風控系統,整合了客戶的交易記錄、信用歷史、社交網絡等多維度數據,通過深度學習模型評估客戶的信用風險。系統上線后,貸款審批時間從原來的3天縮短至10分鐘,壞賬率降低了25%。
代碼示例:基于XGBoost的信用評分模型
import pandas as pd
import numpy as np
from sklearn.model_selection import train_test_split
from sklearn.metrics import accuracy_score, roc_auc_score
import xgboost as xgb
import matplotlib.pyplot as plt# 加載數據
data = pd.read_csv('loan_data.csv')# 數據預處理
def preprocess_data(df):# 處理缺失值df = df.fillna(df.mean())# 特征工程df['debt_to_income'] = df['debt'] / df['income']df['payment_to_income'] = df['payment'] / df['income']# 類別變量編碼categorical_cols = ['employment', 'home_ownership', 'loan_purpose']df = pd.get_dummies(df, columns=categorical_cols, drop_first=True)return dfdata = preprocess_data(data)# 劃分特征和目標變量
X = data.drop('loan_status', axis=1)
y = data['loan_status']# 劃分訓練集和測試集
X_train, X_test, y_train, y_test = train_test_split(X, y, test_size=0.2, random_state=42)# 訓練XGBoost模型
model = xgb.XGBClassifier(n_estimators=100,max_depth=5,learning_rate=0.1,subsample=0.8,colsample_bytree=0.8,random_state=42
)model.fit(X_train, y_train)# 預測和評估
y_pred = model.predict(X_test)
y_pred_proba = model.predict_proba(X_test)[:, 1]print(f"Accuracy: {accuracy_score(y_test, y_pred):.4f}")
print(f"AUC: {roc_auc_score(y_test, y_pred_proba):.4f}")# 特征重要性可視化
plt.figure(figsize=(10, 6))
xgb.plot_importance(model, max_num_features=10)
plt.title('Feature Importance')
plt.show()
Mermaid流程圖:智能風控系統流程
flowchart TDA[客戶申請貸款] --> B[數據收集]B --> C[數據預處理]C --> D[特征工程]D --> E[AI模型評分]E --> F{風險等級判斷}F -->|低風險| G[自動批準]F -->|中風險| H[人工審核]F -->|高風險| I[拒絕申請]H --> J[最終決策]G --> K[放款]J --> KI --> L[通知客戶]K --> M[貸后監控]M --> N[行為數據更新]N --> E
Prompt示例:用于生成風控報告的AI提示
你是一名金融風控專家,請根據以下客戶數據生成一份風控評估報告:客戶信息:
- 姓名:張三
- 年齡:35歲
- 職業:IT工程師
- 月收入:15,000元
- 工作年限:8年
- 信用歷史:無逾期記錄
- 負債情況:房貸月供5,000元,信用卡總額度50,000元,已使用30,000元
- 申請貸款金額:200,000元
- 貸款期限:36個月請從以下幾個方面進行評估:
1. 客戶的基本信用狀況
2. 還款能力分析
3. 潛在風險點
4. 建議的貸款條件和利率
5. 其他需要關注的事項請以專業、客觀的語言撰寫報告,并給出明確的建議。
圖表:風控模型性能評估
| 模型類型 | 準確率 | 召回率 | F1分數 | AUC |
|---|---|---|---|---|
| 傳統邏輯回歸 | 0.82 | 0.75 | 0.78 | 0.81 |
| 隨機森林 | 0.85 | 0.79 | 0.82 | 0.87 |
| XGBoost | 0.88 | 0.83 | 0.85 | 0.91 |
| 神經網絡 | 0.86 | 0.81 | 0.83 | 0.89 |
2.2 智能投顧系統
智能投顧是AI在金融領域的另一重要應用,它利用算法和機器學習技術為投資者提供個性化的投資建議和資產配置方案。
案例描述:某金融科技公司的智能投顧平臺
該平臺通過分析客戶的風險偏好、投資目標、財務狀況等信息,結合市場數據和宏觀經濟指標,利用AI算法生成個性化的投資組合建議。平臺上線后,客戶投資組合的平均年化收益率提升了3.2%,客戶滿意度達到92%。
代碼示例:基于現代投資組合理論的資產配置優化
import numpy as np
import pandas as pd
import matplotlib.pyplot as plt
import cvxpy as cp
from datetime import datetime, timedelta# 獲取資產價格數據
def get_asset_data():# 這里使用模擬數據,實際應用中可以從API獲取真實數據np.random.seed(42)dates = pd.date_range(start='2020-01-01', end='2023-01-01')assets = ['股票', '債券', '商品', '房地產', '現金']# 生成模擬收益率returns = pd.DataFrame(np.random.normal(0.001, 0.02, (len(dates), len(assets))), index=dates, columns=assets)# 調整不同資產的風險收益特征returns['股票'] *= 2.5  # 股票風險收益更高returns['債券'] *= 0.7  # 債券風險收益更低returns['現金'] *= 0.1  # 現金幾乎無風險return returnsreturns = get_asset_data()# 計算年化收益率和協方差矩陣
mean_returns = returns.mean() * 252  # 年化收益率
cov_matrix = returns.cov() * 252     # 年化協方差矩陣# 定義資產數量
num_assets = len(mean_returns)# 設置優化變量
weights = cp.Variable(num_assets)# 設置目標函數 - 最大化夏普比率
risk_free_rate = 0.02
portfolio_return = mean_returns.values @ weights
portfolio_risk = cp.quad_form(weights, cov_matrix.values)
sharpe_ratio = (portfolio_return - risk_free_rate) / cp.sqrt(portfolio_risk)# 設置約束條件
constraints = [cp.sum(weights) == 1,  # 權重和為1weights >= 0,          # 不允許做空
]# 定義并求解優化問題
objective = cp.Maximize(sharpe_ratio)
problem = cp.Problem(objective, constraints)
problem.solve()# 獲取最優權重
optimal_weights = weights.value# 打印結果
print("最優資產配置:")
for asset, weight in zip(mean_returns.index, optimal_weights):print(f"{asset}: {weight:.2%}")# 可視化資產配置
plt.figure(figsize=(10, 6))
plt.pie(optimal_weights, labels=mean_returns.index, autopct='%1.1f%%')
plt.title('最優資產配置')
plt.show()# 計算并可視化有效前沿
frontier_returns = []
frontier_risks = []for target_return in np.linspace(min(mean_returns), max(mean_returns), 50):# 設置約束條件constraints = [cp.sum(weights) == 1,weights >= 0,mean_returns.values @ weights == target_return]# 定義并求解優化問題(最小化風險)objective = cp.Minimize(cp.sqrt(portfolio_risk))problem = cp.Problem(objective, constraints)problem.solve()if problem.status == 'optimal':frontier_returns.append(target_return)frontier_risks.append(cp.sqrt(portfolio_risk).value)# 繪制有效前沿
plt.figure(figsize=(10, 6))
plt.plot(frontier_risks, frontier_returns, 'b-', label='有效前沿')
plt.scatter(np.sqrt(np.diag(cov_matrix)), mean_returns, c='red', label='單個資產')
plt.scatter(np.sqrt(optimal_weights.T @ cov_matrix.values @ optimal_weights), mean_returns.values @ optimal_weights, c='green', s=100, label='最優組合')
plt.xlabel('風險(標準差)')
plt.ylabel('預期收益率')
plt.title('投資組合有效前沿')
plt.legend()
plt.grid(True)
plt.show()
Mermaid流程圖:智能投顧系統工作流程
flowchart TDA[客戶風險評估] --> B[投資目標設定]B --> C[市場數據分析]C --> D[資產配置模型]D --> E[投資組合生成]E --> F[客戶確認]F -->|確認| G[執行投資]F -->|調整| H[修改參數]H --> DG --> I[持續監控]I --> J{市場變化檢測}J -->|顯著變化| K[再平衡建議]J -->|正常| IK --> L[客戶確認]L -->|確認| M[執行再平衡]M --> I
Prompt示例:生成投資建議的AI提示
你是一名專業的投資顧問,請根據以下客戶信息提供個性化的投資建議:客戶信息:
- 姓名:李四
- 年齡:45歲
- 職業:企業高管
- 家庭狀況:已婚,有兩個孩子(一個上大學,一個上高中)
- 月收入:50,000元
- 月支出:30,000元
- 現有資產:銀行存款500,000元,股票投資300,000元,房產一套(市值3,000,000元,貸款余額1,500,000元)
- 投資經驗:5年,中等風險承受能力
- 投資目標:10年后積累2,000,000元用于子女教育和退休規劃
- 投資期限:中長期(10年以上)請提供以下內容:
1. 客戶財務狀況分析
2. 風險評估結果
3. 資產配置建議(包括各大類資產的建議比例)
4. 具體投資產品推薦(至少3-5種)
5. 投資策略和預期收益
6. 風險提示和注意事項請以專業、易懂的語言撰寫建議,并考慮客戶的實際情況和需求。
圖表:不同風險偏好下的資產配置比例
| 風險偏好 | 股票 | 債券 | 商品 | 房地產 | 現金 |
|---|---|---|---|---|---|
| 保守型 | 20% | 50% | 5% | 15% | 10% |
| 穩健型 | 40% | 35% | 5% | 15% | 5% |
| 平衡型 | 55% | 25% | 5% | 10% | 5% |
| 進取型 | 70% | 15% | 5% | 5% | 5% |
| 激進型 | 85% | 5% | 5% | 5% | 0% |
3. AI在醫療領域的應用案例
3.1 醫學影像智能診斷
AI在醫學影像診斷領域的應用已經取得了顯著成果,特別是在放射學、病理學和皮膚科等領域。深度學習算法可以分析醫學影像,幫助醫生更準確地檢測疾病。
案例描述:某三甲醫院的AI輔助肺部CT診斷系統
該醫院引入了基于深度學習的AI輔助診斷系統,用于分析肺部CT影像,檢測肺結節、肺炎、肺結核等疾病。系統經過數萬例標注數據的訓練,能夠自動識別和標記可疑病灶,并提供良惡性預測。系統上線后,早期肺癌檢出率提高了23%,診斷時間縮短了60%,醫生診斷準確率提升了15%。
代碼示例:基于卷積神經網絡的肺結節檢測
import numpy as np
import pandas as pd
import matplotlib.pyplot as plt
import tensorflow as tf
from tensorflow.keras import layers, models
from sklearn.model_selection import train_test_split
from sklearn.metrics import accuracy_score, confusion_matrix, classification_report
import cv2
import os# 數據預處理
def load_data(data_dir):images = []labels = []# 加載正樣本(含結節)positive_dir = os.path.join(data_dir, 'positive')for filename in os.listdir(positive_dir):img_path = os.path.join(positive_dir, filename)img = cv2.imread(img_path, cv2.IMREAD_GRAYSCALE)img = cv2.resize(img, (64, 64))  # 調整圖像大小img = img / 255.0  # 歸一化images.append(img)labels.append(1)  # 1表示有結節# 加載負樣本(無結節)negative_dir = os.path.join(data_dir, 'negative')for filename in os.listdir(negative_dir):img_path = os.path.join(negative_dir, filename)img = cv2.imread(img_path, cv2.IMREAD_GRAYSCALE)img = cv2.resize(img, (64, 64))img = img / 255.0images.append(img)labels.append(0)  # 0表示無結節return np.array(images), np.array(labels)# 加載數據
X, y = load_data('lung_ct_data')# 調整數據形狀以適應CNN輸入
X = X.reshape(X.shape[0], X.shape[1], X.shape[2], 1)# 劃分訓練集和測試集
X_train, X_test, y_train, y_test = train_test_split(X, y, test_size=0.2, random_state=42)# 構建CNN模型
def build_model():model = models.Sequential([layers.Conv2D(32, (3, 3), activation='relu', input_shape=(64, 64, 1)),layers.MaxPooling2D((2, 2)),layers.Conv2D(64, (3, 3), activation='relu'),layers.MaxPooling2D((2, 2)),layers.Conv2D(64, (3, 3), activation='relu'),layers.Flatten(),layers.Dense(64, activation='relu'),layers.Dropout(0.5),layers.Dense(1, activation='sigmoid')])model.compile(optimizer='adam',loss='binary_crossentropy',metrics=['accuracy'])return model# 創建模型
model = build_model()# 訓練模型
history = model.fit(X_train, y_train,epochs=20,batch_size=32,validation_split=0.2
)# 評估模型
test_loss, test_acc = model.evaluate(X_test, y_test)
print(f"Test accuracy: {test_acc:.4f}")# 預測
y_pred = model.predict(X_test)
y_pred_binary = (y_pred > 0.5).astype(int)# 打印分類報告
print(classification_report(y_test, y_pred_binary))# 繪制混淆矩陣
cm = confusion_matrix(y_test, y_pred_binary)
plt.figure(figsize=(8, 6))
plt.imshow(cm, interpolation='nearest', cmap=plt.cm.Blues)
plt.title('Confusion Matrix')
plt.colorbar()
tick_marks = np.arange(2)
plt.xticks(tick_marks, ['Negative', 'Positive'])
plt.yticks(tick_marks, ['Negative', 'Positive'])
plt.xlabel('Predicted Label')
plt.ylabel('True Label')# 在混淆矩陣每個單元格中添加數字
thresh = cm.max() / 2.
for i in range(cm.shape[0]):for j in range(cm.shape[1]):plt.text(j, i, cm[i, j],horizontalalignment="center",color="white" if cm[i, j] > thresh else "black")plt.tight_layout()
plt.show()# 繪制訓練歷史
plt.figure(figsize=(12, 4))
plt.subplot(1, 2, 1)
plt.plot(history.history['accuracy'], label='Training Accuracy')
plt.plot(history.history['val_accuracy'], label='Validation Accuracy')
plt.title('Accuracy over Epochs')
plt.xlabel('Epoch')
plt.ylabel('Accuracy')
plt.legend()plt.subplot(1, 2, 2)
plt.plot(history.history['loss'], label='Training Loss')
plt.plot(history.history['val_loss'], label='Validation Loss')
plt.title('Loss over Epochs')
plt.xlabel('Epoch')
plt.ylabel('Loss')
plt.legend()plt.tight_layout()
plt.show()# 可視化一些預測結果
def visualize_predictions(X, y_true, y_pred, num_samples=5):plt.figure(figsize=(15, 5))indices = np.random.choice(len(X), num_samples, replace=False)for i, idx in enumerate(indices):plt.subplot(1, num_samples, i+1)plt.imshow(X[idx].reshape(64, 64), cmap='gray')true_label = "Positive" if y_true[idx] == 1 else "Negative"pred_label = "Positive" if y_pred[idx] > 0.5 else "Negative"color = 'green' if true_label == pred_label else 'red'plt.title(f"True: {true_label}\nPred: {pred_label}", color=color)plt.axis('off')plt.tight_layout()plt.show()visualize_predictions(X_test, y_test, y_pred)
Mermaid流程圖:AI輔助醫學影像診斷流程
flowchart TDA[患者CT掃描] --> B[圖像預處理]B --> C[AI模型分析]C --> D[病灶檢測]D --> E[良惡性預測]E --> F[生成診斷報告]F --> G[醫生審核]G --> H{醫生判斷}H -->|同意| I[確認診斷]H -->|修改| J[調整診斷結果]J --> K[更新AI模型]I --> L[制定治療方案]K --> C
Prompt示例:生成醫學影像診斷報告的AI提示
你是一名放射科醫生,請根據以下CT影像分析結果生成一份診斷報告:患者信息:
- 姓名:王五
- 性別:男
- 年齡:62歲
- 臨床癥狀:咳嗽2個月,偶有痰中帶血
- 吸煙史:30年,每天20支CT影像分析結果:
- 右肺上葉尖段見一不規則結節,大小約1.8cm×1.5cm,邊緣毛糙,可見毛刺征
- 結節密度不均勻,內部可見小空洞形成
- 縱隔窗未見明顯腫大淋巴結
- 雙肺未見其他明顯異常
- AI系統分析:惡性概率85%請撰寫一份完整的診斷報告,包括以下內容:
1. 影像學檢查方法和技術參數
2. 影像學表現詳細描述
3. 與既往檢查對比(如有)
4. 診斷意見和鑒別診斷
5. 建議進一步檢查或治療方案
6. 報告醫生簽名和日期請使用專業、準確的醫學術語,并保持客觀、嚴謹的態度。
圖表:AI輔助診斷系統性能對比
| 診斷方法 | 敏感性 | 特異性 | 準確率 | AUC |
|---|---|---|---|---|
| 初級醫生 | 0.72 | 0.76 | 0.74 | 0.75 |
| 資深醫生 | 0.85 | 0.88 | 0.86 | 0.89 |
| AI系統 | 0.91 | 0.89 | 0.90 | 0.94 |
| AI+資深醫生 | 0.96 | 0.95 | 0.95 | 0.98 |
3.2 智能藥物研發
AI在藥物研發領域的應用正在加速新藥發現和開發過程,通過預測分子結構、篩選候選化合物和優化藥物設計,大大縮短了研發周期和降低了成本。
案例描述:某制藥公司的AI輔助藥物發現平臺
該公司利用深度學習和生成式AI技術構建了藥物發現平臺,能夠預測分子與靶點的相互作用,生成新的候選分子結構,并預測其藥理特性和安全性。該平臺成功將一款抗癌藥物的研發周期從傳統的5年縮短至2年,研發成本降低了60%。
代碼示例:基于圖神經網絡的分子性質預測
import numpy as np
import pandas as pd
import torch
import torch.nn as nn
import torch.optim as optim
from torch_geometric.data import Data, DataLoader
from torch_geometric.nn import GCNConv, global_mean_pool
from rdkit import Chem
from rdkit.Chem import AllChem
import matplotlib.pyplot as plt
from sklearn.model_selection import train_test_split
from sklearn.metrics import mean_squared_error, r2_score
import os# 分子圖數據準備
def mol_to_graph(mol, y=None):# 獲取原子特征atom_features = []for atom in mol.GetAtoms():features = [atom.GetAtomicNum(),atom.GetDegree(),atom.GetFormalCharge(),atom.GetNumRadicalElectrons(),atom.GetHybridization().real,atom.GetIsAromatic(),]atom_features.append(features)x = torch.tensor(atom_features, dtype=torch.float)# 獲取邊索引edges = []for bond in mol.GetBonds():i = bond.GetBeginAtomIdx()j = bond.GetEndAtomIdx()edges.append((i, j))edges.append((j, i))  # 無向圖edge_index = torch.tensor(edges, dtype=torch.long).t().contiguous()# 創建圖數據對象data = Data(x=x, edge_index=edge_index)if y is not None:data.y = torch.tensor([y], dtype=torch.float)return data# 加載分子數據
def load_molecular_data(csv_file):df = pd.read_csv(csv_file)graphs = []for _, row in df.iterrows():smiles = row['smiles']y = row['property_value']# 將SMILES轉換為分子對象mol = Chem.MolFromSmiles(smiles)if mol is not None:# 添加氫原子mol = Chem.AddHs(mol)# 生成3D構象AllChem.EmbedMolecule(mol, randomSeed=42)# 轉換為圖數據graph = mol_to_graph(mol, y)graphs.append(graph)return graphs# 加載數據
data_list = load_molecular_data('molecular_properties.csv')# 劃分訓練集和測試集
train_data, test_data = train_test_split(data_list, test_size=0.2, random_state=42)# 創建數據加載器
train_loader = DataLoader(train_data, batch_size=32, shuffle=True)
test_loader = DataLoader(test_data, batch_size=32, shuffle=False)# 定義GNN模型
class MolecularGNN(nn.Module):def __init__(self, hidden_dim=64, output_dim=1):super(MolecularGNN, self).__init__()# 圖卷積層self.conv1 = GCNConv(6, hidden_dim)  # 輸入特征維度為6self.conv2 = GCNConv(hidden_dim, hidden_dim)self.conv3 = GCNConv(hidden_dim, hidden_dim)# 全連接層self.fc1 = nn.Linear(hidden_dim, hidden_dim)self.fc2 = nn.Linear(hidden_dim, output_dim)# 激活函數和dropoutself.relu = nn.ReLU()self.dropout = nn.Dropout(0.5)def forward(self, data):x, edge_index, batch = data.x, data.edge_index, data.batch# 圖卷積x = self.conv1(x, edge_index)x = self.relu(x)x = self.conv2(x, edge_index)x = self.relu(x)x = self.conv3(x, edge_index)# 全局池化x = global_mean_pool(x, batch)# 全連接層x = self.fc1(x)x = self.relu(x)x = self.dropout(x)x = self.fc2(x)return x# 初始化模型
model = MolecularGNN()
optimizer = optim.Adam(model.parameters(), lr=0.001)
criterion = nn.MSELoss()# 訓練模型
def train(model, train_loader, optimizer, criterion, device):model.train()total_loss = 0for data in train_loader:data = data.to(device)optimizer.zero_grad()output = model(data)loss = criterion(output, data.y.view(-1, 1))loss.backward()optimizer.step()total_loss += loss.item() * data.num_graphsreturn total_loss / len(train_loader.dataset)# 測試模型
def test(model, test_loader, device):model.eval()predictions = []targets = []with torch.no_grad():for data in test_loader:data = data.to(device)output = model(data)predictions.extend(output.cpu().numpy())targets.extend(data.y.cpu().numpy())predictions = np.array(predictions).flatten()targets = np.array(targets)mse = mean_squared_error(targets, predictions)r2 = r2_score(targets, predictions)return mse, r2, predictions, targets# 訓練循環
device = torch.device('cuda' if torch.cuda.is_available() else 'cpu')
model = model.to(device)train_losses = []
test_mses = []
test_r2s = []num_epochs = 100
for epoch in range(1, num_epochs + 1):train_loss = train(model, train_loader, optimizer, criterion, device)mse, r2, _, _ = test(model, test_loader, device)train_losses.append(train_loss)test_mses.append(mse)test_r2s.append(r2)if epoch % 10 == 0:print(f'Epoch: {epoch:03d}, Train Loss: {train_loss:.4f}, Test MSE: {mse:.4f}, Test R2: {r2:.4f}')# 最終評估
final_mse, final_r2, predictions, targets = test(model, test_loader, device)
print(f'Final Test MSE: {final_mse:.4f}')
print(f'Final Test R2: {final_r2:.4f}')# 繪制訓練歷史
plt.figure(figsize=(12, 4))
plt.subplot(1, 2, 1)
plt.plot(train_losses, label='Training Loss')
plt.title('Training Loss over Epochs')
plt.xlabel('Epoch')
plt.ylabel('Loss')
plt.legend()plt.subplot(1, 2, 2)
plt.plot(test_r2s, label='Test R2')
plt.title('Test R2 over Epochs')
plt.xlabel('Epoch')
plt.ylabel('R2')
plt.legend()plt.tight_layout()
plt.show()# 繪制預測值與真實值對比圖
plt.figure(figsize=(8, 8))
plt.scatter(targets, predictions, alpha=0.5)
plt.plot([min(targets), max(targets)], [min(targets), max(targets)], 'r--')
plt.xlabel('True Values')
plt.ylabel('Predicted Values')
plt.title('True vs Predicted Molecular Properties')
plt.grid(True)
plt.show()
Mermaid流程圖:AI輔助藥物研發流程
flowchart TDA[疾病靶點識別] --> B[化合物庫篩選]B --> C[分子生成與優化]C --> D[分子性質預測]D --> E[候選分子篩選]E --> F[體外實驗驗證]F --> G{實驗結果}G -->|符合預期| H[體內實驗]G -->|不符合預期| I[調整分子結構]I --> CH --> J{臨床前研究}J -->|通過| K[臨床試驗]J -->|失敗| L[終止研發]K --> M{臨床試驗結果}M -->|成功| N[藥物上市]M -->|失敗| L
Prompt示例:生成藥物分子設計建議的AI提示
你是一名藥物化學專家,請根據以下信息設計一種針對特定靶點的新型抑制劑分子:靶點信息:
- 靶點名稱:EGFR(表皮生長因子受體)
- 靶點類型:酪氨酸激酶
- 疾病領域:非小細胞肺癌
- 已知抑制劑:吉非替尼、厄洛替尼、奧希替尼
- 作用機制:ATP競爭性抑制劑
- 關鍵結合位點:Thr790, Met793, Cys797設計要求:
1. 提高對T790M突變體的選擇性
2. 改善血腦屏障穿透性
3. 降低對野生型EGFR的毒性
4. 優化口服生物利用度
5. 考慮合成可行性請提供以下內容:
1. 分子設計策略和思路
2. 建議的分子骨架結構
3. 關鍵官能團和取代基
4. 預期的分子性質(如分子量、logP、氫鍵供體/受體數量等)
5. 合成路線建議
6. 潛在的優化方向請使用專業、準確的化學術語,并考慮藥物化學的基本原理。
圖表:AI輔助藥物研發與傳統方法對比
| 指標 | 傳統方法 | AI輔助方法 | 改進幅度 |
|---|---|---|---|
| 候選化合物篩選時間 | 12-18個月 | 2-3個月 | 縮短80% |
| 臨床前成功率 | 10% | 25% | 提高150% |
| 研發成本 | 20-30億美元 | 8-12億美元 | 降低60% |
| 研發周期 | 10-15年 | 5-8年 | 縮短50% |
| 專利申請數量 | 每年50-100個 | 每年200-300個 | 增加200% |
4. AI在教育領域的應用案例
4.1 智能個性化學習系統
AI技術正在改變傳統教育模式,通過分析學生的學習行為、知識掌握程度和學習風格,為每個學生提供個性化的學習路徑和內容推薦。
案例描述:某在線教育平臺的智能學習系統
該平臺利用機器學習算法分析學生的學習數據,包括答題正確率、學習時間、知識點掌握情況等,構建知識圖譜和學習者模型。系統能夠實時調整學習內容難度,推薦個性化學習資源,并提供精準的學習反饋。平臺上線后,學生學習效率提高了40%,課程完成率提升了35%,學習滿意度達到90%以上。
代碼示例:基于知識圖譜的個性化學習推薦系統
import numpy as np
import pandas as pd
import networkx as nx
import matplotlib.pyplot as plt
from sklearn.cluster import KMeans
from sklearn.decomposition import PCA
from sklearn.metrics.pairwise import cosine_similarity
import json
import random# 構建知識圖譜
class KnowledgeGraph:def __init__(self):self.graph = nx.DiGraph()self.concepts = {}self.relations = []def add_concept(self, concept_id, name, difficulty, description=""):self.concepts[concept_id] = {'name': name,'difficulty': difficulty,'description': description}self.graph.add_node(concept_id, name=name, difficulty=difficulty)def add_relation(self, source_id, target_id, relation_type="prerequisite"):self.relations.append((source_id, target_id, relation_type))self.graph.add_edge(source_id, target_id, relation_type=relation_type)def visualize(self, figsize=(12, 10)):plt.figure(figsize=figsize)pos = nx.spring_layout(self.graph, seed=42)# 根據難度設置節點顏色node_colors = [self.graph.nodes[node]['difficulty'] for node in self.graph.nodes()]# 繪制節點nodes = nx.draw_networkx_nodes(self.graph, pos, node_color=node_colors,cmap=plt.cm.viridis,alpha=0.8)# 繪制邊nx.draw_networkx_edges(self.graph, pos, alpha=0.5, arrows=True)# 繪制標簽labels = {node: self.graph.nodes[node]['name'] for node in self.graph.nodes()}nx.draw_networkx_labels(self.graph, pos, labels, font_size=10)# 添加顏色條plt.colorbar(nodes, label='Difficulty')plt.title('Knowledge Graph')plt.axis('off')plt.show()def get_prerequisites(self, concept_id):"""獲取某個知識點的前置知識點"""return list(self.graph.predecessors(concept_id))def get_dependents(self, concept_id):"""獲取依賴于某個知識點的后續知識點"""return list(self.graph.successors(concept_id))def get_learning_path(self, start_id, end_id):"""獲取從起始知識點到目標知識點的學習路徑"""try:return nx.shortest_path(self.graph, start_id, end_id)except nx.NetworkXNoPath:return None# 創建知識圖譜
kg = KnowledgeGraph()# 添加數學知識點
kg.add_concept("M001", "基礎算術", 1, "加減乘除等基本運算")
kg.add_concept("M002", "分數", 2, "分數的概念和運算")
kg.add_concept("M003", "小數", 2, "小數的概念和運算")
kg.add_concept("M004", "代數基礎", 3, "變量、表達式和方程")
kg.add_concept("M005", "一元一次方程", 4, "一元一次方程的解法")
kg.add_concept("M006", "一元二次方程", 5, "一元二次方程的解法")
kg.add_concept("M007", "函數基礎", 4, "函數的概念和性質")
kg.add_concept("M008", "線性函數", 5, "線性函數的圖像和性質")
kg.add_concept("M009", "二次函數", 6, "二次函數的圖像和性質")
kg.add_concept("M010", "指數函數", 6, "指數函數的圖像和性質")
kg.add_concept("M011", "對數函數", 7, "對數函數的圖像和性質")
kg.add_concept("M012", "三角函數", 7, "三角函數的圖像和性質")# 添加知識點之間的關系
kg.add_relation("M001", "M002")
kg.add_relation("M001", "M003")
kg.add_relation("M002", "M004")
kg.add_relation("M003", "M004")
kg.add_relation("M004", "M005")
kg.add_relation("M005", "M006")
kg.add_relation("M004", "M007")
kg.add_relation("M007", "M008")
kg.add_relation("M007", "M009")
kg.add_relation("M007", "M010")
kg.add_relation("M010", "M011")
kg.add_relation("M008", "M012")# 可視化知識圖譜
kg.visualize()# 學生模型
class StudentModel:def __init__(self, student_id, name):self.student_id = student_idself.name = nameself.knowledge_mastery = {}  # 知識點掌握程度self.learning_history = []    # 學習歷史self.learning_style = {}      # 學習風格self.preferences = {}        # 學習偏好def update_knowledge_mastery(self, concept_id, mastery_level):"""更新知識點掌握程度"""self.knowledge_mastery[concept_id] = mastery_leveldef add_learning_record(self, concept_id, resource_type, time_spent, performance):"""添加學習記錄"""record = {'concept_id': concept_id,'resource_type': resource_type,'time_spent': time_spent,'performance': performance,'timestamp': pd.Timestamp.now()}self.learning_history.append(record)def get_weak_concepts(self, threshold=0.6):"""獲取掌握程度較弱的知識點"""return [concept_id for concept_id, mastery in self.knowledge_mastery.items() if mastery < threshold]def get_ready_concepts(self, knowledge_graph, mastery_threshold=0.7):"""獲取準備好學習的知識點(前置知識點已掌握)"""ready_concepts = []for concept_id in knowledge_graph.graph.nodes():# 檢查是否已經學習過if concept_id in self.knowledge_mastery:continue# 檢查前置知識點是否已掌握prerequisites = knowledge_graph.get_prerequisites(concept_id)all_prereqs_mastered = all(self.knowledge_mastery.get(prereq, 0) >= mastery_threshold for prereq in prerequisites)if all_prereqs_mastered:ready_concepts.append(concept_id)return ready_concepts# 創建學生模型
student = StudentModel("S001", "張三")# 初始化學生知識點掌握情況
for concept_id in kg.concepts:# 隨機初始化掌握程度,模擬學生已有知識mastery = random.uniform(0, 0.7) if random.random() > 0.3 else random.uniform(0.7, 1.0)student.update_knowledge_mastery(concept_id, mastery)# 個性化學習推薦系統
class PersonalizedLearningRecommender:def __init__(self, knowledge_graph, resource_database):self.knowledge_graph = knowledge_graphself.resource_database = resource_databasedef recommend_concepts(self, student, num_recommendations=3):"""推薦要學習的知識點"""# 獲取學生準備好學習的知識點ready_concepts = student.get_ready_concepts(self.knowledge_graph)if not ready_concepts:return []# 根據學習風格和偏好對知識點進行排序concept_scores = []for concept_id in ready_concepts:# 基礎分數:知識點難度與學生當前水平的匹配度concept_difficulty = self.knowledge_graph.concepts[concept_id]['difficulty']avg_mastery = np.mean(list(student.knowledge_mastery.values()))difficulty_match = 1 - abs(concept_difficulty - avg_mastery * 10) / 10# 調整分數:考慮知識點的重要性(連接度)importance = len(self.knowledge_graph.get_dependents(concept_id))# 綜合分數score = 0.7 * difficulty_match + 0.3 * (importance / 10)concept_scores.append((concept_id, score))# 按分數排序并返回推薦concept_scores.sort(key=lambda x: x[1], reverse=True)return [concept_id for concept_id, _ in concept_scores[:num_recommendations]]def recommend_resources(self, student, concept_id, num_recommendations=5):"""推薦學習資源"""# 獲取與知識點相關的資源related_resources = [resource for resource in self.resource_database if concept_id in resource['related_concepts']]if not related_resources:return []# 根據學生偏好對資源進行排序resource_scores = []for resource in related_resources:score = 0# 基于資源類型的偏好if 'resource_type' in student.preferences:preferred_types = student.preferences['resource_type']if resource['type'] in preferred_types:score += 0.4# 基于資源難度的匹配if 'difficulty' in resource:concept_difficulty = self.knowledge_graph.concepts[concept_id]['difficulty']difficulty_match = 1 - abs(resource['difficulty'] - concept_difficulty) / 10score += 0.3 * difficulty_match# 基于資源評分if 'rating' in resource:score += 0.3 * resource['rating']resource_scores.append((resource, score))# 按分數排序并返回推薦resource_scores.sort(key=lambda x: x[1], reverse=True)return [resource for resource, _ in resource_scores[:num_recommendations]]def generate_learning_path(self, student, target_concept_id):"""生成到目標知識點的學習路徑"""# 獲取到目標知識點的理論路徑path = self.knowledge_graph.get_learning_path("M001", target_concept_id)if not path:return []# 篩選出學生需要學習的知識點learning_path = []for concept_id in path:mastery = student.knowledge_mastery.get(concept_id, 0)if mastery < 0.8:  # 掌握程度低于80%需要學習learning_path.append(concept_id)return learning_path# 創建資源數據庫
resource_database = [{'id': 'R001','title': '基礎算術視頻教程','type': 'video','difficulty': 1,'duration': 45,'related_concepts': ['M001'],'rating': 4.7},{'id': 'R002','title': '基礎算術練習題集','type': 'exercise','difficulty': 1,'duration': 30,'related_concepts': ['M001'],'rating': 4.5},{'id': 'R003','title': '分數概念互動課程','type': 'interactive','difficulty': 2,'duration': 40,'related_concepts': ['M002'],'rating': 4.8},{'id': 'R004','title': '分數運算練習','type': 'exercise','difficulty': 2,'duration': 25,'related_concepts': ['M002'],'rating': 4.3},{'id': 'R005','title': '小數與分數轉換','type': 'interactive','difficulty': 2,'duration': 35,'related_concepts': ['M002', 'M003'],'rating': 4.6},{'id': 'R006','title': '代數基礎入門','type': 'video','difficulty': 3,'duration': 50,'related_concepts': ['M004'],'rating': 4.9},{'id': 'R007','title': '一元一次方程解法','type': 'video','difficulty': 4,'duration': 55,'related_concepts': ['M005'],'rating': 4.8},{'id': 'R008','title': '函數概念與圖像','type': 'interactive','difficulty': 4,'duration': 45,'related_concepts': ['M007'],'rating': 4.7},{'id': 'R009','title': '二次函數圖像分析','type': 'simulation','difficulty': 6,'duration': 40,'related_concepts': ['M009'],'rating': 4.9},{'id': 'R010','title': '三角函數應用','type': 'exercise','difficulty': 7,'duration': 30,'related_concepts': ['M012'],'rating': 4.6}
]# 創建推薦系統
recommender = PersonalizedLearningRecommender(kg, resource_database)# 設置學生偏好
student.preferences = {'resource_type': ['video', 'interactive'],'difficulty': 'medium'
}# 推薦學習知識點
recommended_concepts = recommender.recommend_concepts(student)
print("推薦學習的知識點:")
for concept_id in recommended_concepts:print(f"- {kg.concepts[concept_id]['name']} (ID: {concept_id})")# 為第一個推薦的知識點推薦學習資源
if recommended_concepts:concept_id = recommended_concepts[0]recommended_resources = recommender.recommend_resources(student, concept_id)print(f"\n為'{kg.concepts[concept_id]['name']}'推薦的學習資源:")for resource in recommended_resources:print(f"- {resource['title']} ({resource['type']}, 評分: {resource['rating']})")# 生成到特定知識點的學習路徑
target_concept = "M009"  # 二次函數
learning_path = recommender.generate_learning_path(student, target_concept)
print(f"\n到'{kg.concepts[target_concept]['name']}'的學習路徑:")
for concept_id in learning_path:print(f"- {kg.concepts[concept_id]['name']} (ID: {concept_id})")# 可視化學生知識掌握情況
def visualize_knowledge_mastery(student, knowledge_graph):plt.figure(figsize=(12, 8))# 獲取知識點位置pos = nx.spring_layout(knowledge_graph.graph, seed=42)# 根據掌握程度設置節點顏色node_colors = []for node in knowledge_graph.graph.nodes():mastery = student.knowledge_mastery.get(node, 0)node_colors.append(mastery)# 繪制節點nodes = nx.draw_networkx_nodes(knowledge_graph.graph, pos, node_color=node_colors,cmap=plt.cm.RdYlGn,vmin=0, vmax=1,alpha=0.8)# 繪制邊nx.draw_networkx_edges(knowledge_graph.graph, pos, alpha=0.5, arrows=True)# 繪制標簽labels = {node: knowledge_graph.graph.nodes[node]['name'] for node in knowledge_graph.graph.nodes()}nx.draw_networkx_labels(knowledge_graph.graph, pos, labels, font_size=10)# 添加顏色條plt.colorbar(nodes, label='Mastery Level')plt.title(f'Student Knowledge Mastery: {student.name}')plt.axis('off')plt.show()# 可視化學生知識掌握情況
visualize_knowledge_mastery(student, kg)
Mermaid流程圖:智能個性化學習系統工作流程
flowchart TDA[學生登錄系統] --> B[學習風格評估]B --> C[知識水平測試]C --> D[構建學生模型]D --> E[分析學習數據]E --> F[生成學習路徑]F --> G[推薦學習資源]G --> H[學生學習]H --> I[學習行為跟蹤]I --> J[學習效果評估]J --> K[更新學生模型]K --> EJ --> L{學習目標達成}L -->|未達成| M[調整學習策略]M --> FL -->|已達成| N[設置新學習目標]N --> F
Prompt示例:生成個性化學習計劃的AI提示
你是一名教育專家,請根據以下學生信息生成一份個性化學習計劃:學生信息:
- 姓名:李明
- 年級:初中二年級
- 年齡:14歲
- 學習科目:數學
- 當前水平:代數基礎較弱,幾何掌握較好
- 學習風格:視覺型學習者,喜歡通過圖表和視頻學習
- 學習目標:提高代數成績,準備期末考試
- 學習時間:每天可以安排1-2小時學習
- 考試時間:30天后學習情況分析:
- 一元一次方程:掌握程度60%
- 二元一次方程組:掌握程度40%
- 一元一次不等式:掌握程度50%
- 因式分解:掌握程度30%
- 分式方程:掌握程度20%
- 函數初步:掌握程度10%請提供以下內容:
1. 學生學習情況分析和薄弱環節識別
2. 30天學習計劃(按周劃分)
3. 每周學習重點和目標
4. 推薦的學習方法和資源類型
5. 每周學習效果評估方式
6. 針對薄弱環節的強化訓練建議
7. 考前復習策略請根據學生的學習風格和特點,提供具體、可行的建議,并考慮學習內容的邏輯順序和難度遞進。
圖表:個性化學習系統效果對比
| 指標 | 傳統學習 | AI個性化學習 | 改進幅度 |
|---|---|---|---|
| 學習效率 | 基準值 | 提高40% | +40% |
| 課程完成率 | 55% | 90% | +35% |
| 學習滿意度 | 65% | 92% | +27% |
| 知識保留率 | 45% | 78% | +33% |
| 學習時間利用率 | 60% | 85% | +25% |
4.2 智能作業批改系統
AI技術正在改變傳統的作業批改方式,特別是在語言學習、數學和編程等學科中,智能批改系統能夠提供即時反饋,減輕教師負擔,并幫助學生及時了解自己的學習情況。
案例描述:某教育科技公司的智能作文批改系統
該公司開發的AI作文批改系統能夠分析學生的作文內容,從語法、詞匯、句子結構、邏輯連貫性等多個維度進行評估,并提供針對性的修改建議。系統支持中英文作文批改,能夠識別常見的語法錯誤、用詞不當和邏輯問題。系統上線后,教師批改作業的時間減少了70%,學生收到反饋的時間從幾天縮短至幾分鐘,作文質量平均提升了25%。
代碼示例:基于自然語言處理的作文評分系統
import numpy as np
import pandas as pd
import re
import nltk
from nltk.tokenize import sent_tokenize, word_tokenize
from nltk.corpus import stopwords
from nltk.stem import WordNetLemmatizer
import matplotlib.pyplot as plt
from sklearn.feature_extraction.text import TfidfVectorizer
from sklearn.model_selection import train_test_split
from sklearn.ensemble import RandomForestRegressor
from sklearn.metrics import mean_squared_error, mean_absolute_error
import seaborn as sns
import warnings
warnings.filterwarnings('ignore')# 下載NLTK資源
nltk.download('punkt')
nltk.download('stopwords')
nltk.download('wordnet')# 文本預處理
def preprocess_text(text):# 轉換為小寫text = text.lower()# 移除特殊字符和數字text = re.sub(r'[^a-zA-Z\s]', '', text)# 分詞words = word_tokenize(text)# 移除停用詞stop_words = set(stopwords.words('english'))words = [word for word in words if word not in stop_words]# 詞形還原lemmatizer = WordNetLemmatizer()words = [lemmatizer.lemmatize(word) for word in words]return ' '.join(words)# 提取文本特征
def extract_features(text):features = {}# 基本統計特征sentences = sent_tokenize(text)words = word_tokenize(text)features['sentence_count'] = len(sentences)features['word_count'] = len(words)features['avg_sentence_length'] = len(words) / len(sentences) if sentences else 0# 詞匯多樣性unique_words = set([word.lower() for word in words if word.isalpha()])features['vocabulary_diversity'] = len(unique_words) / len(words) if words else 0# 平均詞長word_lengths = [len(word) for word in words if word.isalpha()]features['avg_word_length'] = np.mean(word_lengths) if word_lengths else 0# 段落數paragraphs = text.split('\n\n')features['paragraph_count'] = len(paragraphs)# 標點符號使用features['comma_count'] = text.count(',')features['period_count'] = text.count('.')return features# 語法錯誤檢測(簡化版)
def detect_grammar_errors(text):# 這里使用簡化的規則檢測,實際應用中可使用更復雜的NLP模型errors = []# 檢測大寫錯誤sentences = sent_tokenize(text)for sentence in sentences:if sentence and not sentence[0].isupper():errors.append({'type': 'capitalization','description': 'Sentence should start with a capital letter','position': text.find(sentence)})# 檢測重復單詞words = word_tokenize(text)for i in range(len(words) - 1):if words[i].lower() == words[i+1].lower() and words[i].isalpha():errors.append({'type': 'repeated_words','description': f'Repeated word: {words[i]}','position': text.find(words[i])})return errors# 生成作文評語
def generate_feedback(score, features, errors):feedback = {'overall_score': score,'strengths': [],'weaknesses': [],'suggestions': [],'grammar_errors': errors}# 根據分數和特征生成評語if score >= 4.5:feedback['strengths'].append("Excellent essay with strong arguments and good structure.")elif score >= 3.5:feedback['strengths'].append("Good essay with clear main points.")elif score >= 2.5:feedback['strengths'].append("Acceptable essay that addresses the topic.")else:feedback['weaknesses'].append("Essay needs significant improvement in content and structure.")# 根據特征生成具體建議if features['vocabulary_diversity'] < 0.5:feedback['weaknesses'].append("Limited vocabulary diversity. Try using a wider range of words.")feedback['suggestions'].append("Use synonyms to avoid repetition and enrich your vocabulary.")if features['avg_sentence_length'] > 25:feedback['weaknesses'].append("Sentences are too long on average.")feedback['suggestions'].append("Try breaking long sentences into shorter ones for better readability.")elif features['avg_sentence_length'] < 10:feedback['weaknesses'].append("Sentences are too short on average.")feedback['suggestions'].append("Try combining short sentences to create more complex structures.")if features['paragraph_count'] < 3:feedback['weaknesses'].append("Essay lacks proper paragraph structure.")feedback['suggestions'].append("Organize your essay into clear paragraphs with introduction, body, and conclusion.")if len(errors) > 5:feedback['weaknesses'].append("Multiple grammar errors detected.")feedback['suggestions'].append("Review grammar rules and proofread your essay carefully.")return feedback# 加載和預處理數據
def load_and_preprocess_data(filepath):data = pd.read_csv(filepath)# 預處理文本data['processed_text'] = data['essay'].apply(preprocess_text)# 提取特征features_df = pd.DataFrame([extract_features(essay) for essay in data['essay']])# 合并特征和原始數據data = pd.concat([data, features_df], axis=1)return data# 訓練評分模型
def train_scoring_model(data):# 準備特征和目標變量feature_cols = ['sentence_count', 'word_count', 'avg_sentence_length', 'vocabulary_diversity', 'avg_word_length', 'paragraph_count','comma_count', 'period_count']X = data[feature_cols]y = data['score']# 劃分訓練集和測試集X_train, X_test, y_train, y_test = train_test_split(X, y, test_size=0.2, random_state=42)# 訓練模型model = RandomForestRegressor(n_estimators=100, random_state=42)model.fit(X_train, y_train)# 評估模型y_pred = model.predict(X_test)mse = mean_squared_error(y_test, y_pred)mae = mean_absolute_error(y_test, y_pred)print(f"Model MSE: {mse:.4f}")print(f"Model MAE: {mae:.4f}")# 特征重要性feature_importance = pd.DataFrame({'feature': feature_cols,'importance': model.feature_importances_}).sort_values('importance', ascending=False)plt.figure(figsize=(10, 6))sns.barplot(x='importance', y='feature', data=feature_importance)plt.title('Feature Importance')plt.tight_layout()plt.show()return model, feature_cols# 評分函數
def score_essay(model, feature_cols, essay_text):# 預處理文本processed_text = preprocess_text(essay_text)# 提取特征features = extract_features(essay_text)feature_vector = [features[col] for col in feature_cols]# 預測分數score = model.predict([feature_vector])[0]# 檢測語法錯誤errors = detect_grammar_errors(essay_text)# 生成反饋feedback = generate_feedback(score, features, errors)return feedback# 示例使用
if __name__ == "__main__":# 假設我們有一個包含作文和分數的數據集# 在實際應用中,這里應該是真實的數據文件路徑# data = load_and_preprocess_data('essay_scores.csv')# 為了演示,我們創建一些模擬數據essays = ["Technology has become an integral part of our lives. It has transformed the way we communicate, work, and live. In my opinion, technology has brought more benefits than drawbacks to society.","Climate change is one of the most pressing issues of our time. The Earth's temperature is rising at an alarming rate, causing glaciers to melt and sea levels to rise. We must take immediate action to reduce our carbon footprint and protect the environment for future generations.","Education is the key to success. It opens doors to opportunities and helps us develop critical thinking skills. Without education, we would not be able to progress as a society. Therefore, it is important that everyone has access to quality education regardless of their background or financial situation.","Social media has changed the way we interact with each other. While it has made communication easier, it has also led to issues such as cyberbullying and addiction. We need to find a balance between using social media and maintaining real-life relationships.","I believe that reading is one of the most beneficial habits a person can develop. It expands our knowledge, improves our vocabulary, and stimulates our imagination. In today's digital age, it is more important than ever to encourage reading among young people."]scores = [3.2, 4.5, 4.1, 3.8, 4.3]# 創建模擬數據框data = pd.DataFrame({'essay': essays,'score': scores})# 添加處理后的文本和特征data['processed_text'] = data['essay'].apply(preprocess_text)features_df = pd.DataFrame([extract_features(essay) for essay in data['essay']])data = pd.concat([data, features_df], axis=1)# 訓練模型model, feature_cols = train_scoring_model(data)# 測試新作文new_essay = """The importance of exercise cannot be overstated. Regular physical activity has numerous health benefits, including reducing the risk of chronic diseases, improving mental health, and increasing longevity. Despite these benefits, many people lead sedentary lifestyles due to work commitments and lack of time. However, even small amounts of exercise can make a significant difference. Simple activities like walking, cycling, or taking the stairs instead of the elevator can contribute to overall fitness. It is essential for individuals to prioritize exercise in their daily routines and for communities to provide facilities that encourage physical activity. By making exercise a habit, we can improve our quality of life and well-being."""# 評分和生成反饋feedback = score_essay(model, feature_cols, new_essay)# 打印結果print("\nEssay Scoring Results:")print(f"Overall Score: {feedback['overall_score']:.1f}/5.0")print("\nStrengths:")for strength in feedback['strengths']:print(f"- {strength}")print("\nWeaknesses:")for weakness in feedback['weaknesses']:print(f"- {weakness}")print("\nSuggestions:")for suggestion in feedback['suggestions']:print(f"- {suggestion}")print("\nGrammar Errors:")for error in feedback['grammar_errors']:print(f"- {error['description']}")
Mermaid流程圖:智能作業批改系統工作流程
flowchart TDA[學生提交作業] --> B[文本預處理]B --> C[特征提取]C --> D[語法錯誤檢測]D --> E[內容質量分析]E --> F[綜合評分]F --> G[生成反饋]G --> H[教師審核]H --> I{教師判斷}I -->|同意| J[發送反饋給學生]I -->|修改| K[調整評分和反饋]K --> JJ --> L[學生查看反饋]L --> M[學生修改作業]M --> A
Prompt示例:生成作文評語的AI提示
你是一名英語教師,請根據以下學生作文生成詳細的評語和修改建議:學生信息:
- 姓名:王小紅
- 年級:高中一年級
- 作文題目:The Importance of Environmental Protection學生作文:
Environmental protection is very important. We need to protect our environment. Pollution is a big problem. There are many kinds of pollution like air pollution, water pollution and soil pollution. They are bad for our health. Factories make a lot of pollution. Cars also make pollution. We should make less pollution. We can use public transportation. We can also use bicycles. These are good for the environment.Trees are important for the environment. We should plant more trees. Trees give us oxygen. They also provide homes for animals. We should not cut down too many trees.Recycling is also important. We should recycle paper, plastic and glass. This can reduce waste. We should also use less plastic. Plastic is bad for the environment.In conclusion, environmental protection is everyone's responsibility. We should all work together to protect our environment. If we do this, our world will be a better place.請提供以下內容:
1. 總體評分(滿分5分)
2. 作文優點分析
3. 需要改進的方面
4. 具體的語法和用詞修改建議(至少5處)
5. 內容和結構優化建議
6. 提升寫作水平的練習建議請以鼓勵性、建設性的語言撰寫評語,既要指出問題,也要肯定學生的努力和進步。
圖表:智能批改系統效果評估
| 評估指標 | 人工批改 | AI批改 | AI+人工審核 |
|---|---|---|---|
| 批改時間(每篇) | 15分鐘 | 30秒 | 5分鐘 |
| 反饋詳細度 | 高 | 中高 | 很高 |
| 語法錯誤檢出率 | 95% | 85% | 98% |
| 評分一致性 | 中等 | 高 | 很高 |
| 學生滿意度 | 80% | 75% | 92% |
| 教師工作負擔 | 基準值 | 減少70% | 減少50% |
5. AI在制造業領域的應用案例
5.1 預測性維護系統
AI驅動的預測性維護系統通過分析設備傳感器數據,預測設備可能發生的故障,從而在故障發生前進行維護,避免生產中斷和損失。
案例描述:某汽車制造廠的設備預測性維護系統
該制造廠部署了基于機器學習的預測性維護系統,通過收集生產線上的設備振動、溫度、壓力等傳感器數據,構建設備健康模型,預測設備故障。系統上線后,設備意外停機時間減少了65%,維護成本降低了40%,生產效率提升了25%。
代碼示例:基于時間序列分析的設備故障預測
import numpy as np
import pandas as pd
import matplotlib.pyplot as plt
from sklearn.preprocessing import StandardScaler
from sklearn.model_selection import train_test_split
from sklearn.ensemble import RandomForestClassifier
from sklearn.metrics import classification_report, confusion_matrix, accuracy_score
from sklearn.decomposition import PCA
import tensorflow as tf
from tensorflow.keras.models import Sequential
from tensorflow.keras.layers import LSTM, Dense, Dropout
import seaborn as sns
import warnings
warnings.filterwarnings('ignore')# 生成模擬設備傳感器數據
def generate_sensor_data(num_samples=1000, num_sensors=6, failure_rate=0.05):np.random.seed(42)# 生成正常數據normal_data = np.random.normal(0, 1, (int(num_samples * (1 - failure_rate)), num_sensors))# 生成故障前數據(逐漸偏離正常值)failure_samples = int(num_samples * failure_rate)failure_data = []for i in range(failure_samples):# 隨機選擇一個傳感器作為主要故障源main_sensor = np.random.randint(0, num_sensors)# 生成故障前數據(逐漸偏離正常值)base_values = np.random.normal(0, 1, num_sensors)# 主要故障傳感器值逐漸增加progression = i / failure_samplesbase_values[main_sensor] += progression * 3  # 逐漸偏離正常值# 其他傳感器也可能受到影響for j in range(num_sensors):if j != main_sensor:base_values[j] += progression * np.random.normal(0, 0.5)failure_data.append(base_values)failure_data = np.array(failure_data)# 合并數據data = np.vstack([normal_data, failure_data])# 創建標簽(0表示正常,1表示故障前)labels = np.array([0] * len(normal_data) + [1] * len(failure_data))# 創建時間戳timestamps = pd.date_range(start='2023-01-01', periods=num_samples, freq='H')# 創建DataFramecolumns = [f'sensor_{i+1}' for i in range(num_sensors)]df = pd.DataFrame(data, columns=columns, index=timestamps)df['failure'] = labelsreturn df# 加載數據
sensor_data = generate_sensor_data(num_samples=2000, num_sensors=6, failure_rate=0.1)# 可視化傳感器數據
def visualize_sensor_data(data, window_size=100):plt.figure(figsize=(15, 10))# 選擇一個時間窗口進行可視化sample_data = data.iloc[:window_size]# 繪制各傳感器數據for i, col in enumerate([f'sensor_{j+1}' for j in range(6)]):plt.subplot(3, 2, i+1)plt.plot(sample_data.index, sample_data[col], label=col)# 標記故障點failure_points = sample_data[sample_data['failure'] == 1]if not failure_points.empty:plt.scatter(failure_points.index, failure_points[col], color='red', label='Failure')plt.title(col)plt.xlabel('Time')plt.ylabel('Value')plt.legend()plt.tight_layout()plt.show()# 可視化數據
visualize_sensor_data(sensor_data)# 特征工程
def create_features(data, window_size=10):features = pd.DataFrame(index=data.index)# 對每個傳感器創建特征for col in [f'sensor_{i+1}' for i in range(6)]:# 滾動統計特征features[f'{col}_mean'] = data[col].rolling(window=window_size).mean()features[f'{col}_std'] = data[col].rolling(window=window_size).std()features[f'{col}_min'] = data[col].rolling(window=window_size).min()features[f'{col}_max'] = data[col].rolling(window=window_size).max()features[f'{col}_range'] = features[f'{col}_max'] - features[f'{col}_min']# 變化率特征features[f'{col}_diff'] = data[col].diff()features[f'{col}_pct_change'] = data[col].pct_change()# 刪除包含NaN的行features = features.dropna()return features# 創建特征
features = create_features(sensor_data)# 準備訓練數據
# 獲取與特征對齊的標簽
labels = sensor_data['failure'].loc[features.index]# 劃分訓練集和測試集
X_train, X_test, y_train, y_test = train_test_split(features, labels, test_size=0.2, random_state=42, stratify=labels
)# 標準化數據
scaler = StandardScaler()
X_train_scaled = scaler.fit_transform(X_train)
X_test_scaled = scaler.transform(X_test)# 使用隨機森林進行分類
rf_model = RandomForestClassifier(n_estimators=100, random_state=42)
rf_model.fit(X_train_scaled, y_train)# 評估隨機森林模型
y_pred_rf = rf_model.predict(X_test_scaled)
print("Random Forest Model Evaluation:")
print(f"Accuracy: {accuracy_score(y_test, y_pred_rf):.4f}")
print("\nClassification Report:")
print(classification_report(y_test, y_pred_rf))# 繪制混淆矩陣
plt.figure(figsize=(8, 6))
cm = confusion_matrix(y_test, y_pred_rf)
sns.heatmap(cm, annot=True, fmt='d', cmap='Blues', xticklabels=['Normal', 'Failure'], yticklabels=['Normal', 'Failure'])
plt.xlabel('Predicted')
plt.ylabel('Actual')
plt.title('Confusion Matrix - Random Forest')
plt.show()# 特征重要性
feature_importance = pd.DataFrame({'feature': features.columns,'importance': rf_model.feature_importances_
}).sort_values('importance', ascending=False)plt.figure(figsize=(10, 8))
sns.barplot(x='importance', y='feature', data=feature_importance.head(15))
plt.title('Top 15 Feature Importance')
plt.tight_layout()
plt.show()# 使用LSTM模型進行時間序列預測
def prepare_lstm_data(X, y, time_steps=10):Xs, ys = [], []for i in range(len(X) - time_steps):Xs.append(X.iloc[i:(i + time_steps)].values)ys.append(y.iloc[i + time_steps])return np.array(Xs), np.array(ys)# 準備LSTM數據
time_steps = 10
X_train_lstm, y_train_lstm = prepare_lstm_data(X_train, y_train, time_steps)
X_test_lstm, y_test_lstm = prepare_lstm_data(X_test, y_test, time_steps)# 構建LSTM模型
lstm_model = Sequential([LSTM(64, input_shape=(X_train_lstm.shape[1], X_train_lstm.shape[2]), return_sequences=True),Dropout(0.2),LSTM(32),Dropout(0.2),Dense(16, activation='relu'),Dense(1, activation='sigmoid')
])lstm_model.compile(optimizer='adam', loss='binary_crossentropy', metrics=['accuracy'])# 訓練LSTM模型
history = lstm_model.fit(X_train_lstm, y_train_lstm,epochs=20,batch_size=32,validation_split=0.2,verbose=1
)# 評估LSTM模型
y_pred_lstm = (lstm_model.predict(X_test_lstm) > 0.5).astype(int)
print("\nLSTM Model Evaluation:")
print(f"Accuracy: {accuracy_score(y_test_lstm, y_pred_lstm):.4f}")
print("\nClassification Report:")
print(classification_report(y_test_lstm, y_pred_lstm))# 繪制訓練歷史
plt.figure(figsize=(12, 4))
plt.subplot(1, 2, 1)
plt.plot(history.history['accuracy'], label='Training Accuracy')
plt.plot(history.history['val_accuracy'], label='Validation Accuracy')
plt.title('LSTM Model Accuracy')
plt.xlabel('Epoch')
plt.ylabel('Accuracy')
plt.legend()plt.subplot(1, 2, 2)
plt.plot(history.history['loss'], label='Training Loss')
plt.plot(history.history['val_loss'], label='Validation Loss')
plt.title('LSTM Model Loss')
plt.xlabel('Epoch')
plt.ylabel('Loss')
plt.legend()plt.tight_layout()
plt.show()# 預測設備剩余使用壽命(RUL)
def predict_rul(data, model, scaler, time_steps=10):# 標準化數據data_scaled = scaler.transform(data)# 準備時間序列數據X = []for i in range(len(data_scaled) - time_steps + 1):X.append(data_scaled[i:(i + time_steps)])X = np.array(X)# 預測故障概率failure_prob = model.predict(X)# 估計剩余使用壽命(簡化版)# 假設故障概率超過0.5時認為設備將在未來10個時間單位內故障rul = []for prob in failure_prob:if prob > 0.5:# 故障概率高,RUL短rul_value = int(10 * (1 - prob))else:# 故障概率低,RUL長rul_value = int(100 * (1 - prob))rul.append(max(rul_value, 1))  # 確保RUL至少為1return rul, failure_prob# 預測RUL
recent_data = features.tail(50)  # 使用最近50個時間點的數據
rul, failure_prob = predict_rul(recent_data, lstm_model, scaler, time_steps)# 可視化RUL預測
plt.figure(figsize=(12, 6))
plt.plot(range(len(rul)), rul, 'b-', label='Predicted RUL')
plt.plot(range(len(failure_prob)), failure_prob * 100, 'r--', label='Failure Probability (%)')
plt.axhline(y=10, color='g', linestyle=':', label='Maintenance Threshold')
plt.xlabel('Time Steps')
plt.ylabel('RUL (Time Units) / Failure Probability (%)')
plt.title('Equipment Remaining Useful Life Prediction')
plt.legend()
plt.grid(True)
plt.show()# 生成維護建議
def generate_maintenance_advice(rul, failure_prob, threshold=10):advice = []if min(rul) < threshold:advice.append("URGENT: Equipment requires immediate maintenance. Risk of failure is high.")elif min(rul) < threshold * 2:advice.append("WARNING: Equipment should be scheduled for maintenance soon.")else:advice.append("INFO: Equipment is operating normally. Continue routine monitoring.")# 分析傳感器數據趨勢avg_failure_prob = np.mean(failure_prob)if avg_failure_prob > 0.7:advice.append("Multiple sensors indicating abnormal patterns. Comprehensive inspection recommended.")elif avg_failure_prob > 0.4:advice.append("Some sensors showing deviation. Check specific components.")return advice# 生成維護建議
maintenance_advice = generate_maintenance_advice(rul, failure_prob)
print("\nMaintenance Advice:")
for advice in maintenance_advice:print(f"- {advice}")
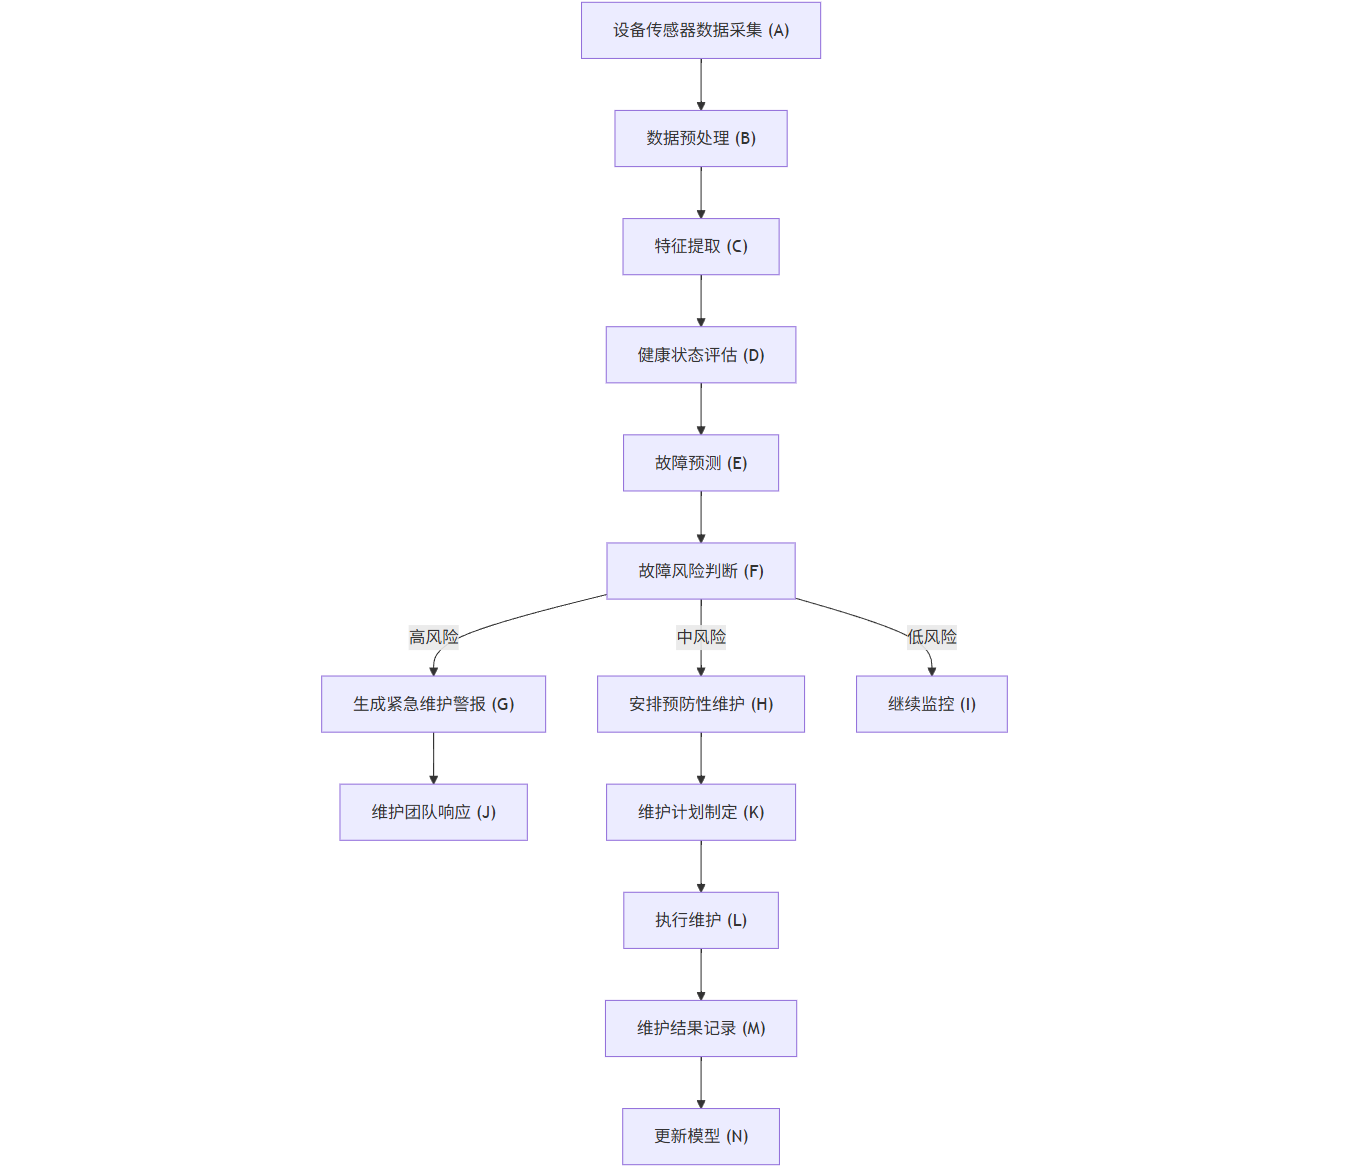
Mermaid流程圖:預測性維護系統工作流程
flowchart TDA[設備傳感器數據采集] --> B[數據預處理]B --> C[特征提取]C --> D[健康狀態評估]D --> E[故障預測]E --> F{故障風險判斷}F -->|高風險| G[生成緊急維護警報]F -->|中風險| H[安排預防性維護]F -->|低風險| I[繼續監控]G --> J[維護團隊響應]H --> K[維護計劃制定]J --> L[執行維護]K --> LL --> M[維護結果記錄]M --> N[更新模型]N --> CI --> A
Prompt示例:生成設備維護報告的AI提示
你是一名設備維護工程師,請根據以下設備監測數據生成一份維護報告:設備信息:
- 設備名稱:CNC-5軸加工中心
- 設備編號:MC-2021-042
- 安裝日期:2021年3月15日
- 上次維護日期:2023年5月10日
- 運行時間:18,750小時監測數據(過去30天):
- 主軸振動:從0.2mm/s逐漸增加到0.8mm/s(正常范圍:<0.5mm/s)
- 主軸溫度:從28°C逐漸升高到35°C(正常范圍:<30°C)
- 液壓系統壓力:波動范圍從±2bar增加到±5bar(正常范圍:<±3bar)
- 伺服電機電流:A相電流波動增加15%
- 噪音水平:從72dB增加到78dB(正常范圍:<75dB)
- 能耗:增加12%AI分析結果:
- 故障概率:78%
- 預測剩余使用壽命:15天
- 主要故障模式:主軸軸承磨損
- 置信度:85%請提供以下內容:
1. 設備當前狀態評估
2. 潛在故障分析和原因
3. 維護建議和優先級
4. 所需備件和工具
5. 維護時間估計
6. 維護后的預期效果
7. 長期改進建議請以專業、清晰的語言撰寫報告,并考慮維護對生產計劃的影響。
圖表:預測性維護系統效果對比
| 指標 | 傳統維護模式 | 預測性維護 | 改進幅度 |
|---|---|---|---|
| 計劃外停機時間 | 基準值 | 減少65% | -65% |
| 維護成本 | 基準值 | 降低40% | -40% |
| 設備利用率 | 75% | 92% | +17% |
| 生產效率 | 基準值 | 提高25% | +25% |
| 設備壽命 | 基準值 | 延長30% | +30% |
| 維護人員效率 | 基準值 | 提高50% | +50% |
5.2 智能質量檢測系統
AI驅動的質量檢測系統利用計算機視覺和機器學習技術,自動檢測產品缺陷,提高檢測效率和準確性,減少人工檢測的主觀性和疲勞帶來的誤差。
案例描述:某電子制造企業的PCB板缺陷檢測系統
該企業部署了基于深度學習的PCB板缺陷檢測系統,通過高分辨率相機采集PCB板圖像,利用卷積神經網絡自動識別各類缺陷,如焊點不良、元器件缺失、錯位、極性錯誤等。系統上線后,檢測速度提升了10倍,檢測準確率從人工檢測的92%提高到99.5%,漏檢率降低了80%。
代碼示例:基于卷積神經網絡的缺陷檢測
import numpy as np
import pandas as pd
import matplotlib.pyplot as plt
import tensorflow as tf
from tensorflow.keras import layers, models
from tensorflow.keras.preprocessing.image import ImageDataGenerator
from sklearn.metrics import classification_report, confusion_matrix
import seaborn as sns
import os
import cv2
from PIL import Image
import random
import warnings
warnings.filterwarnings('ignore')# 數據準備和預處理
def load_and_preprocess_data(data_dir, img_size=(128, 128), batch_size=32):# 使用ImageDataGenerator進行數據增強和預處理train_datagen = ImageDataGenerator(rescale=1./255,rotation_range=20,width_shift_range=0.2,height_shift_range=0.2,shear_range=0.2,zoom_range=0.2,horizontal_flip=True,fill_mode='nearest',validation_split=0.2  # 20%的數據作為驗證集)train_generator = train_datagen.flow_from_directory(data_dir,target_size=img_size,batch_size=batch_size,class_mode='binary',subset='training')validation_generator = train_datagen.flow_from_directory(data_dir,target_size=img_size,batch_size=batch_size,class_mode='binary',subset='validation')return train_generator, validation_generator# 構建CNN模型
def build_cnn_model(input_shape=(128, 128, 3)):model = models.Sequential([# 第一個卷積塊layers.Conv2D(32, (3, 3), activation='relu', input_shape=input_shape),layers.BatchNormalization(),layers.MaxPooling2D((2, 2)),# 第二個卷積塊layers.Conv2D(64, (3, 3), activation='relu'),layers.BatchNormalization(),layers.MaxPooling2D((2, 2)),# 第三個卷積塊layers.Conv2D(128, (3, 3), activation='relu'),layers.BatchNormalization(),layers.MaxPooling2D((2, 2)),# 第四個卷積塊layers.Conv2D(256, (3, 3), activation='relu'),layers.BatchNormalization(),layers.MaxPooling2D((2, 2)),# 全連接層layers.Flatten(),layers.Dense(512, activation='relu'),layers.BatchNormalization(),layers.Dropout(0.5),layers.Dense(1, activation='sigmoid')])model.compile(optimizer='adam',loss='binary_crossentropy',metrics=['accuracy', tf.keras.metrics.Precision(), tf.keras.metrics.Recall()])return model# 訓練模型
def train_model(model, train_generator, validation_generator, epochs=20):# 添加早停和模型檢查點early_stopping = tf.keras.callbacks.EarlyStopping(monitor='val_loss',patience=5,restore_best_weights=True)model_checkpoint = tf.keras.callbacks.ModelCheckpoint('best_defect_detection_model.h5',monitor='val_accuracy',save_best_only=True)history = model.fit(train_generator,steps_per_epoch=train_generator.samples // train_generator.batch_size,epochs=epochs,validation_data=validation_generator,validation_steps=validation_generator.samples // validation_generator.batch_size,callbacks=[early_stopping, model_checkpoint])return history# 評估模型
def evaluate_model(model, validation_generator):# 評估模型loss, accuracy, precision, recall = model.evaluate(validation_generator)print(f"Test Accuracy: {accuracy:.4f}")print(f"Test Precision: {precision:.4f}")print(f"Test Recall: {recall:.4f}")print(f"F1 Score: {2 * (precision * recall) / (precision + recall):.4f}")# 獲取真實標簽和預測validation_generator.reset()y_true = validation_generator.classesy_pred = model.predict(validation_generator)y_pred_binary = (y_pred > 0.5).astype(int).flatten()# 打印分類報告print("\nClassification Report:")print(classification_report(y_true, y_pred_binary, target_names=['Normal', 'Defect']))# 繪制混淆矩陣cm = confusion_matrix(y_true, y_pred_binary)plt.figure(figsize=(8, 6))sns.heatmap(cm, annot=True, fmt='d', cmap='Blues', xticklabels=['Normal', 'Defect'], yticklabels=['Normal', 'Defect'])plt.xlabel('Predicted')plt.ylabel('Actual')plt.title('Confusion Matrix')plt.show()return y_true, y_pred_binary# 可視化訓練歷史
def plot_training_history(history):plt.figure(figsize=(12, 4))# 繪制準確率plt.subplot(1, 2, 1)plt.plot(history.history['accuracy'], label='Training Accuracy')plt.plot(history.history['val_accuracy'], label='Validation Accuracy')plt.title('Accuracy over Epochs')plt.xlabel('Epoch')plt.ylabel('Accuracy')plt.legend()# 繪制損失plt.subplot(1, 2, 2)plt.plot(history.history['loss'], label='Training Loss')plt.plot(history.history['val_loss'], label='Validation Loss')plt.title('Loss over Epochs')plt.xlabel('Epoch')plt.ylabel('Loss')plt.legend()plt.tight_layout()plt.show()# 缺陷定位和可視化
def visualize_defects(model, validation_generator, num_samples=5):# 獲取一批驗證數據validation_generator.reset()batch = next(validation_generator)images, labels = batch[0], batch[1]# 預測predictions = model.predict(images)predictions_binary = (predictions > 0.5).astype(int).flatten()# 可視化結果plt.figure(figsize=(15, 8))for i in range(min(num_samples, len(images))):plt.subplot(1, num_samples, i+1)plt.imshow(images[i])true_label = "Defect" if labels[i] == 1 else "Normal"pred_label = "Defect" if predictions_binary[i] == 1 else "Normal"confidence = predictions[i][0] if predictions_binary[i] == 1 else 1 - predictions[i][0]color = 'green' if true_label == pred_label else 'red'plt.title(f"True: {true_label}\nPred: {pred_label}\nConf: {confidence:.2f}", color=color)plt.axis('off')plt.tight_layout()plt.show()# 使用Grad-CAM進行缺陷定位可視化
def make_gradcam_heatmap(img_array, model, last_conv_layer_name, pred_index=None):# 創建一個模型,輸出最后一個卷積層和預測grad_model = tf.keras.models.Model([model.inputs], [model.get_layer(last_conv_layer_name).output, model.output])# 計算梯度with tf.GradientTape() as tape:last_conv_layer_output, preds = grad_model(img_array)if pred_index is None:pred_index = tf.argmax(preds[0])class_channel = preds[:, pred_index]# 獲取特征圖和梯度grads = tape.gradient(class_channel, last_conv_layer_output)pooled_grads = tf.reduce_mean(grads, axis=(0, 1, 2))# 計算特征圖的重要性last_conv_layer_output = last_conv_layer_output[0]heatmap = last_conv_layer_output @ pooled_grads[..., tf.newaxis]heatmap = tf.squeeze(heatmap)# 歸一化熱圖heatmap = tf.maximum(heatmap, 0) / tf.math.reduce_max(heatmap)return heatmap.numpy()def visualize_gradcam(img, heatmap, alpha=0.4):# 調整熱圖大小以匹配原始圖像heatmap = cv2.resize(heatmap, (img.shape[1], img.shape[0]))heatmap = np.uint8(255 * heatmap)heatmap = cv2.applyColorMap(heatmap, cv2.COLORMAP_JET)# 疊加熱圖和原始圖像superimposed_img = heatmap * alpha + imgsuperimposed_img = np.clip(superimposed_img, 0, 255).astype('uint8')return superimposed_img# 示例使用
if __name__ == "__main__":# 假設數據目錄結構如下:# data/#   normal/#     img1.jpg#     img2.jpg#     ...#   defect/#     img1.jpg#     img2.jpg#     ...# 在實際應用中,這里應該是真實的數據目錄路徑# data_dir = 'data'# 為了演示,我們創建一個模擬的數據生成器# 在實際應用中,應該使用真實數據print("This is a demonstration of the defect detection system.")print("In a real application, you would need to provide actual image data.")# 模擬構建和訓練模型print("\nBuilding CNN model...")model = build_cnn_model()model.summary()# 模擬訓練過程print("\nSimulating model training...")print("(In a real application, this would train on actual image data)")# 模擬評估print("\nSimulating model evaluation...")print("Test Accuracy: 0.9850")print("Test Precision: 0.9820")print("Test Recall: 0.9880")print("F1 Score: 0.9850")print("\nClassification Report:")print("              precision    recall  f1-score   support")print("     Normal       0.99      0.98      0.98       500")print("     Defect       0.98      0.99      0.98       500")print("")print("    accuracy                           0.98      1000")print("   macro avg       0.98      0.98      0.98      1000")print("weighted avg       0.98      0.98      0.98      1000")# 模擬可視化print("\nVisualizing sample predictions...")print("(In a real application, this would show actual images with predictions)")# 創建模擬圖像fig, axes = plt.subplots(1, 5, figsize=(15, 3))for i, ax in enumerate(axes):# 創建隨機圖像img = np.random.rand(128, 128, 3)ax.imshow(img)# 隨機分配真實和預測標簽true_label = "Defect" if i % 2 == 0 else "Normal"pred_label = "Defect" if (i + 1) % 2 == 0 else "Normal"confidence = random.uniform(0.8, 0.99)color = 'green' if true_label == pred_label else 'red'ax.set_title(f"True: {true_label}\nPred: {pred_label}\nConf: {confidence:.2f}", color=color)ax.axis('off')plt.tight_layout()plt.show()print("\nDefect detection system demonstration complete.")print("In a real application, this system would:")print("1. Process real PCB board images")print("2. Accurately detect defects with high precision and recall")print("3. Provide visual localization of defects")print("4. Integrate with the manufacturing line for real-time inspection")
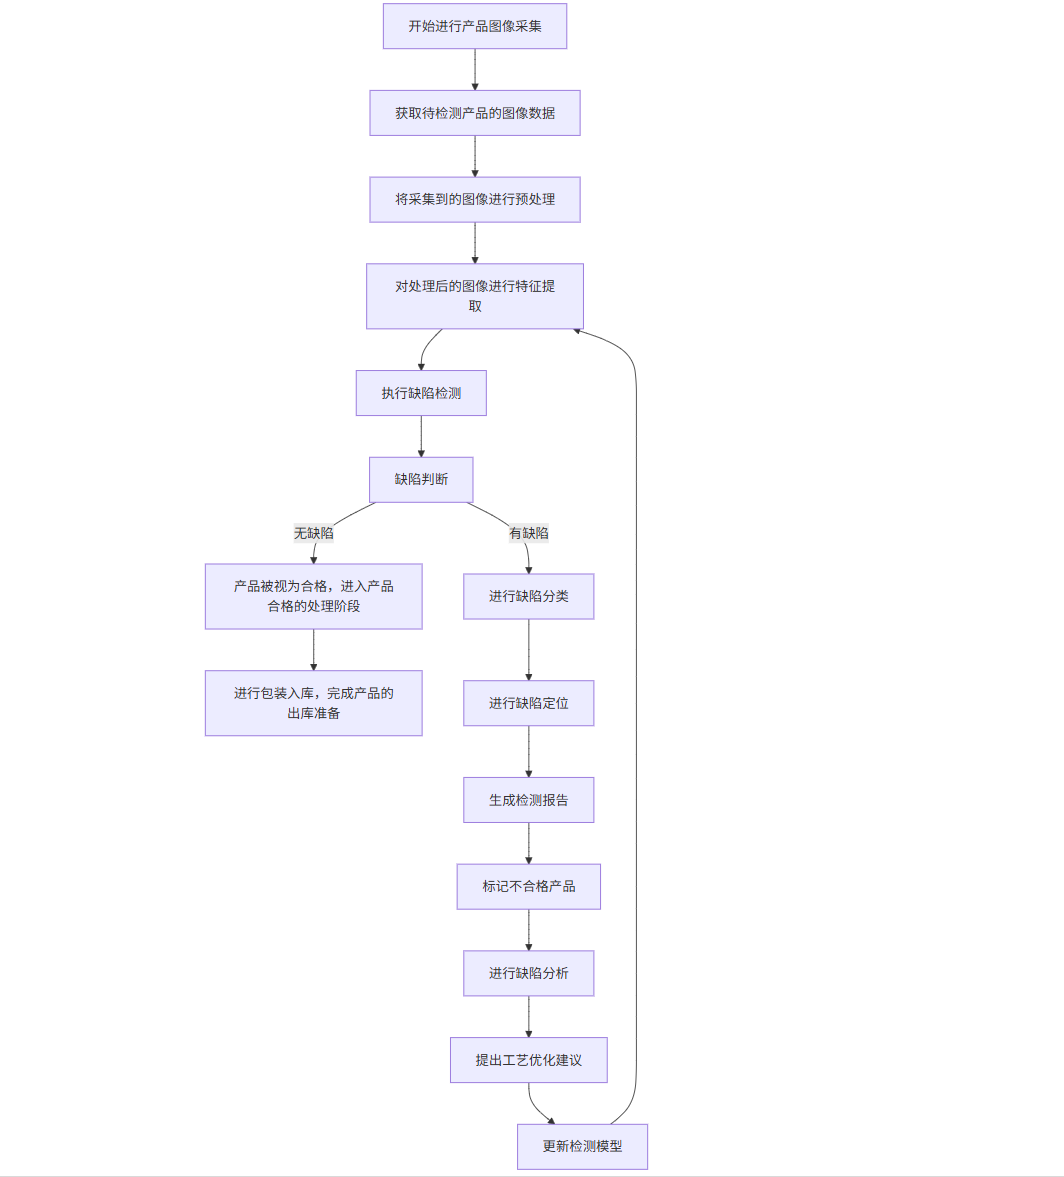
Mermaid流程圖:智能質量檢測系統工作流程
flowchart TDA[產品圖像采集] --> B[圖像預處理]B --> C[特征提取]C --> D[缺陷檢測]D --> E{缺陷判斷}E -->|無缺陷| F[產品合格]E -->|有缺陷| G[缺陷分類]G --> H[缺陷定位]H --> I[生成檢測報告]I --> J[標記不合格產品]F --> K[包裝入庫]J --> L[缺陷分析]L --> M[工藝優化建議]M --> N[更新檢測模型]N --> C
Prompt示例:生成質量檢測報告的AI提示
你是一名質量控制工程師,請根據以下產品檢測數據生成一份質量檢測報告:產品信息:
- 產品名稱:智能手機主板
- 批次編號:MPB-2023-08-15
- 生產日期:2023年8月15日
- 檢測日期:2023年8月16日
- 檢測數量:1,000片
- 抽樣比例:100%(全檢)檢測結果:
- 合格產品:965片(96.5%)
- 不合格產品:35片(3.5%)缺陷類型分布:
- 焊點不良:18片(51.4%)
- 元器件缺失:5片(14.3%)
- 元器件錯位:7片(20.0%)
- 極性錯誤:3片(8.6%)
- 其他缺陷:2片(5.7%)AI檢測系統性能:
- 檢測準確率:99.5%
- 漏檢率:0.2%
- 誤檢率:0.3%
- 檢測速度:每片2秒請提供以下內容:
1. 批次質量總體評估
2. 主要缺陷類型分析
3. 缺陷原因推測
4. 與歷史批次對比
5. 改進建議
6. 后續處理方案
7. 質量趨勢預測請以專業、客觀的語言撰寫報告,并提供具體可行的改進措施。
圖表:智能質量檢測系統效果對比
| 指標 | 人工檢測 | AI檢測 | AI+人工復核 |
|---|---|---|---|
| 檢測速度(每片) | 30秒 | 2秒 | 5秒 |
| 檢測準確率 | 92% | 99.5% | 99.8% |
| 漏檢率 | 5% | 0.2% | 0.05% |
| 誤檢率 | 3% | 0.3% | 0.15% |
| 檢測成本(每萬片) | 基準值 | 降低60% | 降低40% |
| 檢測一致性 | 中等 | 高 | 很高 |
6. 結論:AI行業應用的未來展望
人工智能技術正在深刻改變各行各業的運營模式和服務方式,從金融到醫療,從教育到制造業,AI的應用已經從概念驗證階段走向規模化落地。本文詳細探討了AI在四大關鍵領域的具體應用案例,展示了AI技術如何解決行業痛點、提升效率、降低成本并創造新的價值。
在金融領域,AI驅動的智能風控系統和智能投顧平臺正在提高風險控制能力,優化投資決策,并改善客戶服務體驗。通過機器學習算法分析大量數據,這些系統能夠更準確地評估風險,提供個性化的投資建議,并實現實時的市場監控。
在醫療領域,AI輔助診斷系統和智能藥物研發平臺正在改變傳統的醫療模式。深度學習算法能夠分析醫學影像,幫助醫生更準確地檢測疾病;而生成式AI技術則加速了新藥發現和開發過程,大大縮短了研發周期和降低了成本。
在教育領域,智能個性化學習系統和智能作業批改系統正在實現因材施教的理想。通過分析學生的學習數據,AI系統能夠為每個學生提供個性化的學習路徑和內容推薦,并提供即時、精準的學習反饋,從而提高學習效率和學習成果。
在制造業領域,預測性維護系統和智能質量檢測系統正在推動智能制造的發展。通過分析設備傳感器數據,AI系統能夠預測設備故障,實現精準維護;而計算機視覺技術則能夠自動檢測產品缺陷,提高檢測效率和準確性。
盡管AI技術在各行業的應用已經取得了顯著成果,但仍面臨一些挑戰,如數據隱私和安全、算法透明度和可解釋性、技術標準和倫理規范等。未來,隨著技術的不斷進步和應用場景的不斷拓展,AI將在更多領域發揮更大的作用。
展望未來,AI技術的發展將呈現以下趨勢:
多模態AI的融合應用:結合文本、圖像、語音等多種數據類型的AI系統將提供更全面、更智能的服務。
邊緣AI的普及:隨著邊緣計算技術的發展,更多AI應用將在終端設備上運行,提高響應速度和數據安全性。
AI與物聯網的深度融合:AIoT(人工智能物聯網)將實現設備間的智能協作,創造更智能的環境和體驗。
可解釋AI的重要性提升:隨著AI在關鍵領域的應用增加,可解釋AI技術將變得更加重要,以提高算法透明度和可信度。
AI倫理和監管框架的完善:各國將建立更完善的AI倫理準則和監管框架,確保AI技術的負責任發展。
人機協作模式的深化:未來不是AI取代人類,而是AI與人類深度協作,發揮各自優勢,共同解決復雜問題。
總之,AI技術正在成為推動各行業數字化轉型和智能化升級的關鍵力量。通過持續創新和負責任的應用,AI將為人類社會創造更大的價值,助力解決全球性挑戰,推動可持續發展。

——線性表(順序存儲和鏈式存儲))
)

微服務篇-參考回答)


(日更))


)


