官方參考:Examples - Apache ECharts
1、創建工程
npm create vite@latest或
npm init vue@latest設置如下?
2、下載依賴集運行項目
cd vue-echarts-demo
npm install
npm install echarts
npm run dev
3、編寫核心代碼
創建src\components\BarView.vue文件,內容如下:
<template><!-- 圖表容器:設置寬度和高度 --><div ref="chartRef" style="width: 1000px; height: 400px;"></div>
</template><script setup>
// 引入 Vue 的 Composition API
import { ref, onMounted, onBeforeUnmount } from 'vue'
// 引入 echarts 庫
import * as echarts from 'echarts'// 獲取 DOM 元素的引用(用于初始化圖表)
const chartRef = ref(null)
// 存儲 ECharts 實例
let chartInstance = null// 初始化圖表的方法
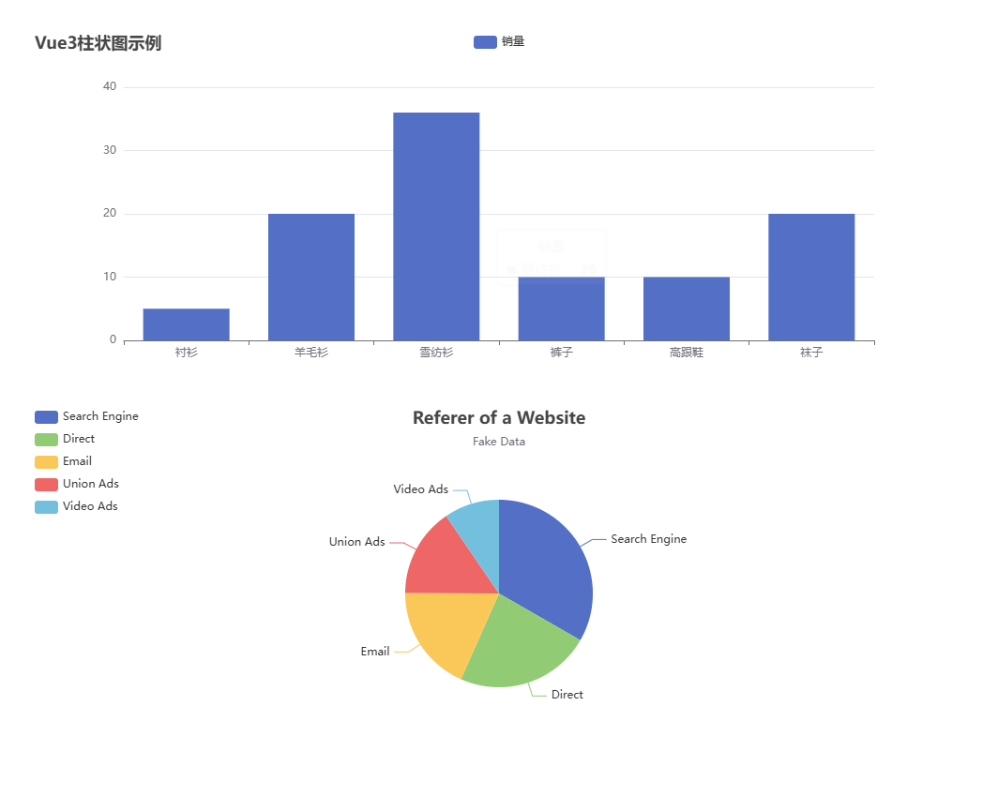
const initChart = () => {if (chartRef.value) {// 初始化 echarts 實例chartInstance = echarts.init(chartRef.value)// 配置項const option = {title: {text: 'Vue3柱狀圖示例' // 圖表標題},tooltip: {}, // 默認提示框配置legend: {data: ['銷量'] // 圖例名稱},xAxis: {data: ['襯衫', '羊毛衫', '雪紡衫', '褲子', '高跟鞋', '襪子'] // X 軸數據},yAxis: {}, // Y 軸默認配置series: [{name: '銷量', // 系列名稱type: 'bar', // 圖表類型為柱狀圖data: [5, 20, 36, 10, 10, 20] // 數據值}]}// 使用配置項渲染圖表chartInstance.setOption(option)}
}// 窗口大小變化時調整圖表尺寸
const resizeChart = () => {chartInstance?.resize()
}// 組件掛載后執行初始化
onMounted(() => {initChart()// 監聽窗口大小變化事件以支持響應式window.addEventListener('resize', resizeChart)
})// 組件卸載前清理資源,防止內存泄漏
onBeforeUnmount(() => {window.removeEventListener('resize', resizeChart)chartInstance?.dispose() // 銷毀 echarts 實例
})
</script>編寫src\components\PieView.vue代碼
<template><!-- 圖表容器:設置寬度和高度 --><div ref="chartRef" style="width: 1000px; height: 400px;"></div>
</template><script setup>
// 引入 Vue 的 Composition API
import { ref, onMounted, onBeforeUnmount } from 'vue'
// 引入 echarts 庫
import * as echarts from 'echarts'// 獲取 DOM 元素的引用(用于初始化圖表)
const chartRef = ref(null)
// 存儲 ECharts 實例
let chartInstance = null// 初始化圖表的方法
const initChart = () => {if (chartRef.value) {// 初始化 echarts 實例chartInstance = echarts.init(chartRef.value)// 配置項
var option;option = {title: {text: 'Referer of a Website',subtext: 'Fake Data',left: 'center'},tooltip: {trigger: 'item'},legend: {orient: 'vertical',left: 'left'},series: [{name: 'Access From',type: 'pie',radius: '50%',data: [{ value: 1048, name: 'Search Engine' },{ value: 735, name: 'Direct' },{ value: 580, name: 'Email' },{ value: 484, name: 'Union Ads' },{ value: 300, name: 'Video Ads' }],emphasis: {itemStyle: {shadowBlur: 10,shadowOffsetX: 0,shadowColor: 'rgba(0, 0, 0, 0.5)'}}}]
};// 使用配置項渲染圖表chartInstance.setOption(option)}
}// 窗口大小變化時調整圖表尺寸
const resizeChart = () => {chartInstance?.resize()
}// 組件掛載后執行初始化
onMounted(() => {initChart()// 監聽窗口大小變化事件以支持響應式window.addEventListener('resize', resizeChart)
})// 組件卸載前清理資源,防止內存泄漏
onBeforeUnmount(() => {window.removeEventListener('resize', resizeChart)chartInstance?.dispose() // 銷毀 echarts 實例
})
</script>
4、修改App代碼
src\App.vue內容修改如下
<script setup>
import BarView from './components/BarView.vue';
import PieView from './components/PieView.vue';
</script><template><BarView /><PieView></PieView>
</template><style scoped>
.logo {height: 6em;padding: 1.5em;will-change: filter;transition: filter 300ms;
}
.logo:hover {filter: drop-shadow(0 0 2em #646cffaa);
}
.logo.vue:hover {filter: drop-shadow(0 0 2em #42b883aa);
}
</style>
5、查看結果?
瀏覽器輸入:http://localhost:5173/?
參考資料:
Vue 3 搭配 ECharts:實現復雜數據圖表展示_vue3 echarts-CSDN博客
Vue 3 搭配 ECharts:實現復雜數據圖表展示_vue3 echarts-CSDN博客
極致呈現系列之:Vue3中使用Echarts圖表初體驗-騰訊云開發者社區-騰訊云
https://juejin.cn/post/7493433637830148106
https://www.51cto.com/article/803996.html
https://zhuanlan.zhihu.com/p/1910642270039942543
前端必學!全面解讀 Tailwind CSS配置與使用Tailwind CSS,前端開發提效神器。從配置到實戰,全面解讀 - 掘金


)


)


)