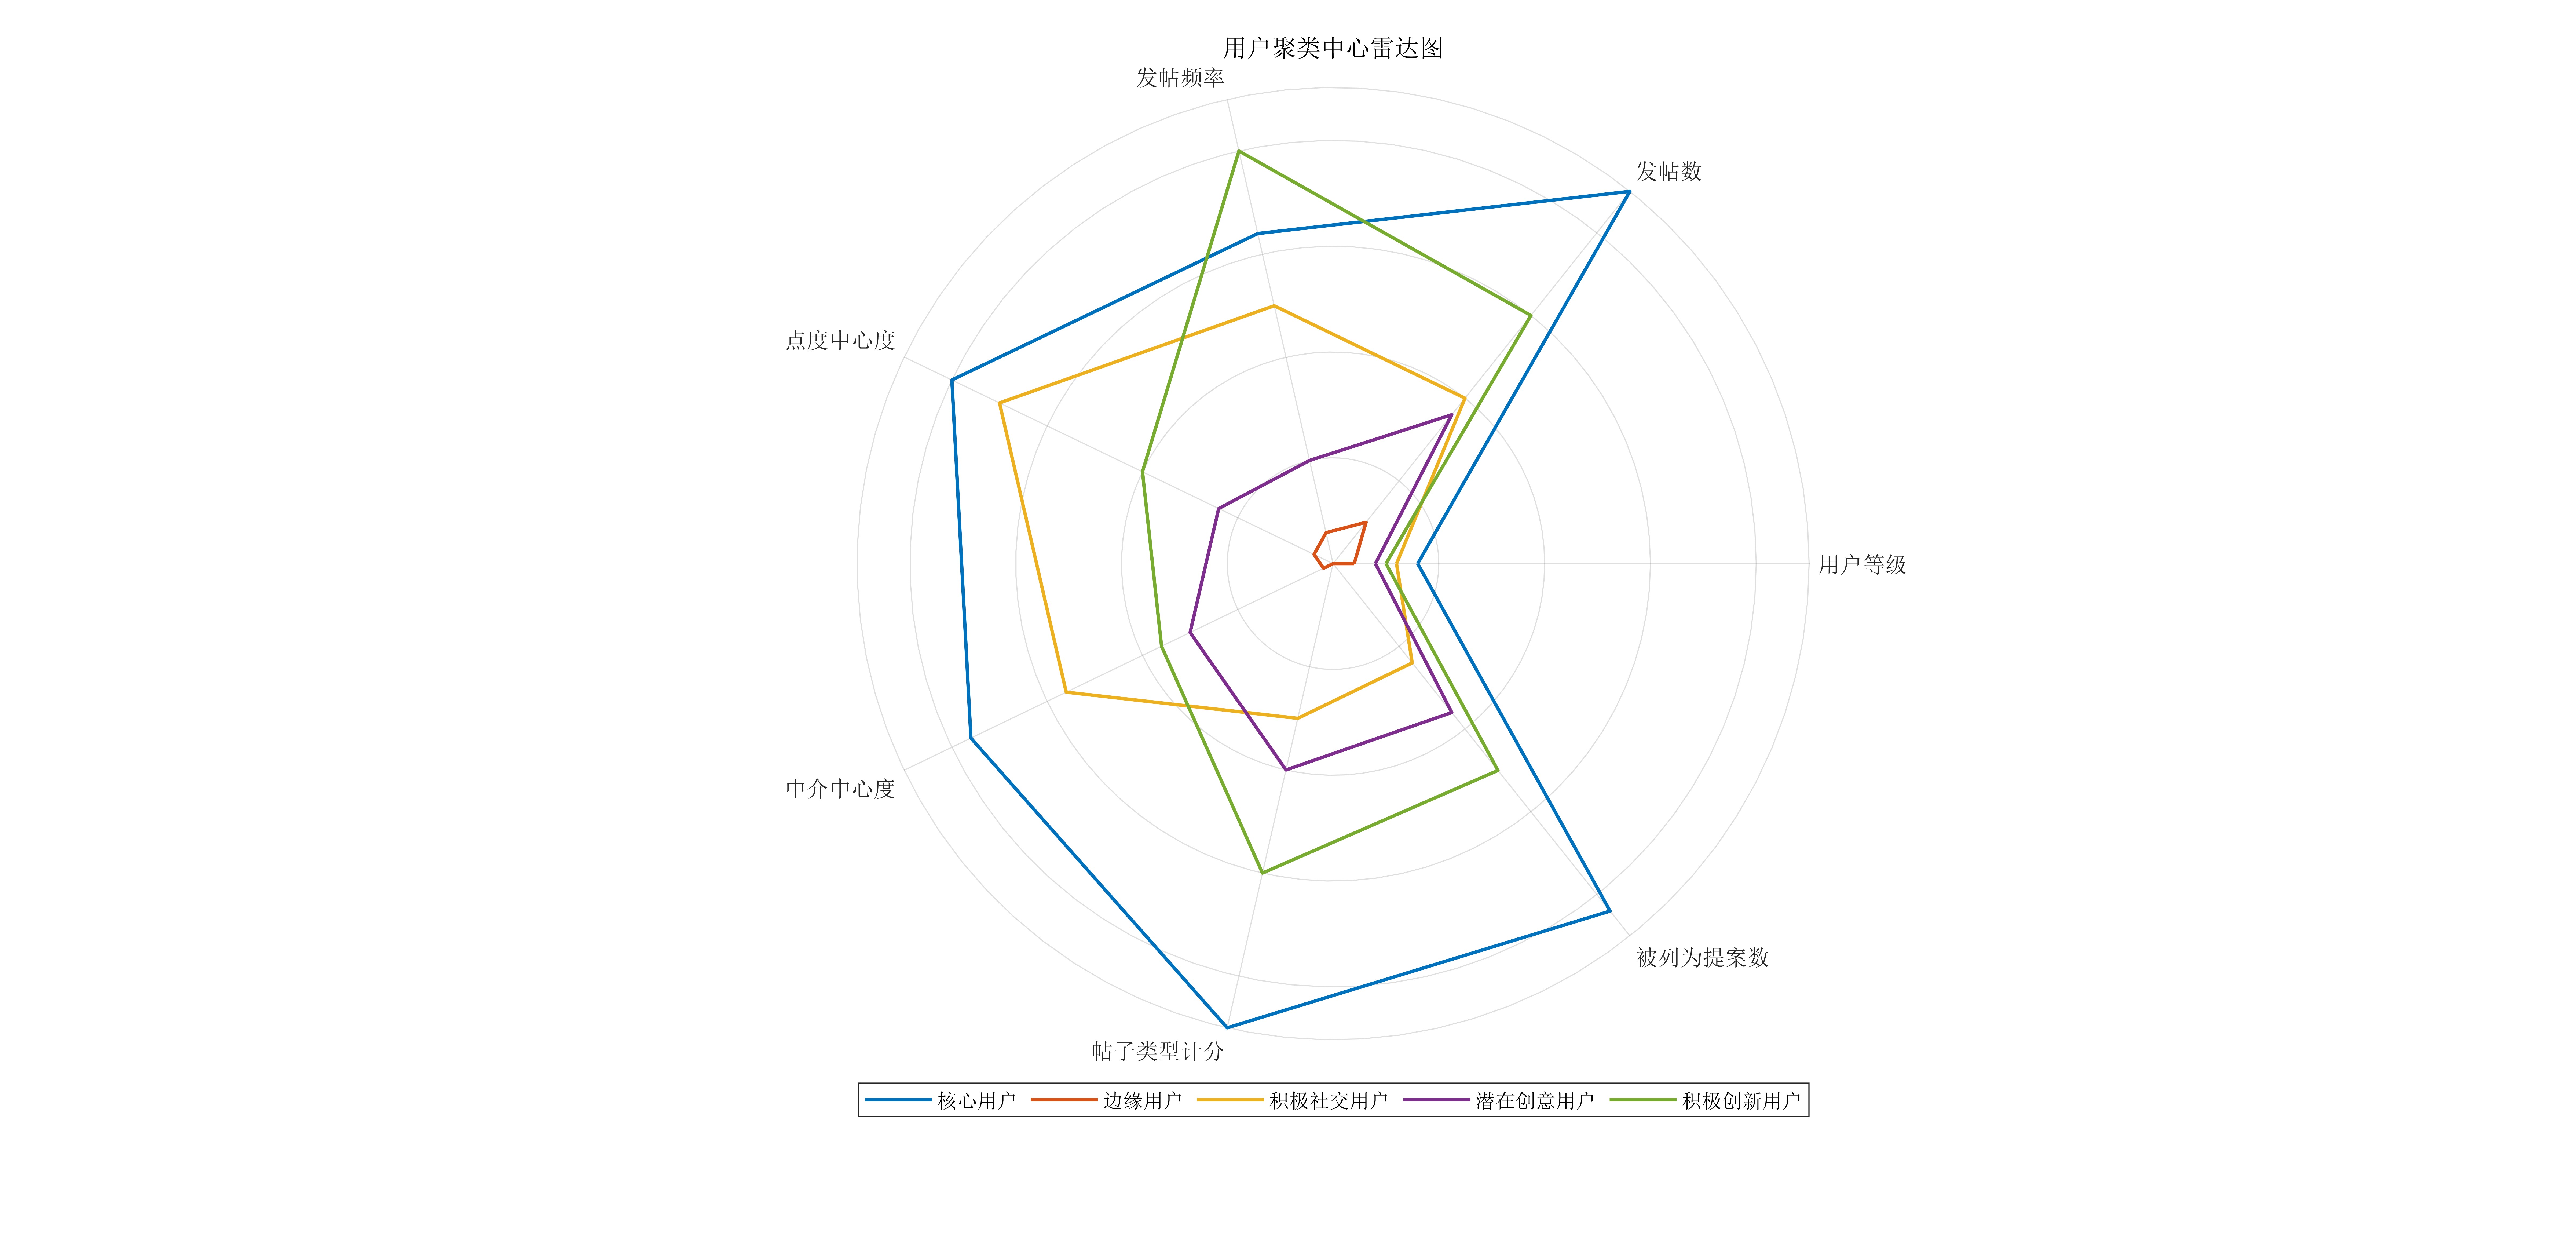
看下別人做出來什么效果

話不多說,咱們直接開始
%% 可修改
labels = {'用戶等級', '發帖數', '發帖頻率', '點度中心度', '中介中心度', '帖子類型計分', '被列為提案數'};
cluster_centers = [0.8, 4.5, 3.2, 4.0, 3.8, 4.5, 4.2;   % 核心用戶0.2, 0.5, 0.3, 0.2, 0.1, 0.0, 0.0;   % 邊緣用戶0.6, 2.0, 2.5, 3.5, 2.8, 1.5, 1.2;   % 積極社交用戶0.4, 1.8, 1.0, 1.2, 1.5, 2.0, 1.8;   % 潛在創意用戶0.5, 3.0, 4.0, 2.0, 1.8, 3.0, 2.5];  % 積極創新用戶%%
% 確保雷達圖閉合:首尾數據點重復
cluster_centers = [cluster_centers, cluster_centers(:,1)]; % 添加第一列到末尾
labels = [labels, labels(1)];                              % 標簽同步擴展% 計算角度(0到2π均勻分布)
angles = linspace(0, 2*pi, length(labels));
angles(end) = angles(1); % 確保閉合% 繪制雷達圖
figure;
polarplot(angles, cluster_centers(1,:), 'LineWidth', 1.5, 'DisplayName', '核心用戶');
hold on;
polarplot(angles, cluster_centers(2,:), 'LineWidth', 1.5, 'DisplayName', '邊緣用戶');
polarplot(angles, cluster_centers(3,:), 'LineWidth', 1.5, 'DisplayName', '積極社交用戶');
polarplot(angles, cluster_centers(4,:), 'LineWidth', 1.5, 'DisplayName', '潛在創意用戶');
polarplot(angles, cluster_centers(5,:), 'LineWidth', 1.5, 'DisplayName', '積極創新用戶');% 添加極坐標標簽和標題
title('用戶聚類中心雷達圖');
legend('Location', 'southoutside', 'Orientation', 'horizontal'); % 圖例位置% 添加方向標簽(調整文本位置)
ax = gca;
ax.ThetaTick = rad2deg(angles(1:end-1));        % 角度刻度(排除閉合點)
ax.ThetaTickLabel = labels(1:end-1);            % 標簽名稱
ax.RTickLabel = [];                             % 隱藏半徑刻度數值
ax.FontSize = 10;for i = 1:length(labels)-1text(angles(i), labels{i}, 'HorizontalAlignment', 'center', 'FontSize', 10);
end
可能會有一個報錯信息,咱們不用管他
看下效果

完美,Over!


)
概述)
STOMP: Stochastic Trajectory Optimization for Motion Planning)
 -RGBLED控制、定時器輸入捕獲、主從定時器移相控制-STM32CubeMX)


