主要為了解決監控大量端口,避免繁瑣的重復操作監控項和觸發器
諸位~ 僅供參考哈
自動發現監控參考地址:
https://blog.csdn.net/qq_37510195/article/details/130893655
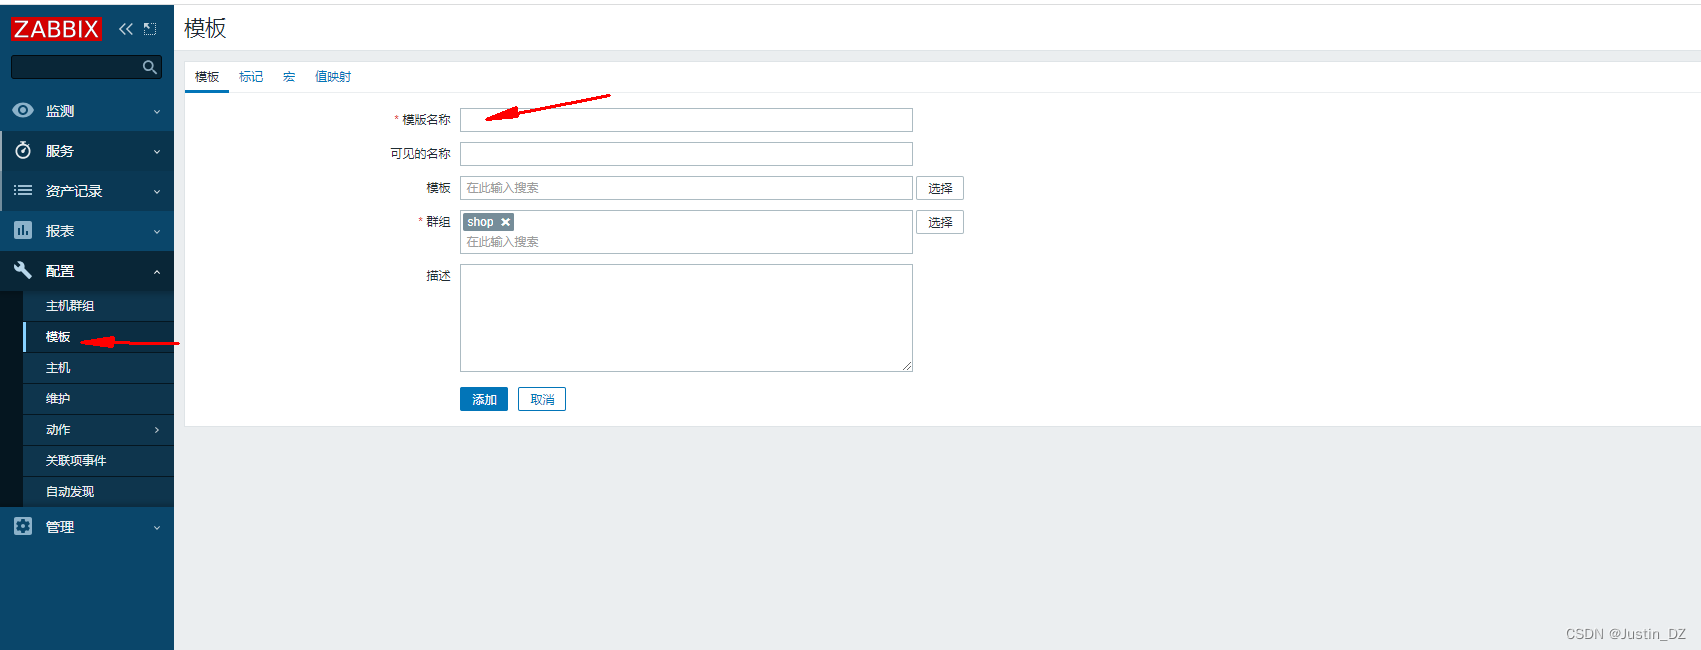
模板
- 首先創建一個模板
自定義名稱和群組
- 創建自動發現規則
模板——自動發現——創建發現規則
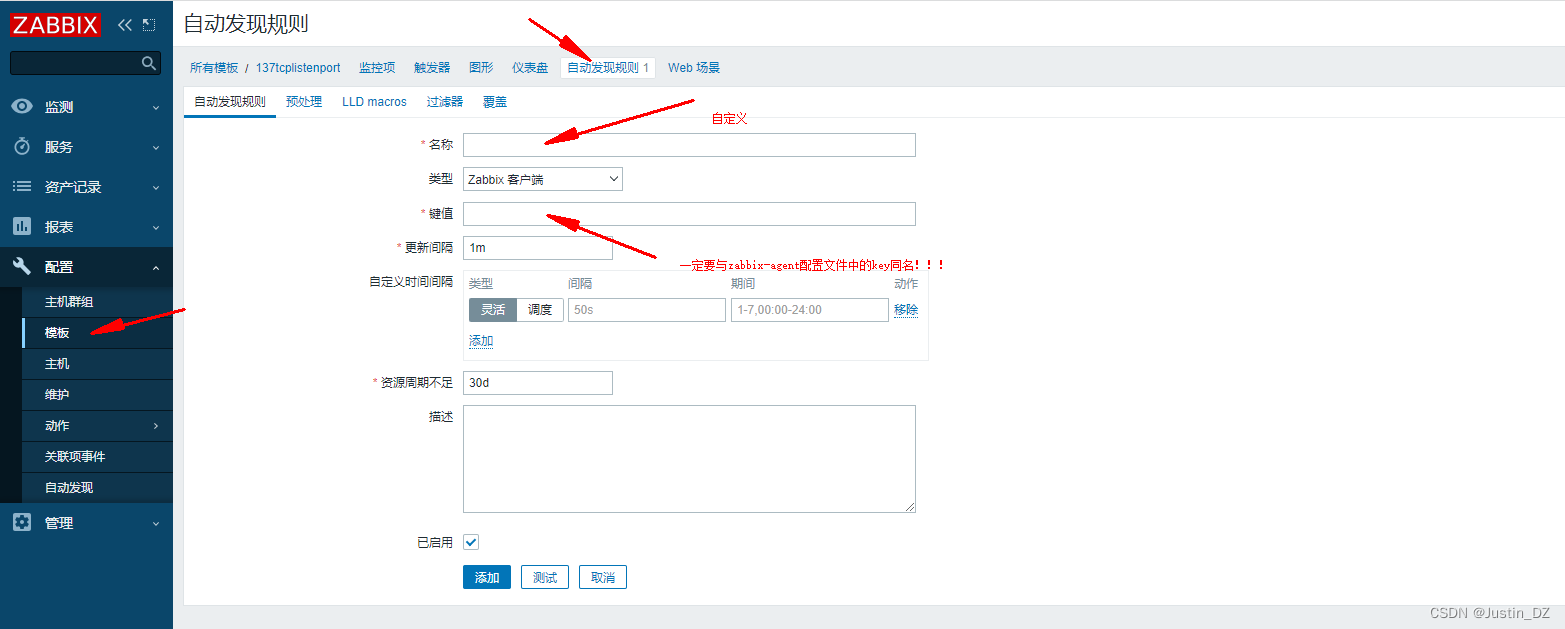
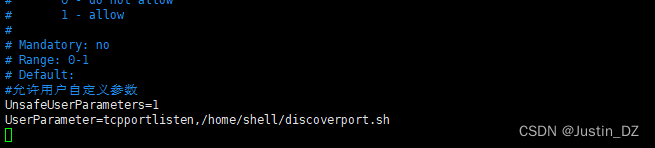
- zabbix-agent配置文件
UnsafeUserParameters=1
UserParameter=tcpportlisten,/home/shell/discoverport.sh(key)         (腳本地址,zabbix必須有執行權限)
4. linux腳本參考(僅供參考)
創建一個discoverport.sh文件
#!/bin/bash
portarray=(`sudo netstat -tnlp|egrep -i "java|nginx|mysql|minio"|awk {'print $4'}|awk -F':' '{if ($NF~/^[0-9]*$/) print $NF}'`)
servicename=(`sudo netstat -tnlp|egrep -i "java|nginx|mysql|minio"|awk {'print $7'}|awk -F'/' '{print $NF}'|sed 's/:$//'`)# 定義端口和服務名稱的映射關系 鍵值對
declare -A service_map=([8761]="eureka-server"[9000]="gateway-server"[10001]="core-server"[10002]="device-server"[10003]="media-server"[10004]="visitor-server"[10005]="system-monitor-server"[10777]="parking-server"
)
length=${#portarray[@]} #輸出有多少個
printf "{\n"
printf  '\t'"\"data\":["
for ((i=0;i<$length;i++))
doprintf '\n\t\t{'if [  -n "${service_map[${portarray[$i]}]}" ];thenprintf "\"{#TCP_PORT}\":\"${portarray[$i]}\", \"{#TCP_NAME}\":\"${service_map[${portarray[$i]}]}\"}"elseprintf "\"{#TCP_PORT}\":\"${portarray[$i]}\", \"{#TCP_NAME}\":\"${servicename[$i]}\"}"fiif [ $i -lt $[$length-1] ]; thenprintf ','fi
done
printf  "\n\t]\n"
printf "}\n"- Windows的參考這個腳本
創建一個discoverport.bat文件
@echo off
setlocal EnableDelayedExpansion
set "output={"data":["for /f "tokens=2 delims= " %%a in ('netstat -ano ^| findstr "LISTENING" ^| findstr ":3306 :8182 :8180 :15672 :5672 :6379"') do (for /f "tokens=1* delims=:" %%b in ("%%a") do (for %%d in (%%c) do (set "value=%%~d"set "output=!output!{"{#TCP_PORT}":"!value:]:=!"},"))
)rem Remove the trailing comma from the last object
set "output=!output:~0,-2!}]}"
echo !output!!#pause #這個要停留端口驗證在用,平時注釋掉
主機綁定模板
進入主機,選擇要綁定的模板
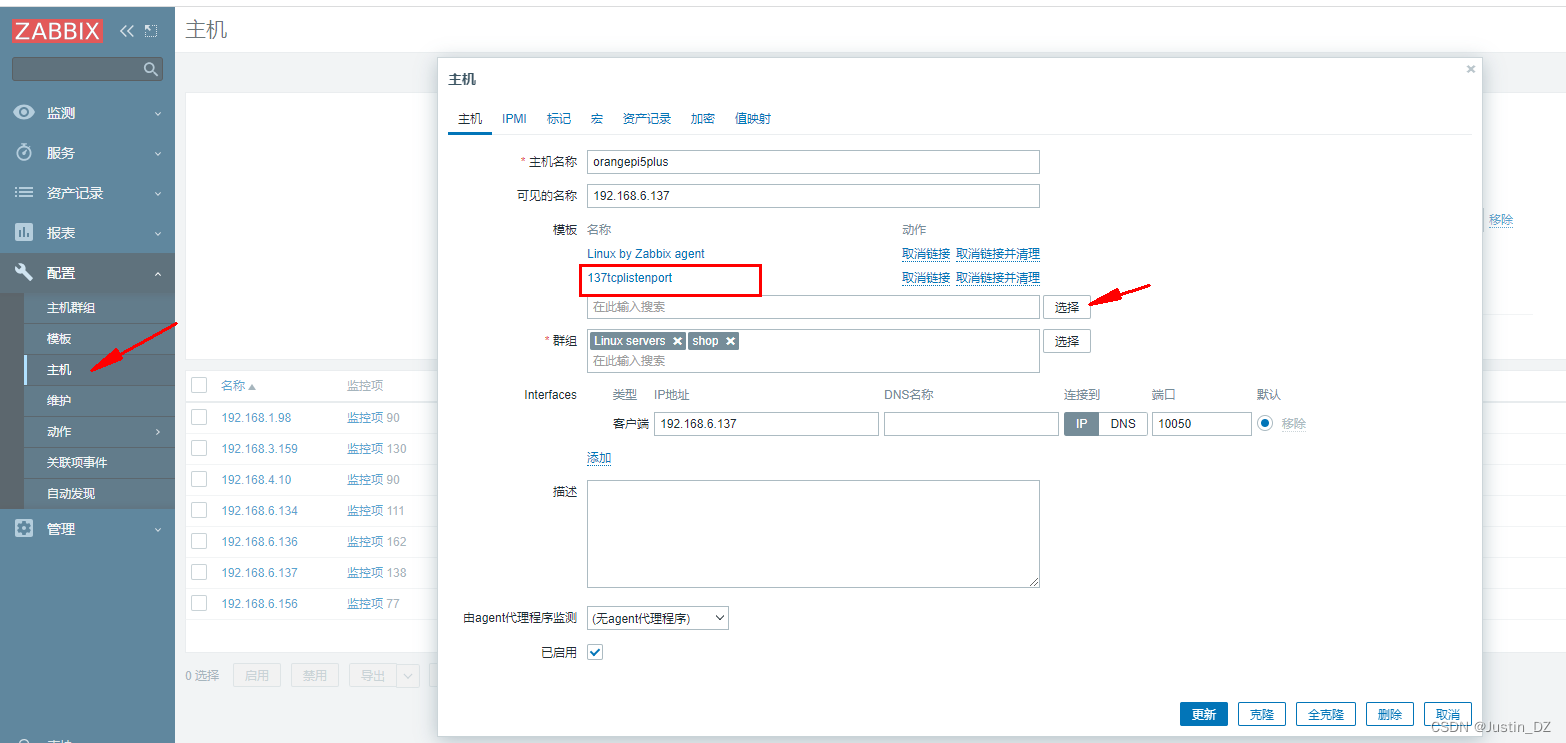
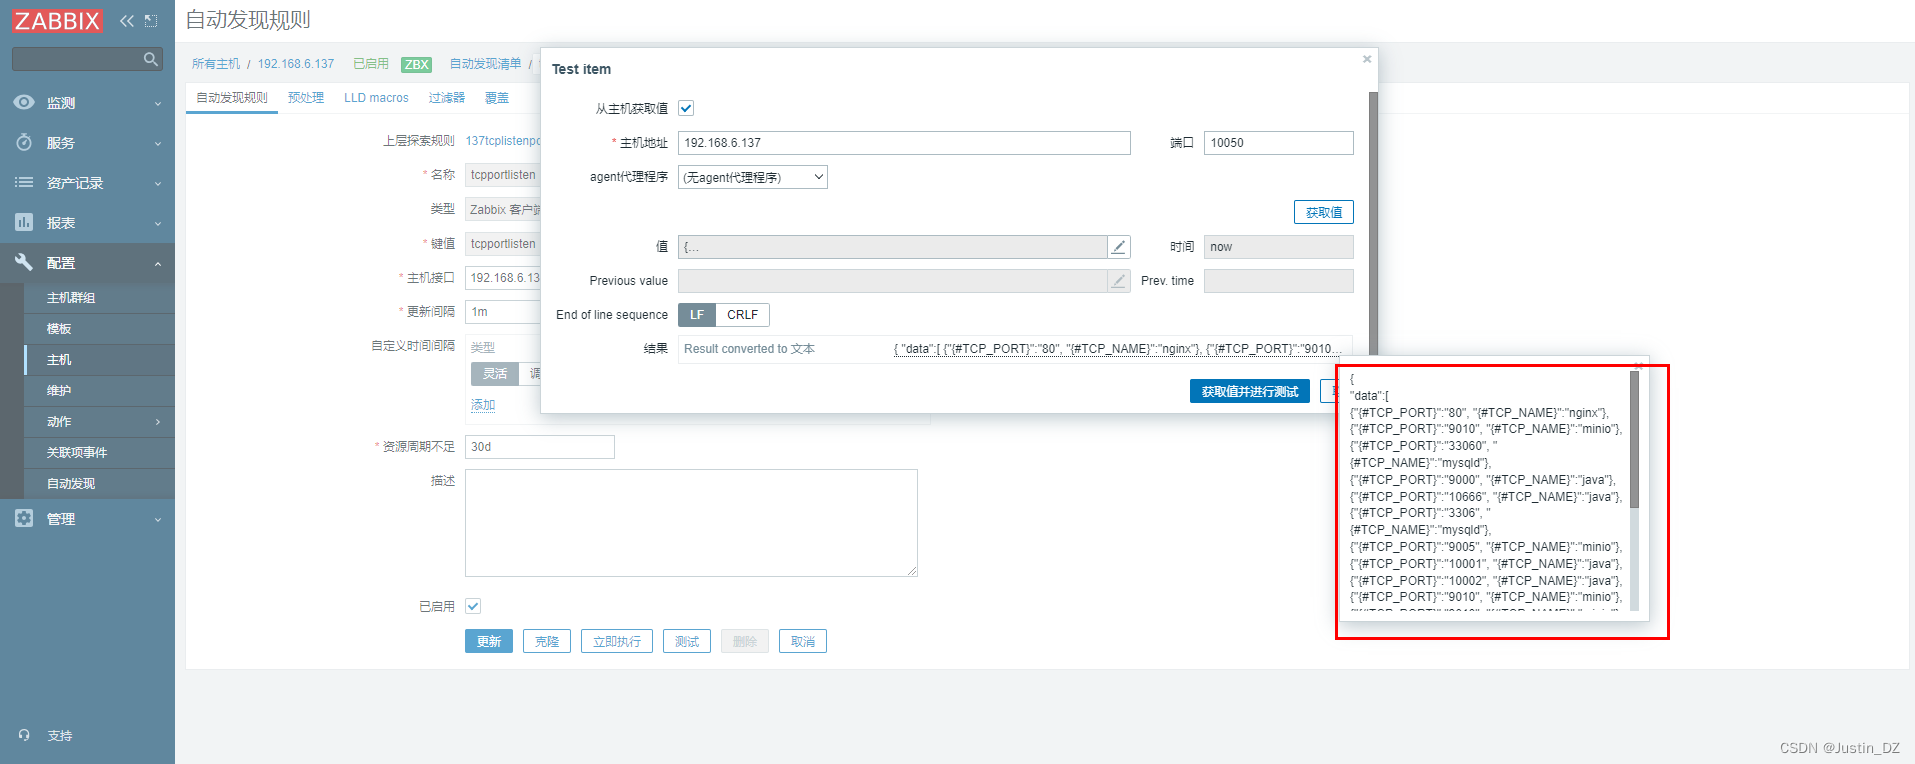
進入主機的自動發現,找到加入的自動發現規則,雙擊自動發現后進行測試
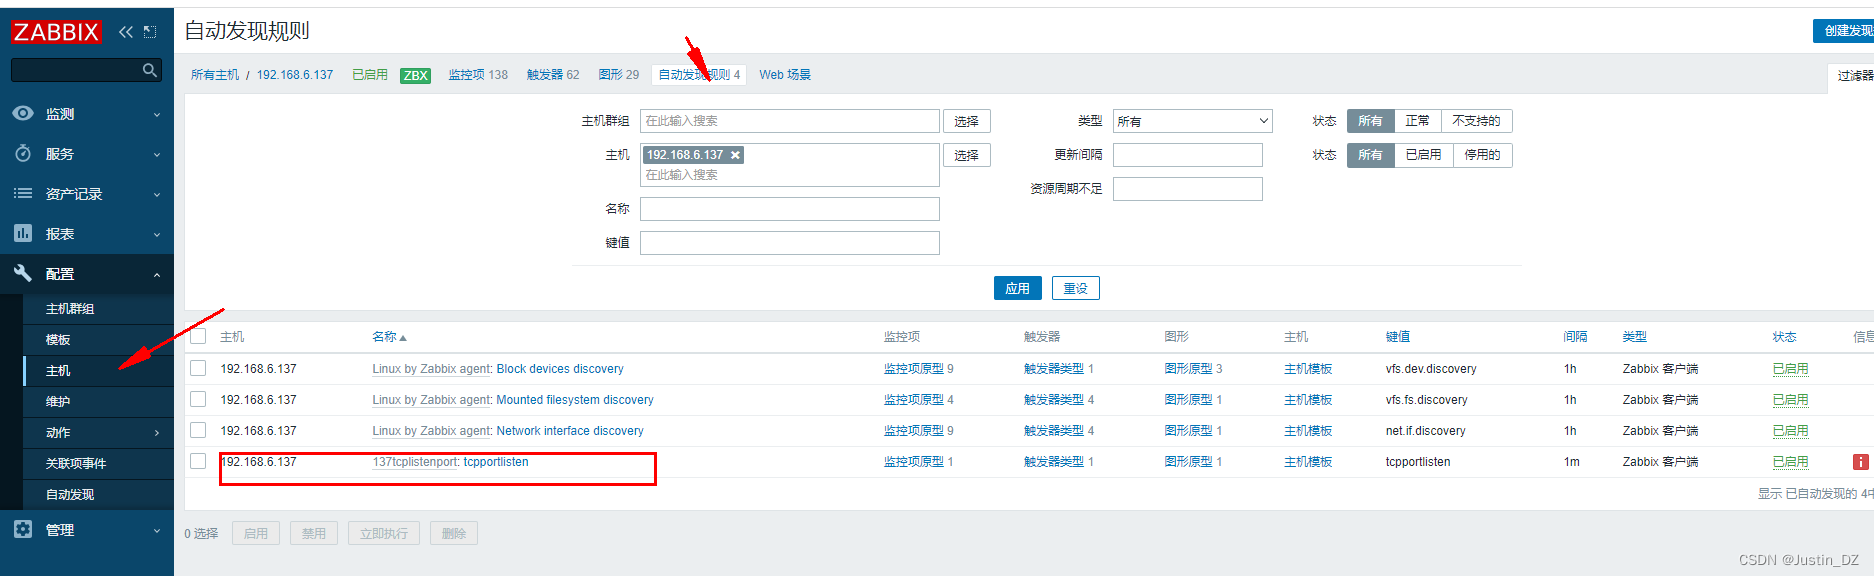
這里,確保測試有數據產生!
注意:如果出現訪問腳本超時,或者無權限執行腳本的類似文件:如
sudo: a terminal is required to read the password; either use the -S option to read from standard input or configure an askpass helper
sudo: a terminal is required to read the password; either use the -S option to read from standard input or configure an askpass helper
{
"data":[
]
}
解決方法:
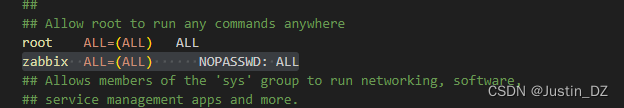
需要把zabbix用戶加入到sudo中,然后再執行測試自動發現就正常了
修改文件/etc/sudoers
加入:zabbix ALL=(ALL) NOPASSWD: ALL
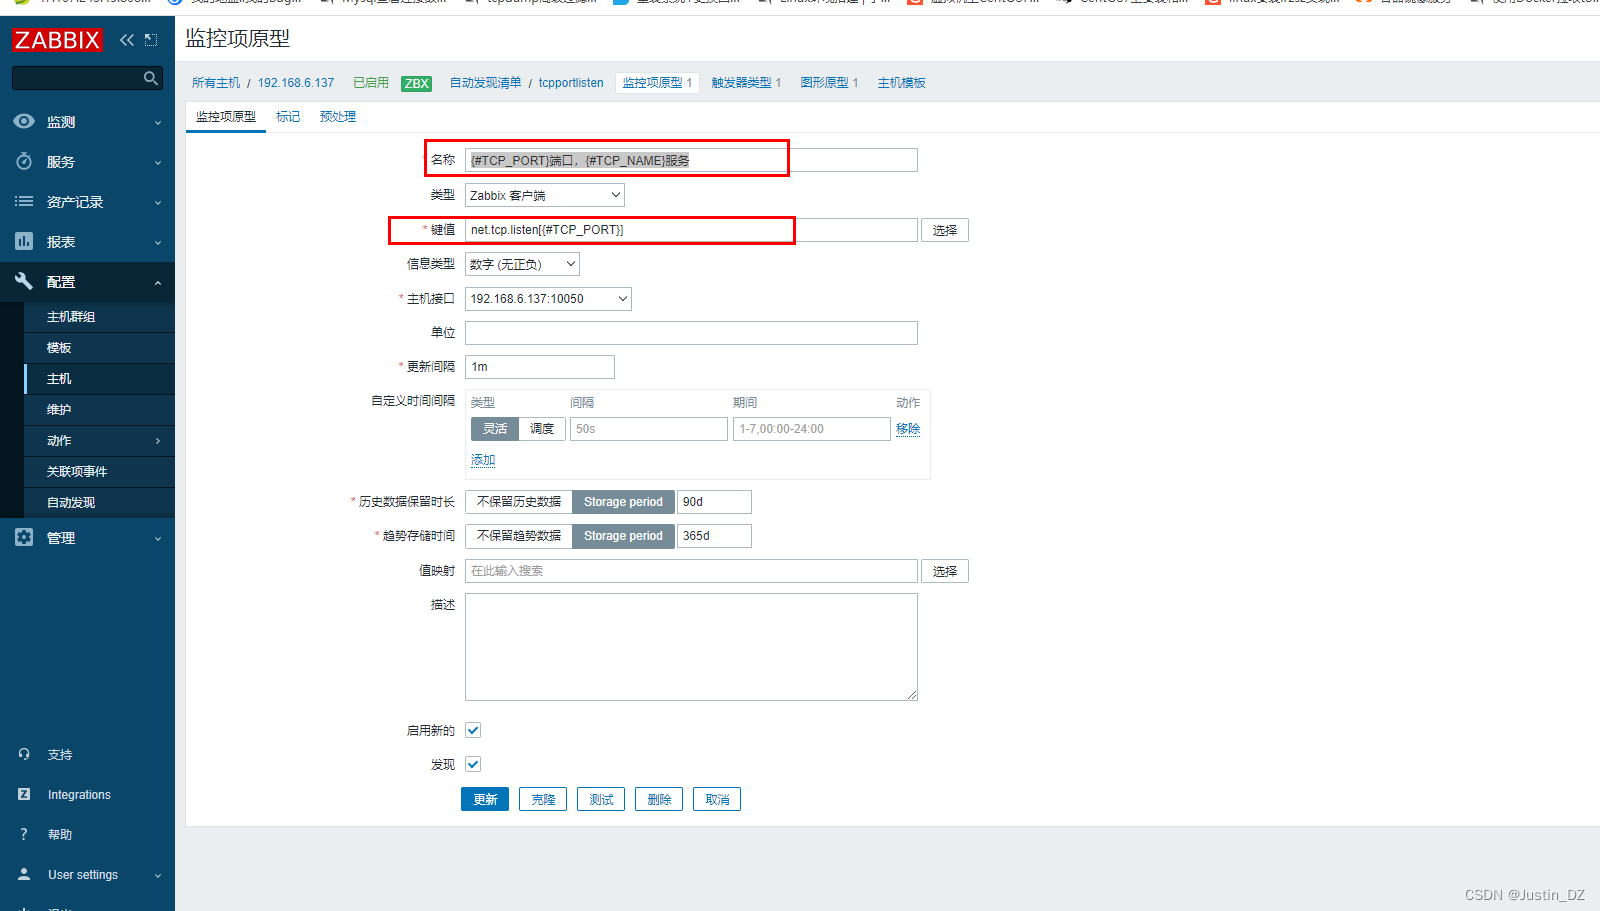
創建監控項目
注意:這里是自動發現里面的監控項,非主機下的監控項
這里就可以通過腳本獲取到的JSON數據,實現變量方式傳值了,極大地避免了人工手動監控多個服務的情況。
監控{#TCP_PORT}端口,{#TCP_NAME}服務
創建觸發器
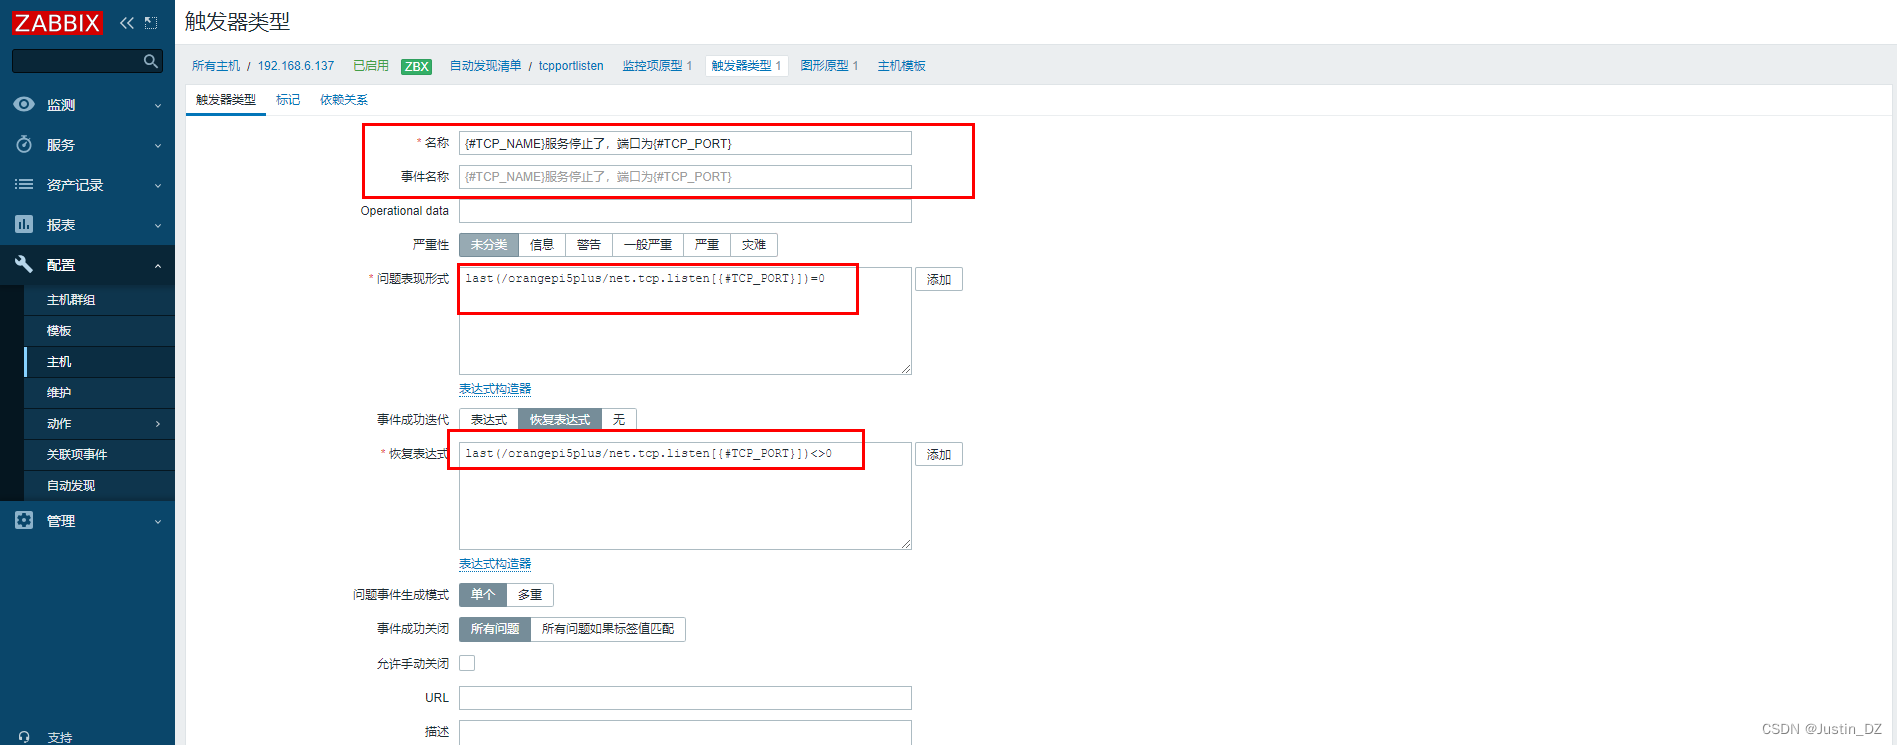
{#TCP_NAME}服務停止了,端口為{#TCP_PORT}
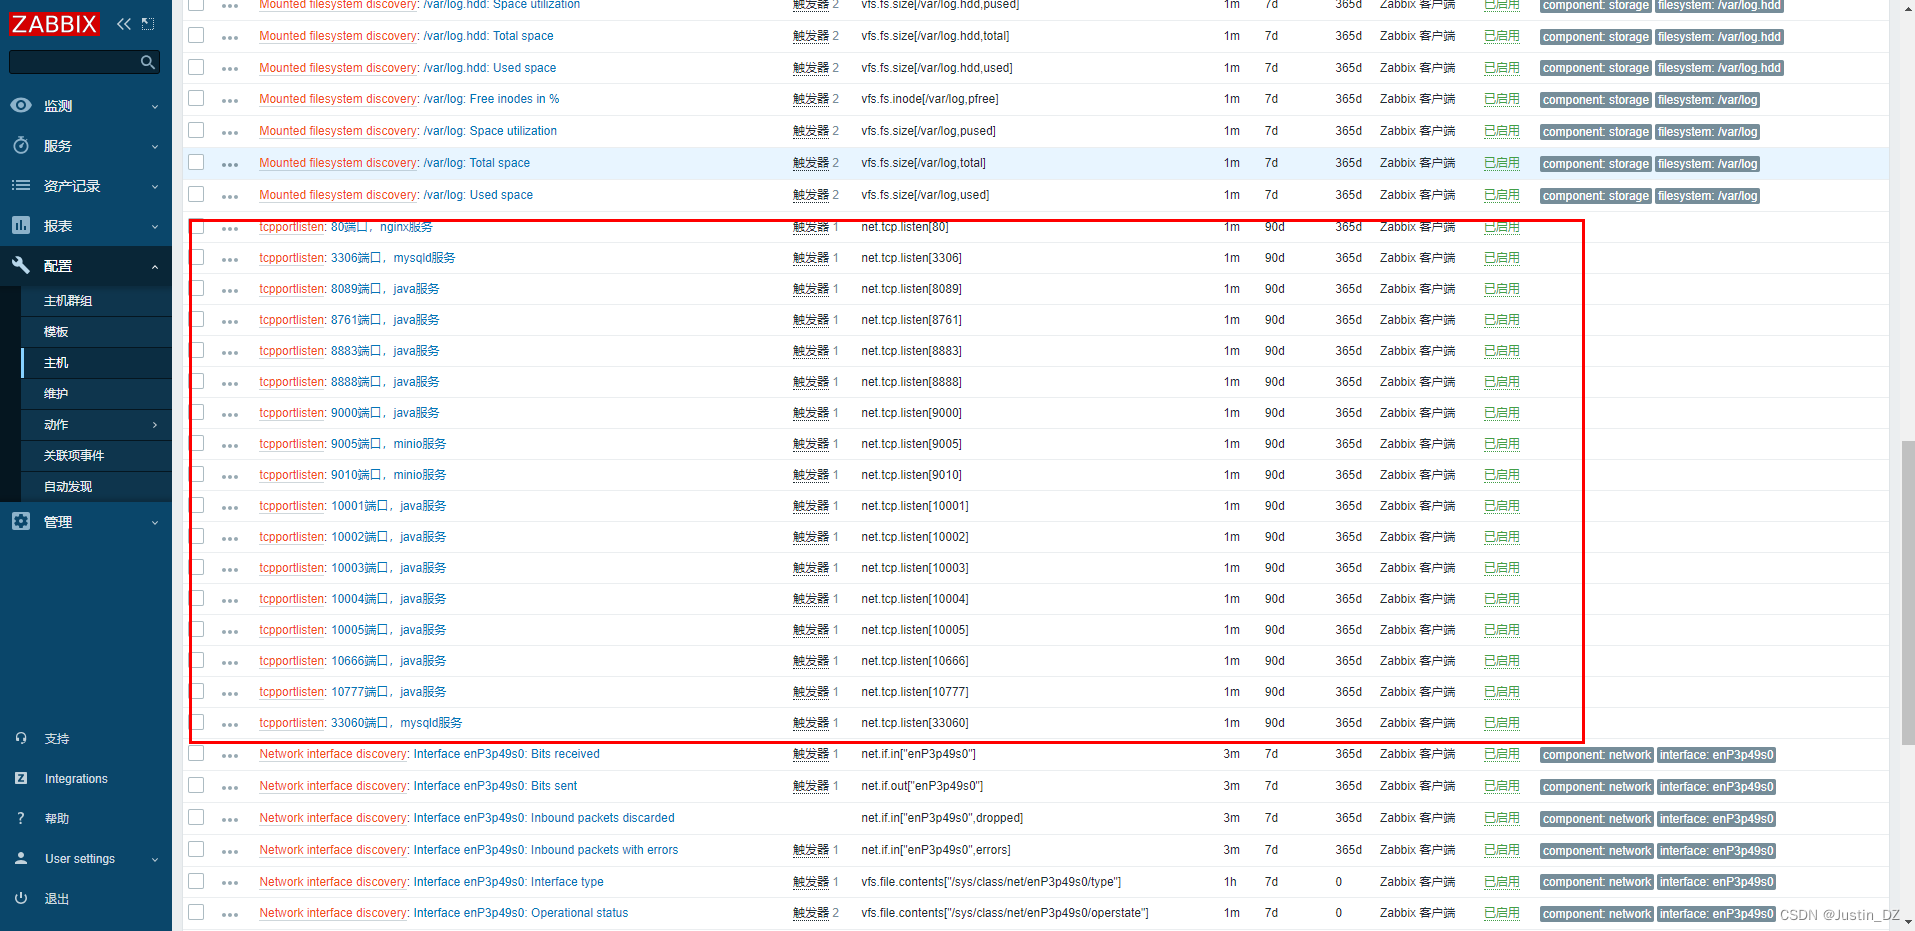
驗證主機中生成的監控項和觸發器:
主機的監控項:
主機的觸發器:


)


)


試題速瀏、分類及淺析)


