D3.js是一個用于數據可視化的JavaScript庫,廣泛應用于Web端的數據交互式圖形展示
中文文檔:入門 | D3 中文網
一、D3.js核心特點
1、核心思想
將數據綁定到DOM元素,通過數據動態生成/修改可視化圖形。
2、應用場景
- 交互式圖表:如動態條形圖、散點圖、桑基圖等。
- 地理信息可視化:通過地理投影(如墨卡托投影)繪制地圖。
- 實時數據展示:如股票行情、監控儀表盤。
- 復雜網絡圖:力導向布局可直觀展示社交網絡或拓撲關系。
二、首先要弄明白“力導向圖布局”
力導向圖布局(各節點之間有力,正值表示斥力、負值表示吸引力)
官網實例:力導向圖 / D3 |觀察 — Force-directed graph / D3 | Observable
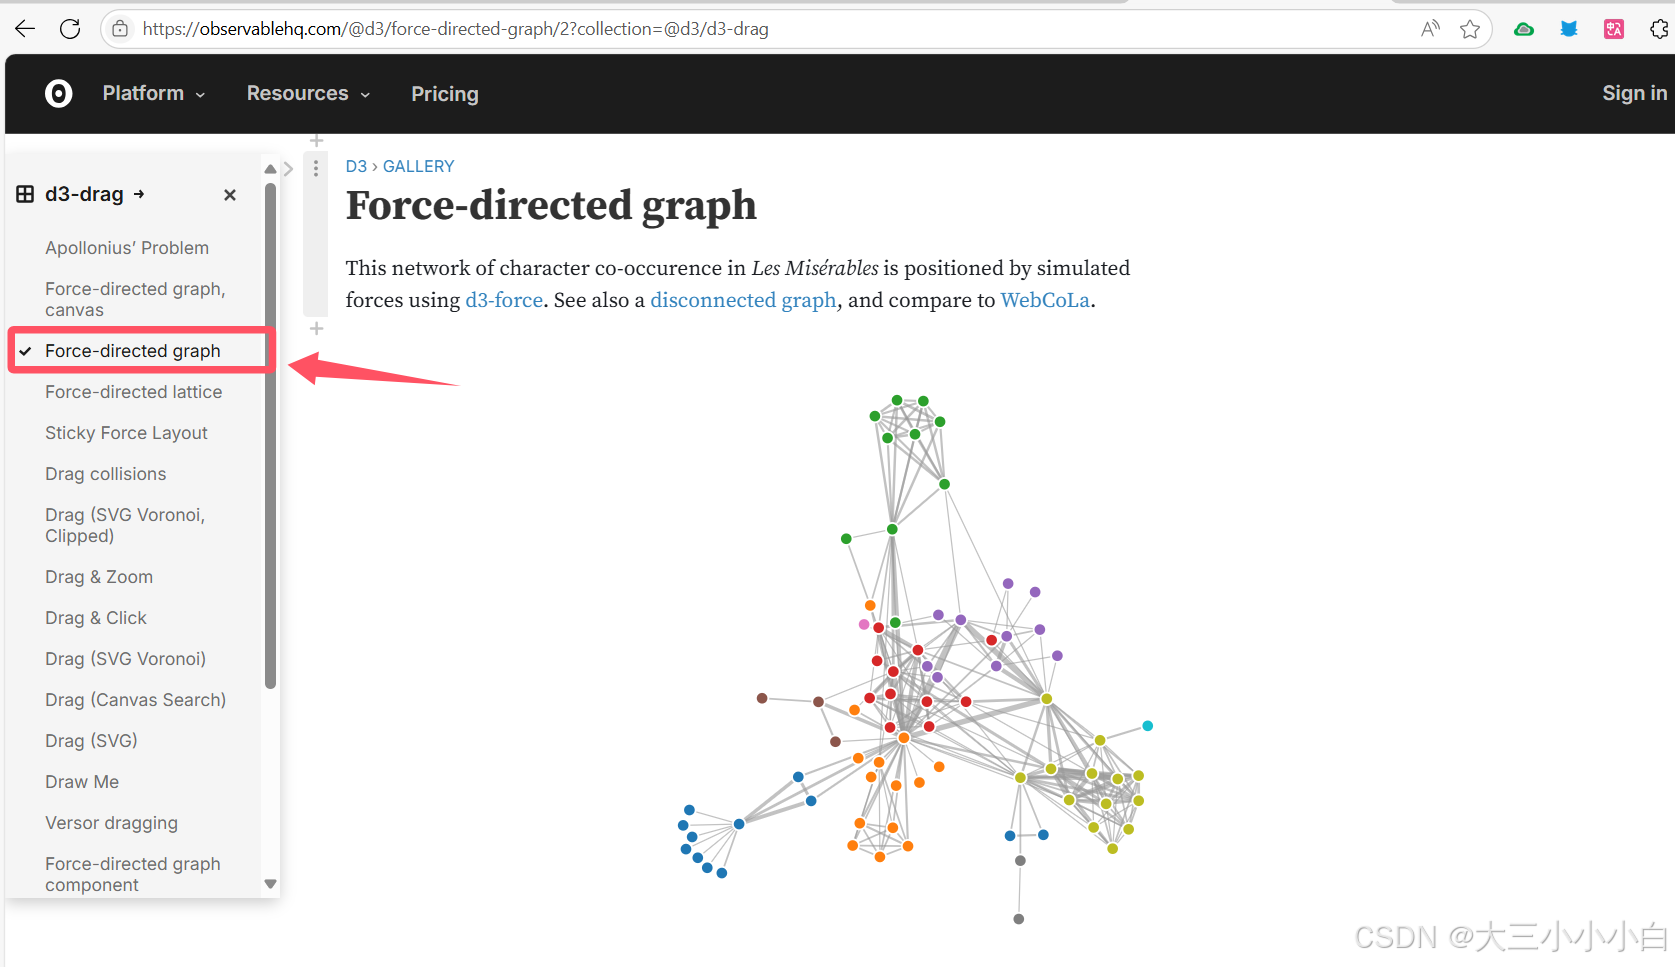
官方代碼+代碼解釋:
chart = {// 1、設置寬度和高度const width = 928;const height = 600;// color 是一個顏色映射函數,根據節點的 group 屬性分配顏色(如不同類別的節點顯示不同顏色)。const color = d3.scaleOrdinal(d3.schemeCategory10);// 2、數據準備// 連接數據和節點數據const links = data.links.map(d => ({...d}));const nodes = data.nodes.map(d => ({...d}));// 3、創建一個力模擬,作用于節點數據。const simulation = d3.forceSimulation(nodes).force("link", d3.forceLink(links).id(d => d.id)) //定義連接力,使連接的節點保持一定距離,指定如何從節點數據中獲取唯一標識符(用于匹配 links 中的 source 和 target)。.force("charge", d3.forceManyBody()) //定義節點間的斥力(負值表示排斥,正值表示吸引).force("center", d3.forceCenter(width / 2, height / 2)) //將整個圖居中顯示。.on("tick", ticked); //每次模擬更新時,調用 ticked 函數更新節點和邊的位置// 4、創建 SVG 容器const svg = d3.create("svg").attr("width", width).attr("height", height).attr("viewBox", [0, 0, width, height]).attr("style", "max-width: 100%; height: auto;");// 5、在每個節點之間繪制連接線(Links)const link = svg.append("g") .attr("stroke", "#999") // 線條顏色.attr("stroke-opacity", 0.6) //透明度.selectAll().data(links).join("line")  // 為每條連接創建 `<line>` 元素.attr("stroke-width", d => Math.sqrt(d.value)); // 線條寬度(基于 `value` 屬性)// 6、繪制節點const node = svg.append("g") .attr("stroke", "#fff") // 節點邊框顏色 .attr("stroke-width", 1.5)  // 邊框寬度.selectAll().data(nodes).join("circle") // 為每個節點創建 `<circle>` 元素.attr("r", 5) // 節點半徑.attr("fill", d => color(d.group)); // 節點顏色(按 `group` 分組)node.append("title").text(d => d.id); // 鼠標懸停時顯示節點 ID// 7、拖拽交互行為(拖曳前中后調用的方法,在最下面)node.call(d3.drag().on("start", dragstarted) .on("drag", dragged) .on("end", dragended));// 8、更新節點和連接位置(ticked 函數)function ticked() {link.attr("x1", d => d.source.x).attr("y1", d => d.source.y).attr("x2", d => d.target.x).attr("y2", d => d.target.y);node.attr("cx", d => d.x).attr("cy", d => d.y);}// 重新激活模擬(alphaTarget 控制模擬的冷卻速度)function dragstarted(event) {if (!event.active) simulation.alphaTarget(0.3).restart();event.subject.fx = event.subject.x;event.subject.fy = event.subject.y;}// 更新被拖拽節點的固定位置(fx, fy)。function dragged(event) {event.subject.fx = event.x;event.subject.fy = event.y;}// 取消固定位置,讓節點恢復自由運動function dragended(event) {if (!event.active) simulation.alphaTarget(0);event.subject.fx = null;event.subject.fy = null;}// 當圖表需要銷毀時(如重新渲染),停止力模擬以釋放資源。invalidation.then(() => simulation.stop());return svg.node();
}
總結:
- 輸入數據:
nodes(節點列表)和links(連接列表)。 - 力模擬:通過物理模型計算節點位置(斥力、連接力、中心力)。
- 渲染:使用 SVG 繪制節點(圓形)和連接(線條)。
- 交互:支持拖拽節點,懸停顯示信息。
- 動態更新:每次模擬迭代后更新視圖。
交互過程:拖動Drag、縮放Zoom、點擊Click
官網:Force-directed graph / D3 | Observable

三、實現一個網絡拓撲圖
工作流程圖:
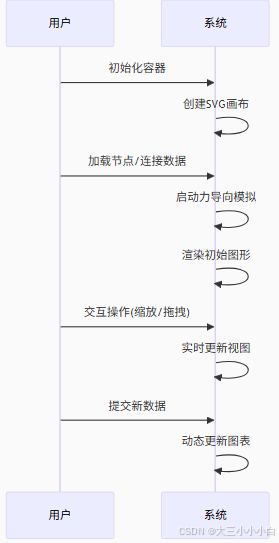
使用流程:
1、從npm安裝d3
npm install d3
2、將 d3 加載到應用中
import * as d3 from "d3";
3、創建一個SVG容器
-
選中 #chart 容器,創建 SVG 元素。
const svg = d3.select('#chart').append('svg'); -
設置svg寬高
-
建一個
<g>分組元素作為所有圖表內容(節點和連接線)的統一容器(并設置為拖放/平移),添加到svg -
在統一容器下面創建兩個
<g>組,分別用于渲染節點和邊,添加到container
注:<g> 是 SVG 的一個核心元素,表示 分組(Group)。它的作用類似于 HTML 中的 <div>,主要用于結構化組織多個圖形元素,并可以對這些元素統一應用屬性或變換
比如我可以創建一個組,設置這個組里面所有邊都是一個顏色。
使用組的優點:統一屬性設置、代碼可讀性高、減少重復操作、對組綁定事件
類比解釋
| 概念 | 類比 | 說明 |
|---|---|---|
zoom | 遙控器 | 接收用戶輸入(按鈕/滾輪),發出控制信號 |
container | 電視屏幕 | 接收遙控器信號,實際改變顯示內容 |
e.transform | 遙控信號 | 包含"音量調高"或"頻道切換"等具體指令 |
| 子元素 | 電視畫面內容 | 自動跟隨屏幕的變化,無需直接處理信號 |
4、定義數據類型
網絡拓撲圖由節點、邊、環組成,前端需從后端獲取數據
let nodesData = []
let edgesData = []
let hoopsData = []
定義數據類型存儲節點、邊、環的數據。
- 節點:圖中的基本實體
- 邊:連接兩個節點之間的線
- 環:圖中首尾相連的路徑
5、創建一個力導向布局
const simulation = d3.forceSimulation(nodes) // 初始化模擬,傳入節點數組.force('link', // 添加"連接力"(使連接的節點保持特定距離)d3.forceLink() // 創建連接力.id((d) => d.node_id) // 指定如何從節點數據中獲取唯一標識符).force('collision', // 添加"碰撞力"(防止節點重疊)d3.forceCollide().radius(50) // 設置碰撞檢測半徑(節點間距至少為50) ).velocityDecay(0.5) // 設置速度衰減系數(類似摩擦力,0-1)// 0.5表示每幀速度衰減50%,值越小移動越"滑",越大越"頓"
6、節點和邊的渲染
節點:
-
用 顯示節點圖標(通過 getImg 獲取)。
-
用
顯示節點名稱,超長自動截斷。 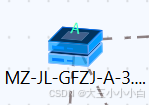
node = node.data(nodes).join((enter) => {const g = enter.append('g').attr('class', 'node').attr('id', (d) => `node-${d.node_id}`).attr('transform', `translate(200, 200)`);g.append("image").attr("xlink:href", (d) => {return getImg(d.node_type).img}).attr("x", -(NODE_HEIGHT / 2)) // 圖片寬度的一半,用于居中.attr("y", -(NODE_HEIGHT / 2)) // 圖片高度的一半,用于居中.attr("width", NODE_HEIGHT) // 圖片寬度.attr("height", NODE_HEIGHT); // 圖片高度// 添加名稱g.append('text').style('fill', '#000').attr('class', 'node-text').text(d => {return d.node_name.length > 15 ? d.node_name.slice(0, 15) + '...' : d.node_name}).style('text-anchor', 'middle').attr('dx', 0).style('font-size', NODE_FONT_SIZE).attr('y', NODE_WIDTH - 5);if (atlasKey.value == '1' && checked.value == 1) {g.append('text').style('fill', "#000").attr('class', 'node-text').text(d => {return d.ext_prop['alarm.ne_name']}).style('text-anchor', 'middle').attr('dx', 0).style('font-size', NODE_FONT_SIZE).attr('y', NODE_WIDTH + 20);}return g;},(exit) => exit.remove()).on('click', clickNode).call(drag(simulation));
邊:用
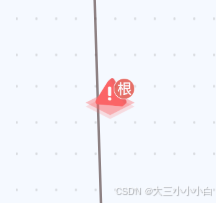
link = link.data(links).join(enter => {const g = enter.append('g').attr('id', d => getLinkIds(d, 'line')).attr('class', d => 'top line')if (atlasKey.value == '1') {// 根因告警 虛線g.append('path').attr('id', d => getLinkIds(d)).style('stroke', d => getLinkColor(d)).attr('fill', 'none').attr('stroke-width', '2px').attr('stroke-dasharray', '10 5 5 10')} else {// 網絡拓撲 實線g.append('path').attr('id', d => getLinkIds(d)).style('stroke', d => getLinkColor(d)).attr('fill', 'none').attr('stroke-width', '2px').attr('transform', d => `translate(${calculateMidPoint(d)})`)}// 邊上的圖標g.append('image').attr('class', d => {if (!(d?.ext_prop?.alarmIdList?.length > 0)) {return 'hide'}}).attr('xlink:href', d => d.isAlarmRoot ? icon09 : icon08).attr('width', NODE_WIDTH).attr('height', NODE_HEIGHT).attr('x', -10).attr('y', -10);return g}).on('click', clickLink)
7、設置交互邏輯
const chartEl = document.querySelector('#chart');
const svg = d3.select('#chart').append('svg');
const width = chartEl.offsetWidth;
const height = chartEl.clientHeight
const zoom = d3.zoom().on('zoom', handleZoom);
const container = svg.append('g').attr('class', 'container');function handleZoom(e) {container.attr('transform', e.transform);
}svg.attr('width', width).attr('height', height).call(zoom);
async function clickNode(e) {tooltipNode.visible = falseconst node = e.target.__data__;getAlarmList(true, node, nodesData); // 這里會彈出詳細信息e.stopPropagation();
}async function clickLink(e) {tooltipNode.visible = falseconst node = e.target.__data__;getAlarmList(false, node, nodesData); // 這里會彈出詳細信息e.stopPropagation();
}
const drag = () => {function dragstarted(event, d) {if (!event.active) simulation.alphaTarget(0.3).restart();d.x = d.x;d.y = d.y;}function dragged(event, d) {d.fx = event.x;d.fy = event.y;// 更新線條updateLinks();// 更新圖像位置updateImages();}function dragended(event, d) {if (!event.active) simulation.alphaTarget(0);// d.fx = null;// d.fy = null;}return d3.drag().on('start', dragstarted).on('drag', dragged).on('end', dragended);
};
function updateLinks() {link.attr('d', d => {const dx = d.target.x - d.source.x,dy = d.target.y - d.source.y,dr = Math.sqrt(dx * dx + dy * dy);return `M ${d.source.x},${d.source.y} A ${dr},${dr} 0 0,1 ${d.target.x},${d.target.y}`;});
}function updateImages() {link.select('image').attr('x', d => {const midX = (d.source.x + d.target.x) / 2;return midX - 20 / 2; // 調整水平位置,使圖片居中}).attr('y', d => {const midY = (d.source.y + d.target.y) / 2;return midY - 20 / 2; // 調整垂直位置,使圖片居中});
}
node = node.data(nodes).join(// ...enter邏輯).on('click', clickNode).call(drag(simulation));link = link.data(links).join(// ...enter邏輯).on('click', clickLink)
四、參考力導向圖組件
力導向圖形組件 / D3 |觀察 — Force-directed graph component / D3 | Observable
官方代碼+中文注釋
function ForceGraph({nodes, // 節點對象數組,通常格式如 [{id}, …]links // 連接線對象數組,通常格式如 [{source, target}, …]
}, {nodeId = d => d.id, // 從節點數據中獲取唯一標識符的函數nodeGroup, // 從節點數據中獲取分組信息的函數nodeGroups, // 節點分組的可選值數組nodeTitle, // 節點標題文本nodeFill = "currentColor", // 節點填充顏色nodeStroke = "#fff", // 節點邊框顏色nodeStrokeWidth = 1.5, // 節點邊框寬度(像素)nodeStrokeOpacity = 1, // 節點邊框透明度nodeRadius = 5, // 節點半徑(像素)nodeStrength, // 節點間作用力強度linkSource = ({source}) => source, // 從連接線數據中獲取源節點linkTarget = ({target}) => target, // 從連接線數據中獲取目標節點linkStroke = "#999", // 連接線顏色linkStrokeOpacity = 0.6, // 連接線透明度linkStrokeWidth = 1.5, // 連接線寬度(像素)linkStrokeLinecap = "round", // 連接線端點樣式linkStrength, // 連接線作用力強度colors = d3.schemeTableau10, // 顏色方案,用于節點分組width = 640, // 畫布寬度(像素)height = 400, // 畫布高度(像素)invalidation // 當此Promise完成時停止模擬
} = {}) {// 數據處理const N = d3.map(nodes, nodeId).map(intern); // 節點ID數組const R = typeof nodeRadius !== "function" ? null : d3.map(nodes, nodeRadius); // 節點半徑數組const LS = d3.map(links, linkSource).map(intern); // 連接線源節點數組const LT = d3.map(links, linkTarget).map(intern); // 連接線目標節點數組if (nodeTitle === undefined) nodeTitle = (_, i) => N[i]; // 默認使用節點ID作為標題const T = nodeTitle == null ? null : d3.map(nodes, nodeTitle); // 節點標題數組const G = nodeGroup == null ? null : d3.map(nodes, nodeGroup).map(intern); // 節點分組數組const W = typeof linkStrokeWidth !== "function" ? null : d3.map(links, linkStrokeWidth); // 連接線寬度數組const L = typeof linkStroke !== "function" ? null : d3.map(links, linkStroke); // 連接線顏色數組// 將輸入數據轉換為可修改對象供模擬使用nodes = d3.map(nodes, (_, i) => ({id: N[i]}));links = d3.map(links, (_, i) => ({source: LS[i], target: LT[i]}));// 計算默認分組if (G && nodeGroups === undefined) nodeGroups = d3.sort(G);// 創建比例尺const color = nodeGroup == null ? null : d3.scaleOrdinal(nodeGroups, colors);// 創建作用力模型const forceNode = d3.forceManyBody(); // 節點間作用力const forceLink = d3.forceLink(links).id(({index: i}) => N[i]); // 連接線作用力if (nodeStrength !== undefined) forceNode.strength(nodeStrength); // 設置節點作用力強度if (linkStrength !== undefined) forceLink.strength(linkStrength); // 設置連接線作用力強度// 創建力導向模擬const simulation = d3.forceSimulation(nodes).force("link", forceLink) // 添加連接線作用力.force("charge", forceNode) // 添加節點間作用力.force("center", d3.forceCenter()) // 添加向中心的作用力.on("tick", ticked); // 設置每幀更新回調// 創建SVG畫布const svg = d3.create("svg").attr("width", width) // 設置寬度.attr("height", height) // 設置高度.attr("viewBox", [-width / 2, -height / 2, width, height]) // 設置視圖框.attr("style", "max-width: 100%; height: auto; height: intrinsic;"); // 響應式樣式// 創建連接線組const link = svg.append("g").attr("stroke", typeof linkStroke !== "function" ? linkStroke : null) // 連接線顏色.attr("stroke-opacity", linkStrokeOpacity) // 連接線透明度.attr("stroke-width", typeof linkStrokeWidth !== "function" ? linkStrokeWidth : null) // 連接線寬度.attr("stroke-linecap", linkStrokeLinecap) // 連接線端點樣式.selectAll("line").data(links).join("line");// 創建節點組const node = svg.append("g").attr("fill", nodeFill) // 節點填充色.attr("stroke", nodeStroke) // 節點邊框色.attr("stroke-opacity", nodeStrokeOpacity) // 節點邊框透明度.attr("stroke-width", nodeStrokeWidth) // 節點邊框寬度.selectAll("circle").data(nodes).join("circle").attr("r", nodeRadius) // 節點半徑.call(drag(simulation)); // 添加拖拽交互// 設置動態樣式if (W) link.attr("stroke-width", ({index: i}) => W[i]); // 動態連接線寬度if (L) link.attr("stroke", ({index: i}) => L[i]); // 動態連接線顏色if (G) node.attr("fill", ({index: i}) => color(G[i])); // 按分組設置節點顏色if (R) node.attr("r", ({index: i}) => R[i]); // 動態節點半徑if (T) node.append("title").text(({index: i}) => T[i]); // 添加節點提示文本if (invalidation != null) invalidation.then(() => simulation.stop()); // 設置模擬停止條件// 輔助函數:確保值為可比較的原始值function intern(value) {return value !== null && typeof value === "object" ? value.valueOf() : value;}// 模擬更新時的回調函數function ticked() {// 更新連接線位置link.attr("x1", d => d.source.x).attr("y1", d => d.source.y).attr("x2", d => d.target.x).attr("y2", d => d.target.y);// 更新節點位置node.attr("cx", d => d.x).attr("cy", d => d.y);}// 拖拽交互函數function drag(simulation) {    // 拖拽開始function dragstarted(event) {if (!event.active) simulation.alphaTarget(0.3).restart(); // 激活模擬event.subject.fx = event.subject.x; // 固定節點x坐標event.subject.fy = event.subject.y; // 固定節點y坐標}// 拖拽過程中function dragged(event) {event.subject.fx = event.x; // 更新固定x坐標event.subject.fy = event.y; // 更新固定y坐標}// 拖拽結束function dragended(event) {if (!event.active) simulation.alphaTarget(0); // 停止模擬event.subject.fx = null; // 釋放x坐標event.subject.fy = null; // 釋放y坐標}return d3.drag().on("start", dragstarted).on("drag", dragged).on("end", dragended);}// 返回SVG元素和比例尺return Object.assign(svg.node(), {scales: {color}});
}
代碼結構分析
1. 初始化與數據處理
const N = d3.map(nodes, nodeId).map(intern); // 節點ID
const R = typeof nodeRadius !== "function" ? null : d3.map(nodes, nodeRadius); // 節點半徑
const LS = d3.map(links, linkSource).map(intern); // 連接源節點
const LT = d3.map(links, linkTarget).map(intern); // 連接目標節點
2. 力模擬設置
const simulation = d3.forceSimulation(nodes).force("link", forceLink) // 連接力.force("charge", forceNode) // 節點間斥力.force("center", d3.forceCenter()) // 向心力.on("tick", ticked); // 每幀更新
- 創建力模擬系統,包含三種力:
forceLink: 保持連接長度的力forceNode: 節點間斥力(避免重疊)forceCenter: 將圖形居中
3. SVG元素創建
const svg = d3.create("svg")...; // 創建SVG畫布const link = svg.append("g")...; // 創建連接線組
const node = svg.append("g")...; // 創建節點組
- 創建SVG容器和分組
- 綁定數據到DOM元素
4. 交互功能
function drag(simulation) {// 拖拽事件處理function dragstarted(event) {...}function dragged(event) {...}function dragended(event) {...}return d3.drag().on("start", dragstarted).on("drag", dragged).on("end", dragended);
}
- 實現節點拖拽功能
- 拖拽時臨時固定節點位置
- 釋放后恢復物理模擬
5. 更新函數
function ticked() {link.attr("x1", d => d.source.x).attr("y1", d => d.source.y).attr("x2", d => d.target.x).attr("y2", d => d.target.y);node.attr("cx", d => d.x).attr("cy", d => d.y);
}
- 每次模擬"tick"時更新節點和連接線位置
- 將模擬中的坐標同步到SVG元素
項目代碼
import * as d3 from 'd3';
import {getLinkIds, linkArc, registerDefs, getLinkColor, getImg} from '@/pages/chart_model/chart/summary/utils';
import {NODE_WIDTH,NODE_HEIGHT,NODE_FONT_SIZE,} from '@/pages/chart_model/chart/summary/config';
import {tooltipNode, setToolTipNode} from '@/pages/chart_model/store/tool-node';
import {getSceneKey} from "@/pages/chart_model/chart/sceneCommon";import icon08 from '@/assets/chart_model/node2/icon08.png'
import icon09 from '@/assets/chart_model/node2/icon09da.png'import {setCoordinate,
} from "@/pages/chart_model/js/index_default2";
import {adjustCoordinates,calculateMidPoint,filterDataHandle, getAlarmList,setLinkisRoot
} from "@/pages/chart_model/js/index_default";
window.d3 = d3let graph = null;
let nodesData = []
let edgesData = []
let hoopsData = []export default (state) => {let nodes = [];let links = [];const chartEl = document.querySelector('#chart');const svg = d3.select('#chart').append('svg');const width = chartEl.offsetWidth;const height = chartEl.clientHeightconst zoom = d3.zoom().on('zoom', handleZoom);const container = svg.append('g').attr('class', 'container');function handleZoom(e) {container.attr('transform', e.transform);}svg.attr('width', width).attr('height', height).call(zoom);async function clickNode(e) {tooltipNode.visible = falseconst node = e.target.__data__;getAlarmList(true, node, nodesData);e.stopPropagation();}async function clickLink(e) {tooltipNode.visible = falseconst node = e.target.__data__;getAlarmList(false, node,nodesData);e.stopPropagation();}const drag = () => {function dragstarted(event, d) {if (!event.active) simulation.alphaTarget(0.3).restart();d.x = d.x;d.y = d.y;}function dragged(event, d) {d.fx = event.x;d.fy = event.y;// 更新線條updateLinks();// 更新圖像位置updateImages();}function dragended(event, d) {if (!event.active) simulation.alphaTarget(0);}return d3.drag().on('start', dragstarted).on('drag', dragged).on('end', dragended);};let link = container.append('g').attr('class', 'lines').selectAll('g');let node = container.append('g').attr('class', 'nodes').selectAll('g');const simulation = d3.forceSimulation(nodes).force('link', d3.forceLink().id((d) => d.node_id)).force('collision', d3.forceCollide().radius(50)).velocityDecay(0.5);function ticked(d) {link.selectAll('path').attr('d', linkArc);node.attr('transform', (d) => `translate(${d.x},${d.y})`);}// 更新線條的方法function updateLinks() {link.attr('d', d => {const dx = d.target.x - d.source.x,dy = d.target.y - d.source.y,dr = Math.sqrt(dx * dx + dy * dy);return `M ${d.source.x},${d.source.y} A ${dr},${dr} 0 0,1 ${d.target.x},${d.target.y}`;});}// 更新圖像位置的方法function updateImages() {link.select('image').attr('x', d => {const midX = (d.source.x + d.target.x) / 2;return midX - 20 / 2; // 調整水平位置,使圖片居中}).attr('y', d => {const midY = (d.source.y + d.target.y) / 2;return midY - 20 / 2; // 調整垂直位置,使圖片居中});}graph = {name: 'summary',nodes,links,graph,appendData(data, alarmOrReason, atlasKey, value1, nodeIdInhoop) {simulation.stop();let filterDataHandle4 = filterDataHandle(data, alarmOrReason,atlasKey, value1, nodeIdInhoop, state);setCoordinate(filterDataHandle4.nodes, filterDataHandle4.links, atlasKey, alarmOrReason, state, state.sceneKey)nodes = filterDataHandle4.nodes;links = filterDataHandle4.links;adjustCoordinates(nodes)setLinkisRoot(links, nodesData)this.restart(atlasKey, alarmOrReason);},restart(atlasKey = 1, checked) {node = node.data(nodes).join((enter) => {const g = enter.append('g').attr('class', 'node').attr('id', (d) => `node-${d.node_id}`).attr('transform', `translate(200, 200)`);g.append("image").attr("xlink:href", (d) => {return getImg(d.node_type).img}).attr("x", -(NODE_HEIGHT / 2)) // 圖片寬度的一半,用于居中.attr("y", -(NODE_HEIGHT / 2)) // 圖片高度的一半,用于居中.attr("width", NODE_HEIGHT) // 圖片寬度.attr("height", NODE_HEIGHT); // 圖片高度// 添加名稱g.append('text')// .style('fill', '#fff').style('fill', '#000').attr('class', 'node-text').text(d => {return d.node_name.length > 15 ? d.node_name.slice(0, 15) + '...' : d.node_name}).style('text-anchor', 'middle').attr('dx', 0).style('font-size', NODE_FONT_SIZE).attr('y', NODE_WIDTH - 5);if (atlasKey.value == '1' && checked.value == 1) {g.append('text')// .style('fill', '#fff').style('fill', "#000").attr('class', 'node-text').text(d => {return d.ext_prop['alarm.ne_name']}).style('text-anchor', 'middle').attr('dx', 0).style('font-size', NODE_FONT_SIZE).attr('y', NODE_WIDTH + 20);}return g;},(exit) => exit.remove()).on('click', clickNode).call(drag(simulation));link = link.data(links).join(enter => {const g = enter.append('g').attr('id', d => getLinkIds(d, 'line')).attr('class', d => 'top line')if (atlasKey.value == '1') {// 根因告警 虛線g.append('path').attr('id', d => getLinkIds(d)).style('stroke', d => getLinkColor(d)).attr('fill', 'none').attr('stroke-width', '2px').attr('stroke-dasharray', '10 5 5 10')} else {// 網絡拓撲 實現 后續帶顏色g.append('path').attr('id', d => getLinkIds(d)).style('stroke', d => getLinkColor(d)).attr('fill', 'none').attr('stroke-width', '2px').attr('transform', d => `translate(${calculateMidPoint(d)})`) // 計算中點位置}g.append('image').attr('class', d => {if (!(d?.ext_prop?.alarmIdList?.length > 0)) {return 'hide'}}).attr('xlink:href', d => d.isAlarmRoot ? icon09 : icon08).attr('width', NODE_WIDTH) // 圖片寬度.attr('height', NODE_HEIGHT) // 圖片高度.attr('x', -10) // 調整水平位置,使圖片居中.attr('y', -10); // 調整垂直位置,使圖片居中return g}).on('click', clickLink)simulation.nodes(nodes);simulation.force('link').links(links);simulation.alpha(1).restart();simulation.on('tick', ticked)graph.resetGraphLink()},resetGraph() {simulation.stop()},setData(nodes, links, hoops) {nodesData = nodesedgesData = linkshoopsData = hoops},resetGraphLink() {updateLinks()updateImages()},resetSvg(width,height) {svg.attr("width", width).attr("height", height);}};return graph;
};
)

)


的安裝過程以及GD32的IAR工程模板搭建)

 鑰匙串信息)
)
