腳本概述
這是一個用于服務器日常巡檢的 Shell 腳本,主要功能包括:
- ? ? 檢查多臺主機的網絡連通性
- ? ? 監控CPU、內存和磁盤使用率
- ? ? 生成詳細的巡檢報告
- ? ? 通過企業微信發送告警通知
核心技術點
1. 主機批量管理
- ? ? 使用Ansible工具遠程執行命令和腳本
- ? ? 通過主機清單文件 (ip_file) 管理所有待巡檢主機
2. 資源監控技術
- ? ? ??CPU監控??:通過top命令獲取CPU總使用率
- ? ? ??內存監控??:調用自定義腳本mem.sh獲取內存使用率
- ? ? ??磁盤監控??:調用自定義腳本disk.sh獲取磁盤使用率
3. 閾值告警機制
- ? ? 設置多級告警閾值(警告/嚴重)
- ? ? 使用顏色標記不同嚴重級別的問題
- ? ? 問題計數器統計異常主機數量
4. 報告生成系統(生成三種報告文件)
- ? ? ?完整巡檢結果(result_file)
- ? ? ?問題主機報告(problem_file)
- ? ? ?最終匯總報告(final_report)
- ? ? ?使用 Markdown 格式增強可讀性
5. 通知集成
- ? ? 通過企業微信Webhook API發送告警
- ? ? 支持富文本格式(HTML樣式標記)
- ? ? 自動包含日期信息和問題摘要
腳本內容
注意事項:該腳本依賴 Ansible 工具,執行該腳本前需要提前做好以下準備工作:
- 安裝Ansible
- 配置 ssh 免密登錄(在控制節點生成SSH密鑰對,并將公鑰分發到所有被管理節點)
- 配置 Ansible 主機清單 Inventory 文件(默認
/etc/ansible/hosts),將腳本中ip_file中的ip都加入到 Ansible 主機清單文件中。
整體的 Shell 腳本內容如下:
$ cat /path/dailycheck.sh
#!/bin/bash # ip_file 用于存放需要巡檢的主機清單
ip_file="/path1/hosts"# result_file 用于存所有主機的巡檢結果
result_file="/path1/resulted/resulted.$(date +%Y%m%d)"# problem_file 用于存放有問題/告警的主機信息
problem_file="/path1/problems/problems.$(date +%Y%m%d)"# final_report 存放巡檢報告,也是發到企微群聊的最終報告
final_report=/path1/resulted/final_report_$(date +%Y%m%d).log# 檢查 ip_file 文件是否存在,不存在則終止腳本執行
[ ! -f "$ip_file" ] && echo "找不到ip文件: $ip_file" && exit 1# 初始化結果文件
echo "<font color="blue">IT生產環境巡檢結果</font>" > $result_file
echo -e "<font color="blue">告警詳情:</font>" > $problem_file# 定義閾值
CPU_WARNING=90
CPU_CRITICAL=95
MEM_WARNING=90
MEM_CRITICAL=95
DISK_WARNING=90
DISK_CRITICAL=95# 定義問題計數器
problem_count=0# for 循環巡檢主機清單中的主機
for ip in `cat $ip_file`;do# 初始化變量has_problem=0problem_details=()normal_details=()# 記錄基礎信息到完整日志echo -e "\n===== 主機 $ip 巡檢結果 =====" >> $result_file# 檢查服務器到網關的網絡連通性ansible $ip -m shell -a "ping -c 2 -i 1 192.168.175.254 " > /dev/null 2>&1if [ $? -eq 0 ];thennetwork_status="網絡: 可達"echo "網絡正常" >> $result_fileelse network_status="<font color="red">網絡不可達!</font>"problem_details+=("$ip $network_status")echo "網絡狀態: 不可達" >> $result_filehas_problem=1fi # 檢查cpu使用率cpu_usage=$(ansible $ip -m shell -a 'top -bn1 | grep "Cpu(s)" | awk "{print \$2 + \$4}"' 2>/dev/null | sed -n '2p' | cut -d '.' -f1)if [ -n "$cpu_usage" ]; thenif [ "$cpu_usage" -ge $CPU_CRITICAL ]; thencpu_display="<font color="red">${cpu_usage}%(嚴重)</font>"problem_details+=("CPU: $cpu_display")has_problem=1elif [ "$cpu_usage" -ge $CPU_WARNING ]; thencpu_display="<font color="yellow">${cpu_usage}%(警告)</font>"problem_details+=("CPU: $cpu_display")has_problem=1elsecpu_display="${cpu_usage}%"fiecho "CPU使用率: $cpu_display" >> $result_fileelseecho "CPU使用率: 數據獲取失敗" >> $result_filefi# 檢查內存使用率mem_usage=$(ansible $ip -m script -a '/path1/mem.sh' | sed -n 10p | cut -d'"' -f2 | cut -d '.' -f1)if [ -n "$mem_usage" ]; thenif [ "$mem_usage" -ge $MEM_CRITICAL ]; thenmem_display="<font color="red">${mem_usage}%(嚴重)</font>"problem_details+=("內存: $mem_display")has_problem=1elif [ "$mem_usage" -ge $MEM_WARNING ]; thenmem_display="<font color="yellow">${mem_usage}%(警告)</font>"problem_details+=("內存: $mem_display")has_problem=1elsemem_display="${mem_usage}%"fiecho "內存使用率: $mem_display" >> $result_fileelseecho "內存使用率: 數據獲取失敗" >> $result_filefi# 檢查磁盤使用率disk_usage=$(ansible $ip -m script -a '/path1/disk.sh' | sed -n 10p | cut -d'"' -f2 | cut -d '.' -f1)if [ -n "$disk_usage" ]; thenif [ "$disk_usage" -ge $DISK_CRITICAL ]; thendisk_display="<font color="red">${disk_usage}%(嚴重)</font>"problem_details+=("磁盤: $disk_display")has_problem=1elif [ "$disk_usage" -ge $DISK_WARNING ]; thendisk_display="<font color="yellow">${disk_usage}%(警告)</font>"problem_details+=("磁盤: $disk_display")has_problem=1elsedisk_display="${disk_usage}%"fiecho "磁盤使用率: $disk_display" >> $result_fileelseecho "磁盤使用率: 數據獲取失敗" >> $result_filefi# 記錄問題主機if [ $has_problem -eq 1 ]; thenecho "\n主機: $ip \n$network_status" >> $problem_filefor detail in "${problem_details[@]}"; doecho "$detail" >> "$problem_file"doneecho "" >> "$problem_file"problem_count=$((problem_count+1))fidone# 生成最終報告
total_hosts=$(cat "$ip_file" | wc -l)
{echo "## 巡檢日期: $(date +%Y-%m-%d)"echo "## 巡檢對象: IT生產環境"echo "## 總主機數: $total_hosts 臺"echo "## 告警主機: $problem_count 臺"if [ $problem_count -gt 0 ]; thencat $problem_fileelseecho "<font color="green">本次巡檢無異常!</font>"fi
} > $final_report# 發送異常報告到企業微信
WEBHOOK_URL="https://qyapi.weixin.qq.com/cgi-bin/webhook/send?key=xxxxxxxxxxxxxxxx"
FINAL_REPORT=`cat $final_report`
curl -X POST -H 'Content-Type: application/json' -d "{\"msgtype\": \"markdown\", \"markdown\": {\"content\": \"$FINAL_REPORT\"}}" $WEBHOOK_URL
可以添加 crond 定時任務,周期性執行巡檢腳本
$ crontab -l
0 8 * * 1-5 /path1/dailycheck.sh
巡檢腳本中嵌套的腳本有:
- mem.sh 腳本,用于獲取內存使用率
$ cat /path1/
#!/bin/bash
free -m | awk '/Mem:/ {printf("%.2f\n", $3/$2 * 100.0)}'- disk.sh 腳本,用于獲取磁盤使用率
$ cat /path1/disk.sh
#!/bin/bash
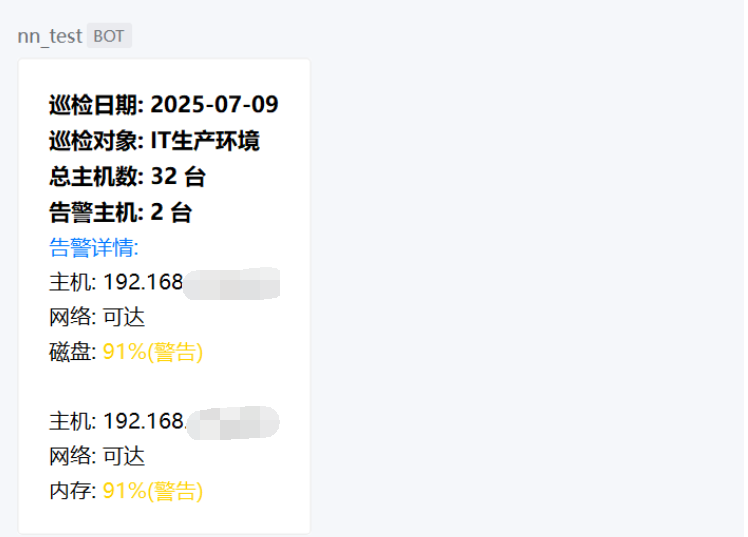
df -Th | grep -E '/\s*$|^/\s*$' | awk '{print $6}' | tr -d '%'巡檢報告
生成的巡檢報告效果如下:

)

)
哈希函數、哈希表介紹、優缺點)
什么是渲染)
)
 視頻教程 - snowNLP庫實現中文情感分析)


