一、概述
? ? ? ? 目前,我們每增加一個被監控的節點,就需要修改prometheus的配置文件,然后重新加載prometheus服務,這種方式比較繁瑣,每次新增、刪除被監控節點都需要重新操作一遍,不適合生產環境的大規模監控架構;
? ? ? ? 所以prometheus就提供了這種問題的解決方案,方案有兩種,基于文檔的自動發現和基于網絡的自動發現。
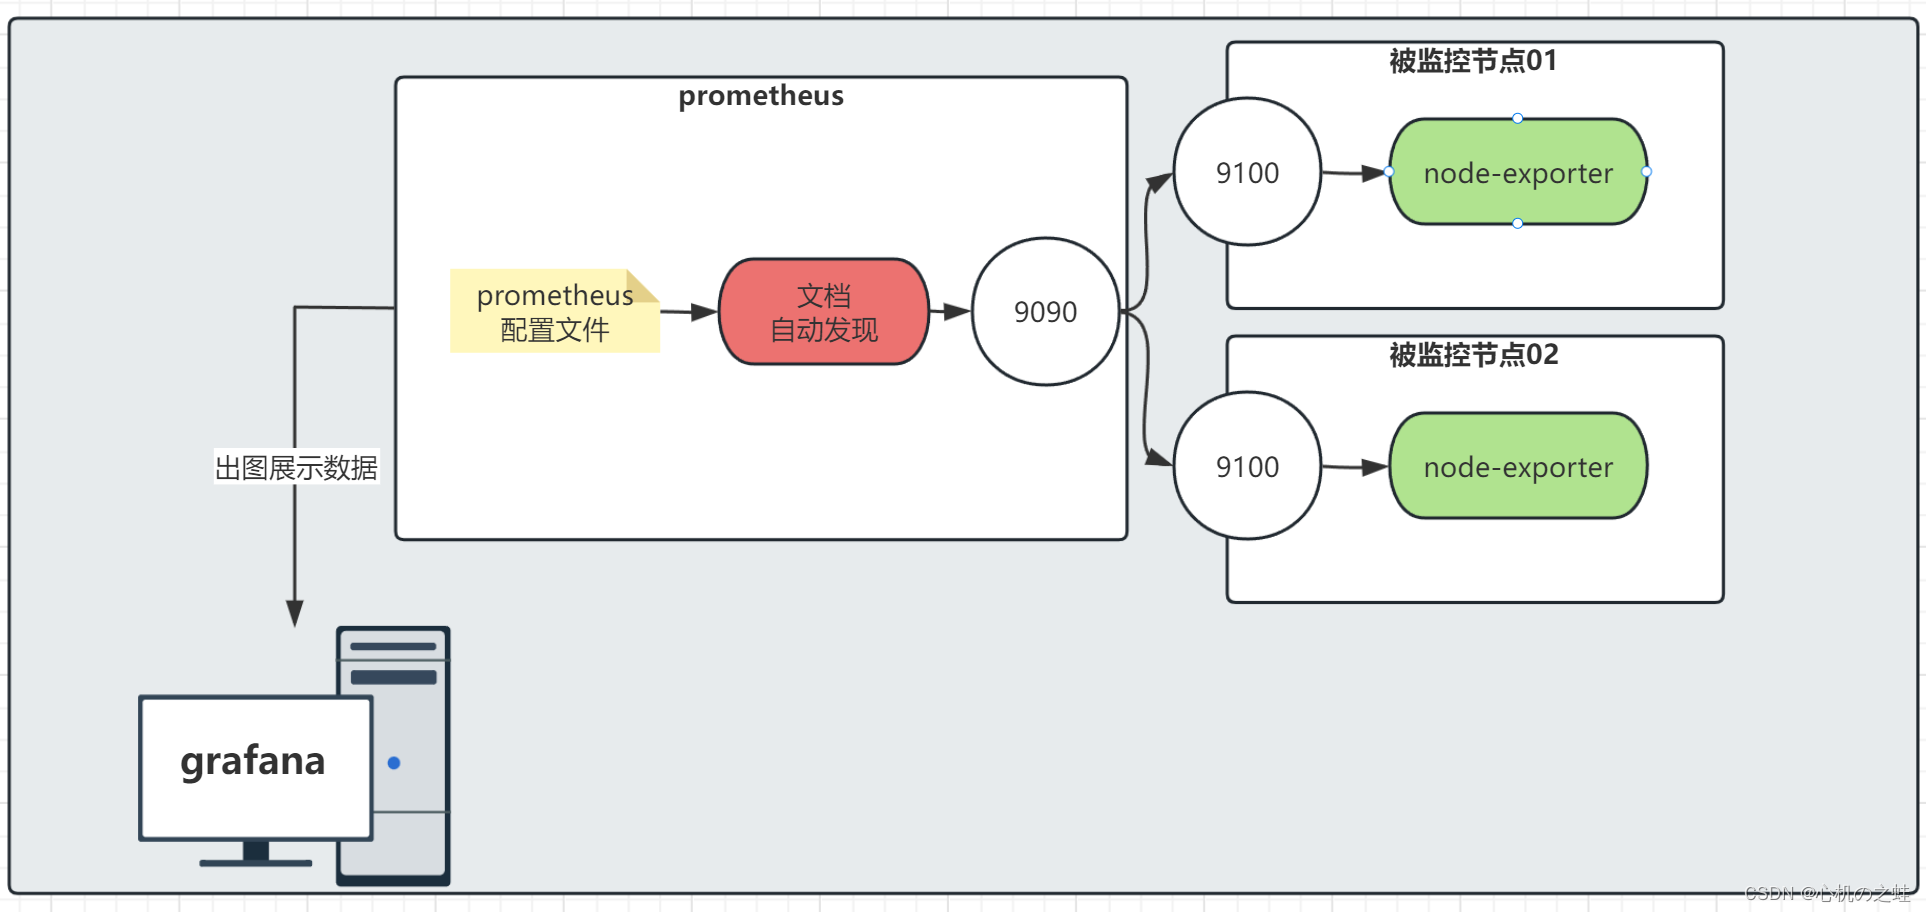
二、基于文檔的自動發現
1,修改prometheus的配置文件
[root@prometheus-server31 ~]# cat /prometheus/soft/prometheus/prometheus.yml?
#通用設置
global:
? #抓取監控的間隔時間,多長時間獲取一次數據(生產環境,建議15-30s);
? scrape_interval: 3s?
? #多久讀一次規則
? evaluation_interval: 15s?#先不解釋,之后會講
alerting:
? alertmanagers:
? ? - static_configs:
? ? ? ? - targets:
? ? ? ? ? # - alertmanager:9093#先不講,之后會講
rule_files:
? # - "first_rules.yml"
? # - "second_rules.yml"#被監控的配置
scrape_configs:
? - job_name: "prometheus"
? ? static_configs:
? ? ? - targets: ["localhost:9090"]
? #另起一個job名稱,被監控的主體自定義名稱
? - job_name: "node-exporter01"
? ? #基于文檔自動發現
? ? file_sd_configs:
? ? ? #文檔的地址路徑
? ? ? - files:
? ? ? ? ? #- /prometheus/soft/prometheus/file-sd.json
? ? ? ? ? - /prometheus/soft/prometheus/file-sd.yaml
2,重新加載prometheus服務
[root@prometheus-server31 ~]# curl -X POST http://10.0.0.31:9090/-/reload
3,編輯自動發現文檔
[root@prometheus-server31 ~]# vim /prometheus/soft/prometheus/file-sd.yaml
- targets:
? ? - '10.0.0.41:9100'
? labels:
? ? xinjizhiwa: prometheus-learn
? ? office: www.xinjizhiwa.com
瀏覽器刷新查看
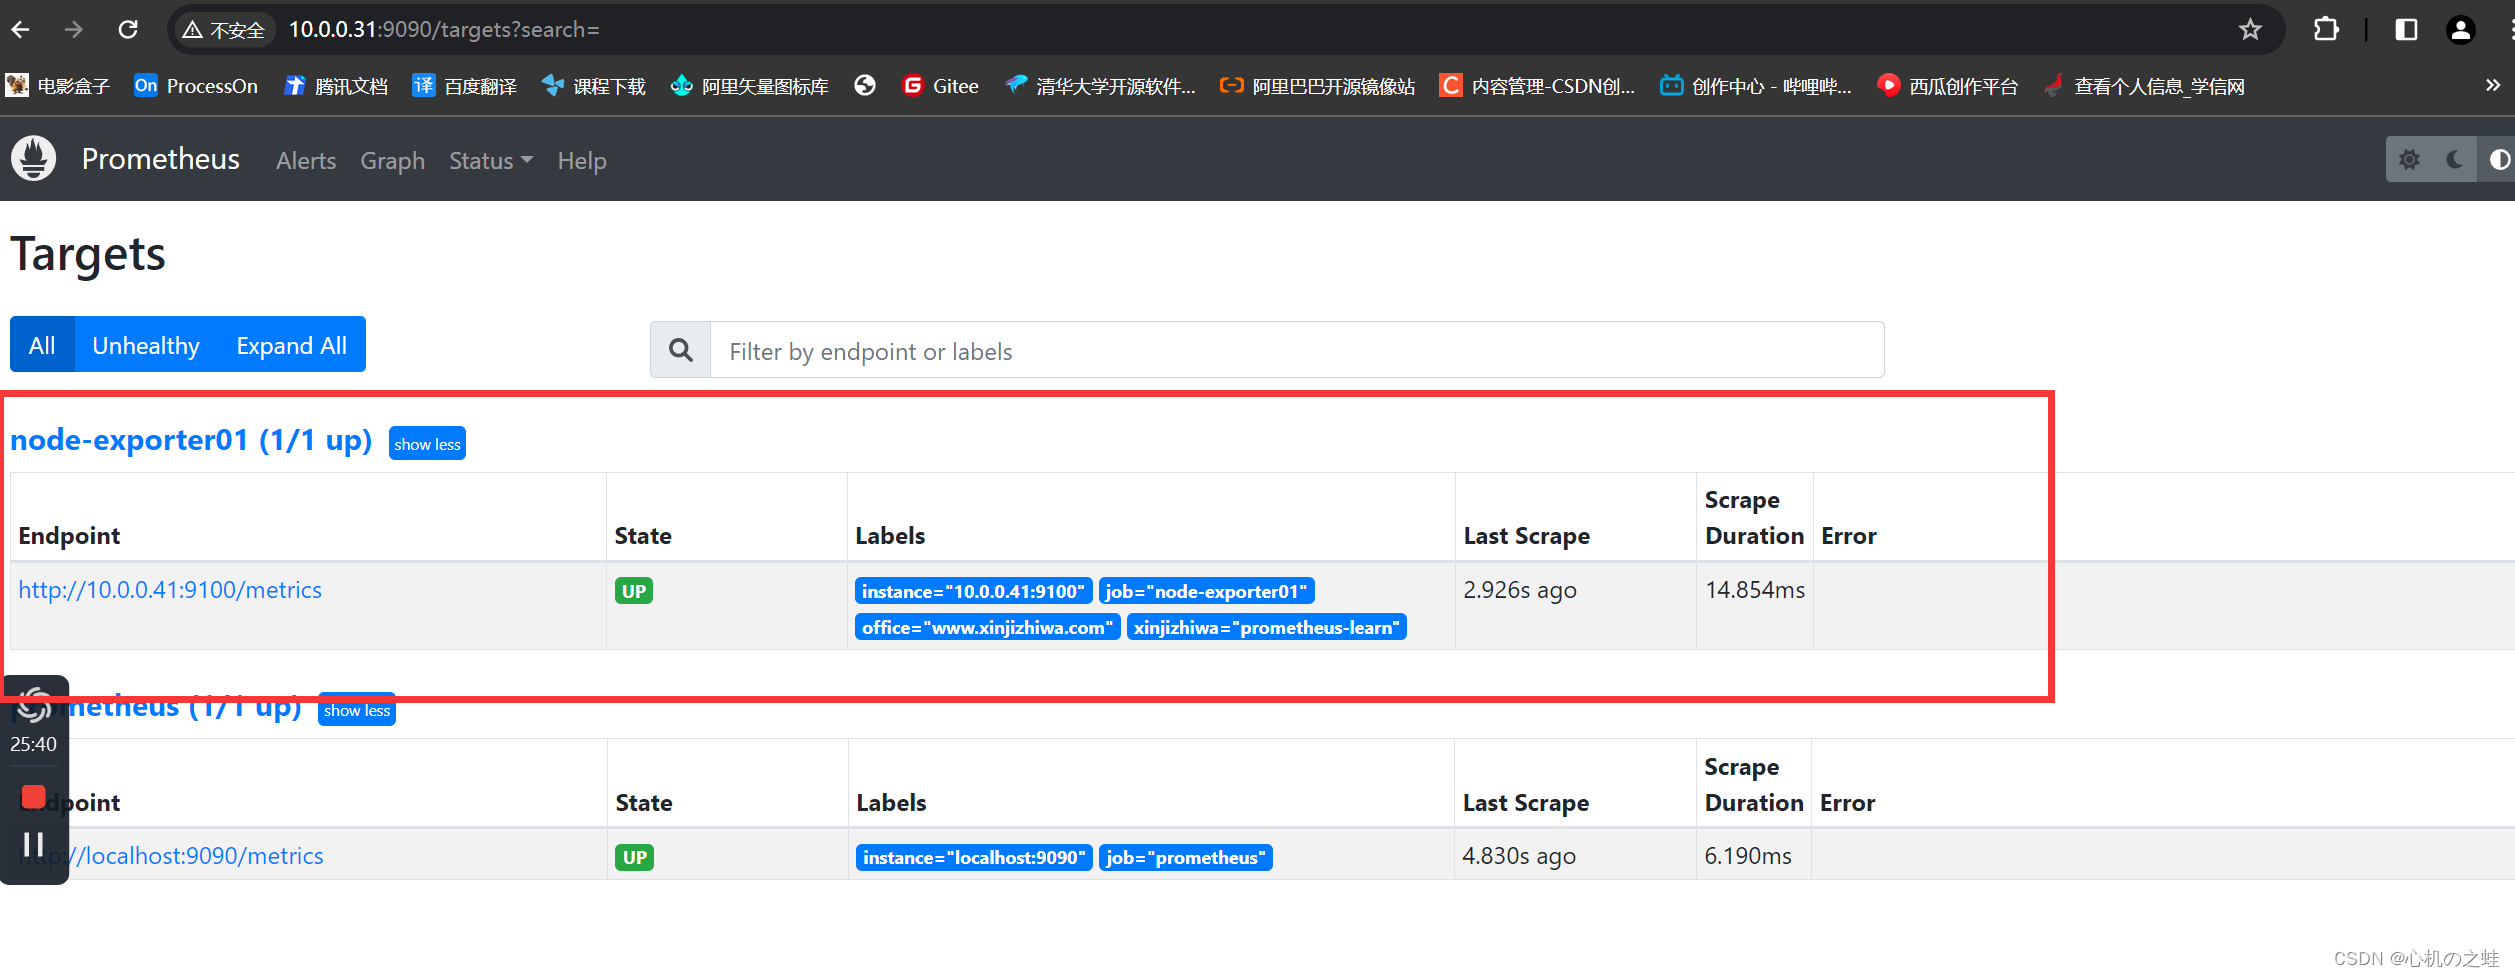
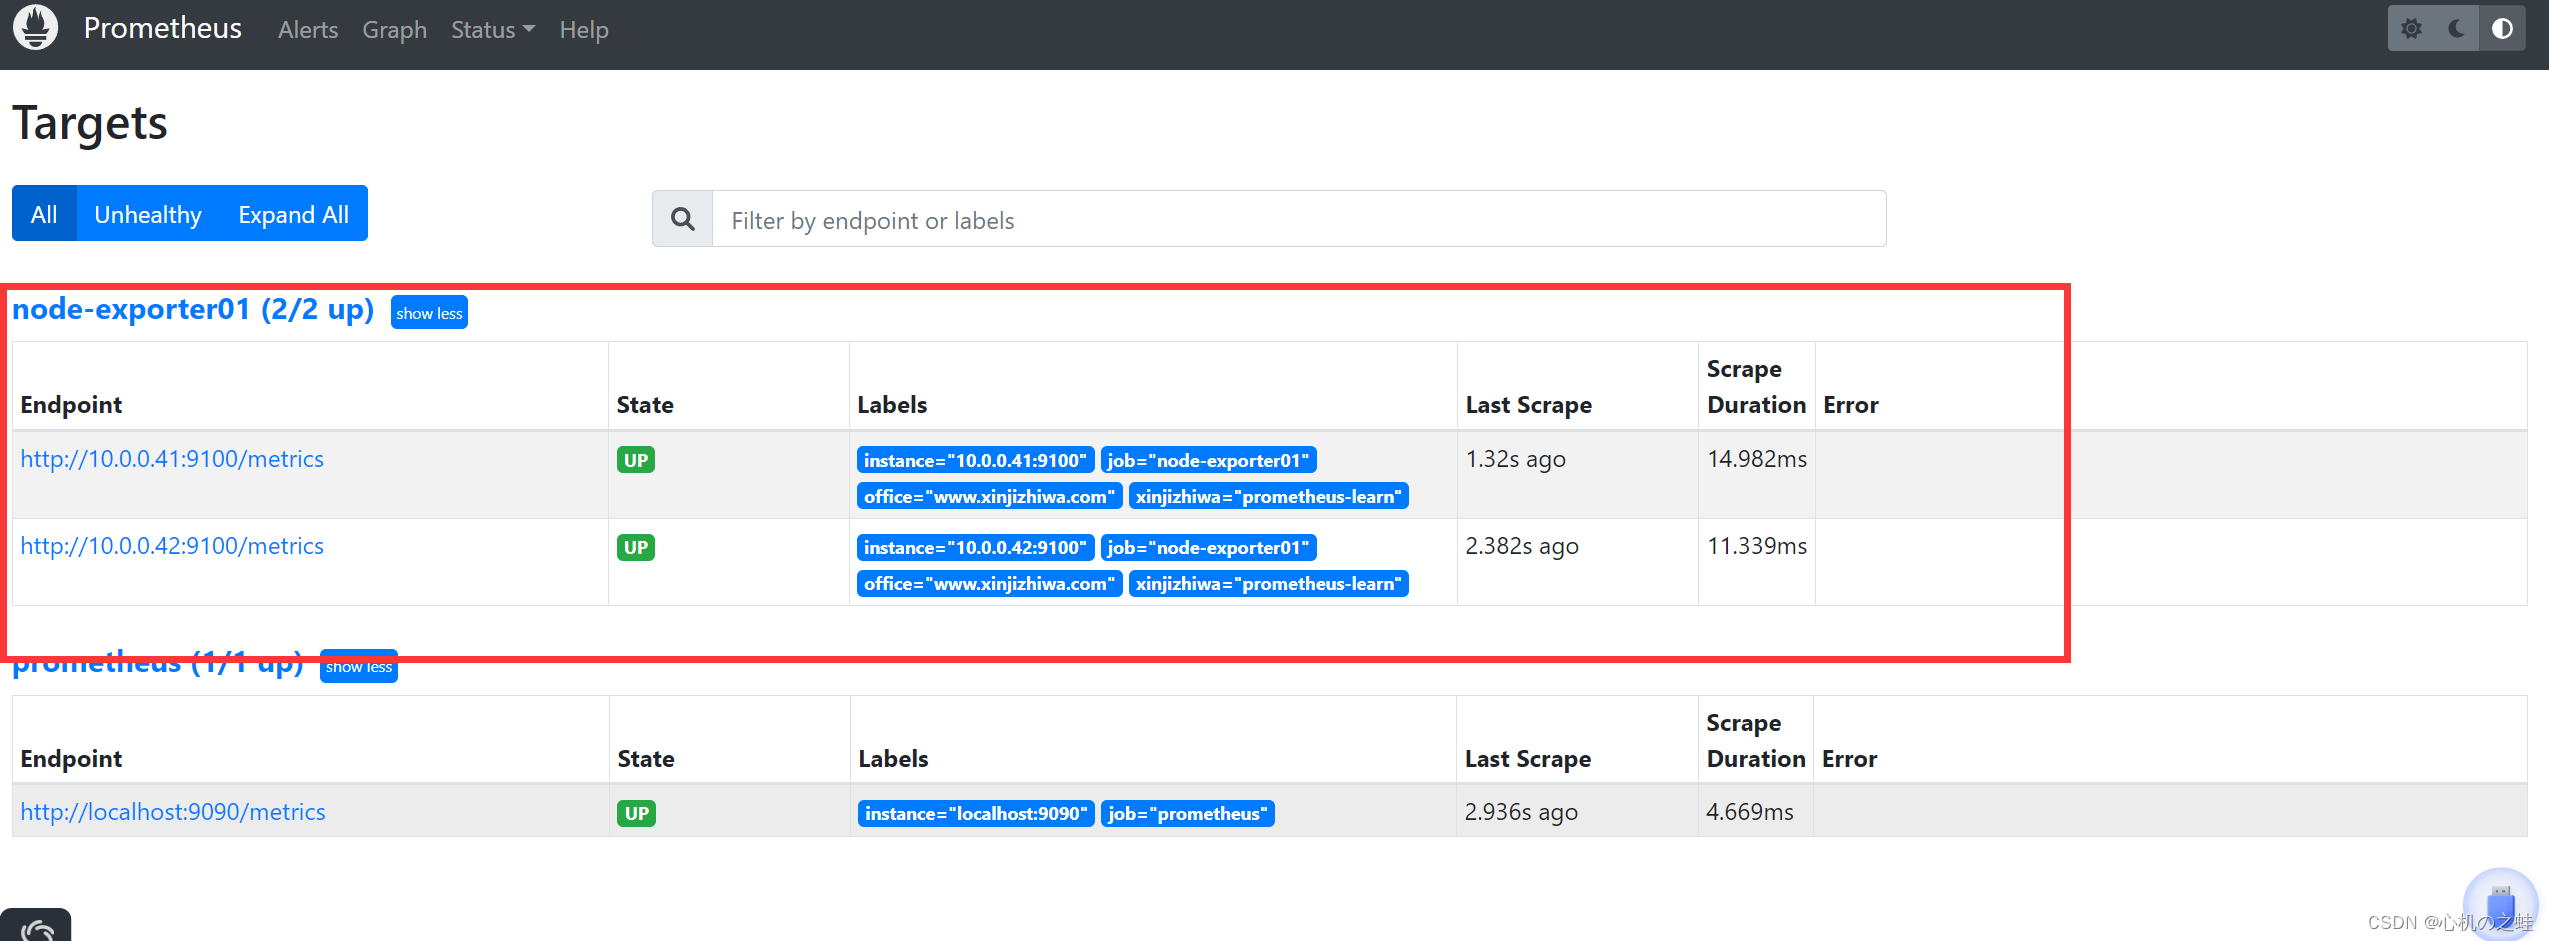
4,重新編輯自動發現文檔,驗證是否自動更新
· yaml文件寫法
[root@prometheus-server31 ~]# vim /prometheus/soft/prometheus/file-sd.yaml
- targets:
? ? - '10.0.0.41:9100'
? ? - '10.0.0.42:9100'
? labels:
? ? xinjizhiwa: prometheus-learn
? ? office: www.xinjizhiwa.com
· json文件寫法
[root@prometheus-server31 ~]# vim /prometheus/soft/prometheus/file-sd.yaml
[
? ? ? ? {
? ? ? ? ? ? ? ? "targets":["10.0.0.41:9100","10.0.0.42:9100"],
? ? ? ? ? ? ? ? "lables":{
? ? ? ? ? ? ? ? ? ? ? ? "xinjizhiwa":"prometheus-learn","office":"wwwxinjizhiwa.com"
????????????????}
????????}
]
瀏覽器刷新,看是否監控到修改后的自動發現列表
5,小結
? ? ? ? 有了文檔的自動發現,那么我們以后就不需要再修改prometheus的配置文件了,更不需要重新加載prometheus服務了,是不是方便了很多呀!
? ? ? ? 那么有沒有更方便的方式吶?那么接下來,我們學習下基于網絡的自動發現。
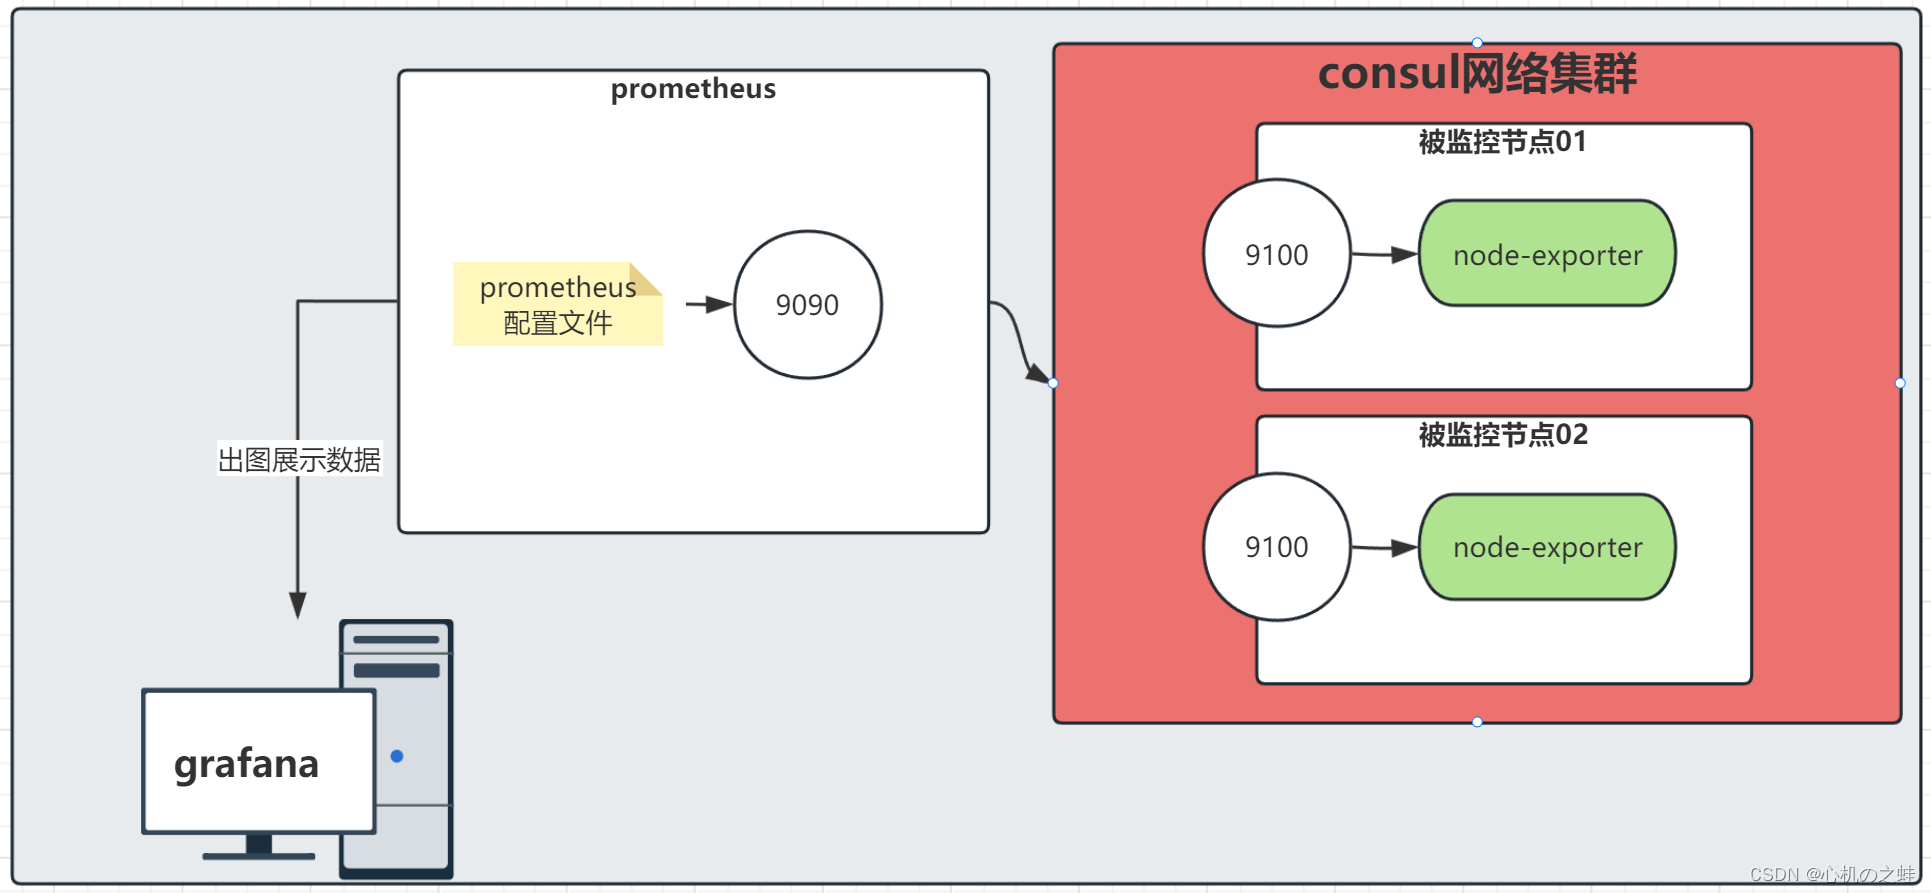
三、基于consul網絡集群自動發現
? ? ? ? 搭建一個consul的網絡集群,讓被監控節點全部加入到網絡集群中,然后配置prometheus監控地址為這個網絡集群,日后,只要有被監控節點加入到這個網絡集群中,prometheus就可以自動的發現這些節點,刷新被監控列表;
1,搭建consul網絡集群
????????隨便準備3臺機器,用來搭建consul網絡集群,本次學習,由于環境限制,我們就從使用虛擬機上選擇就行,日后生產環境,需要單獨拿出來節點服務器進行單獨的配置更好;
官網地址參考鏈接:Consul by HashiCorp
· 下載consul工具
下載方式:
wget https://releases.hashicorp.com/consul/1.15.4/consul_1.15.4_linux_amd64.zip
本次學習,同樣給大家準備了安裝包,在百度云盤;
鏈接:https://pan.baidu.com/s/1qaIutR6qzmJbz72yWy3t_A?pwd=bppk?
提取碼:bppk
· 上傳解壓軟件包
? ? ? ? 本次使用31、71、41作為consul集群的搭建節點;
rz -E
ll
-rw-r--r-- 1 root root 60030076 Nov ?8 01:42 consul_1.16.1_linux_amd64.zip
解壓到全局命令下;
unzip consul_1.16.1_linux_amd64.zip -d /usr/local/bin
· 運行consul服務
1,服務端創建集群
本次學習,我們拿31服務器節點當做consul集群的服務端;
[root@prometheus-server31 consul]# consul agent -server -bootstrap -bind=10.0.0.31 -data-dir=/consul -client=10.0.0.31 -ui
也可以查看下端口8500有沒有開啟~
瀏覽器訪問,可以看到,只有31一個節點;
10.0.0.31:8500
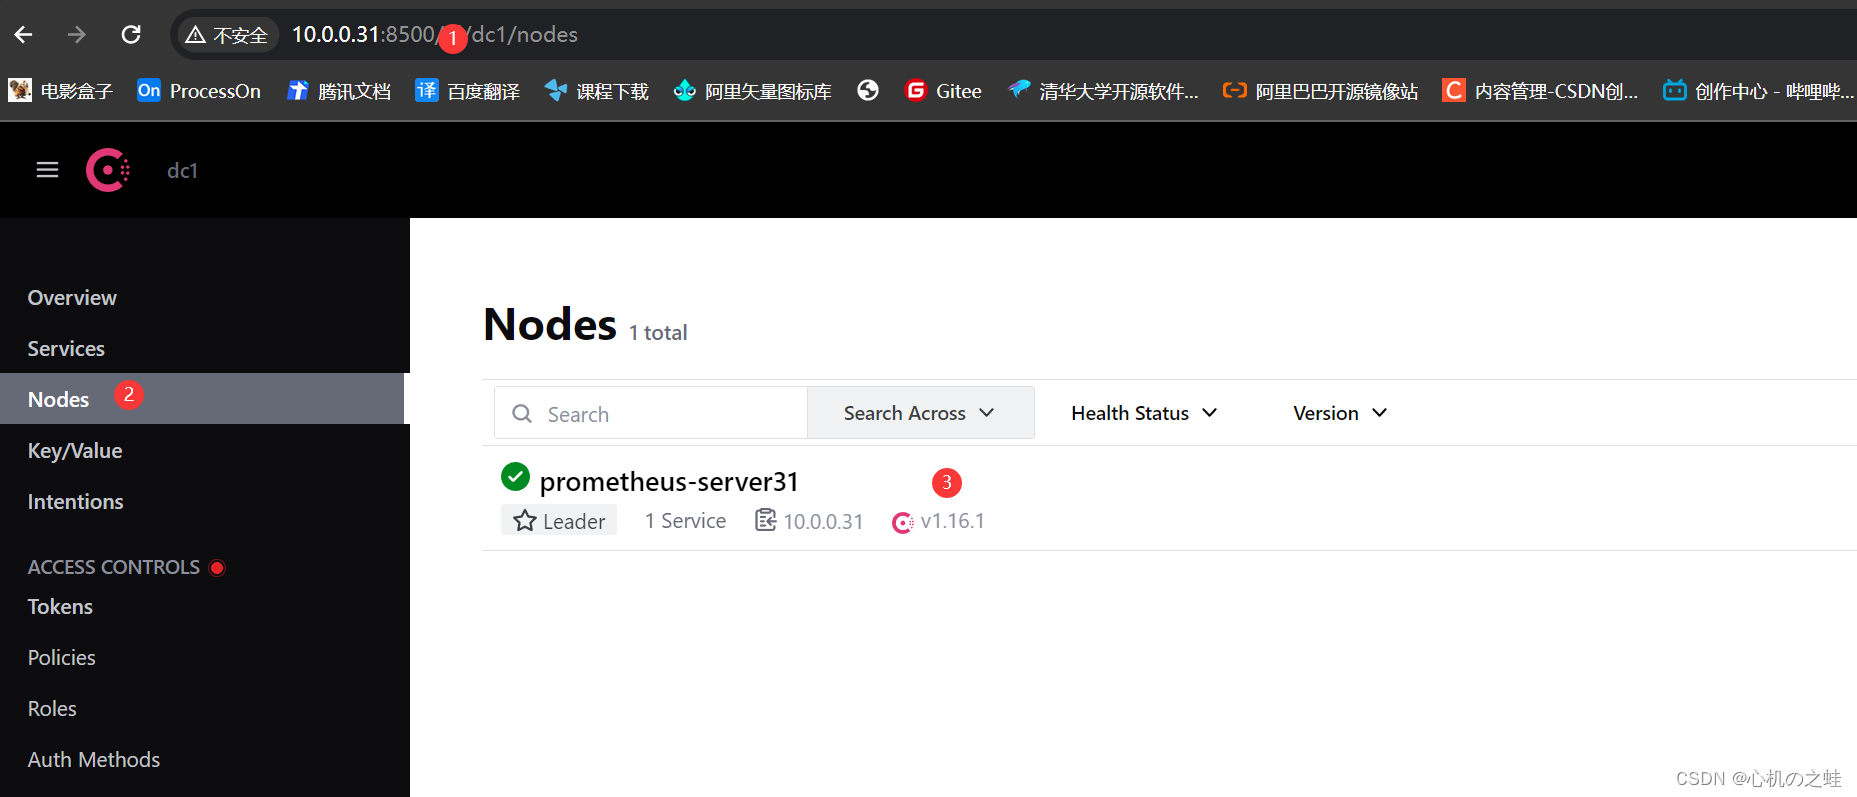
此時集群服務端已經啟動。
2,consul客戶端加入集群
[root@grafana71 consul]# consul agent ?-bind=10.0.0.71 -data-dir=/consul -client=10.0.0.71 -ui -retry-join=10.0.0.31
[root@prometheus-node41 consul]# consul agent ?-bind=10.0.0.41 -data-dir=/consul -client=10.0.0.41 -ui -retry-join=10.0.0.31
3,查看瀏覽器consul地址
此時,consul集群搭建完成;
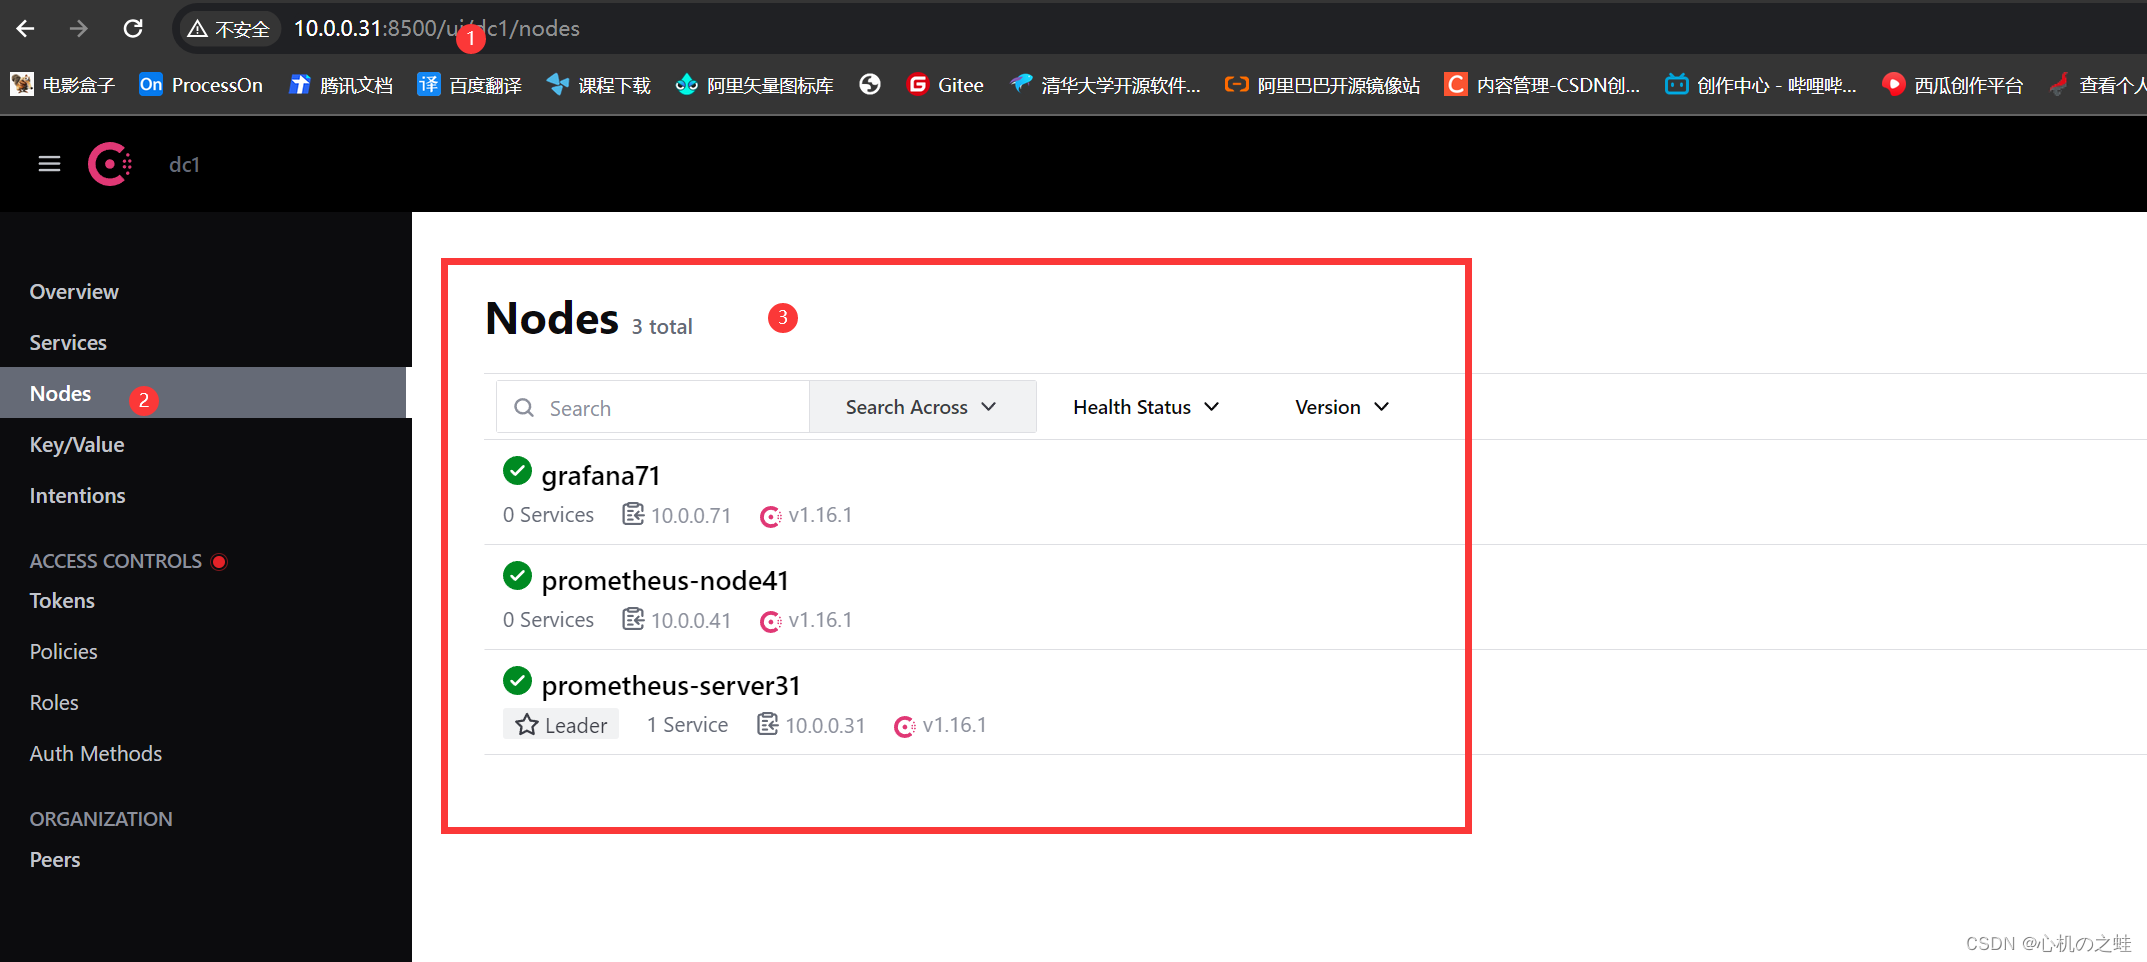
至此,consul網絡集群服務搭建成功!~
2,配置prometheus配置文件
? ? ? ? 目的是讓prometheus去consul網絡中抓取被監控的節點;
[root@prometheus-server31 ~]# cat /prometheus/soft/prometheus/prometheus.yml?
#通用設置
global:
? #抓取監控的間隔時間,多長時間獲取一次數據(生產環境,建議15-30s);
? scrape_interval: 3s?
? #多久讀一次規則
? evaluation_interval: 15s?#先不解釋,之后會講
alerting:
? alertmanagers:
? ? - static_configs:
? ? ? ? - targets:
? ? ? ? ? # - alertmanager:9093#先不講,之后會講
rule_files:
? # - "first_rules.yml"
? # - "second_rules.yml"#被監控的配置
scrape_configs:
? - job_name: "prometheus"
? ? static_configs:
? ? ? - targets: ["localhost:9090"]
? #另起一個job名稱,被監控的主體自定義名稱
? - job_name: "node-exporter01"
? ? #基于consul服務自動發現
? ? consul_sd_configs:
? ? ? #指定consul的服務器地址,若不指定,默認“localhost:8500”
? ? ? - server: 10.0.0.31:8500
? ? ? - server: 10.0.0.71:8500
? ? ? - server: 10.0.0.41:8500
? ? relabel_configs:
? ? ? #匹配consul的源標簽字段,表示服務的名稱
? ? ? - source_labels: [__meta_consul_service]
? ? ? ? # 指定源標簽的正則表達式,若不定義,默認值為"(.*)"
? ? ? ? regex: consul
? ? ? ? # 執行動作為刪除,默認值為"replace",有效值: replace, keep, and drop
? ? ? ? action: drop
[root@prometheus-server31 ~]# curl -X POST http://10.0.0.31:9090/-/reload
3,被監控節點加入consul服務
· 被監控節點41加入
[root@prometheus-node41 ~]# curl -X PUT -d '{"id":"prometheus-node41","name":"prometheus-node41","address":"10.0.0.41","port":9100,"tags":["node-exporter"],"checks": [{"http":"http://10.0.0.41:9100","interval":"5m"}]}' http://10.0.0.31:8500/v1/agent/service/register
· consul集群頁面查看
41加入成功;

· 被監控節點42加入
[root@prometheus-node42 node_exporter]# curl -X PUT -d '{"id":"prometheus-node42","name":"prometheus-node42","address":"10.0.0.42","port":9100,"tags":["node-exporter"],"checks": [{"http":"http://10.0.0.42:9100","interval":"5m"}]}' http://10.0.0.31:8500/v1/agent/service/register
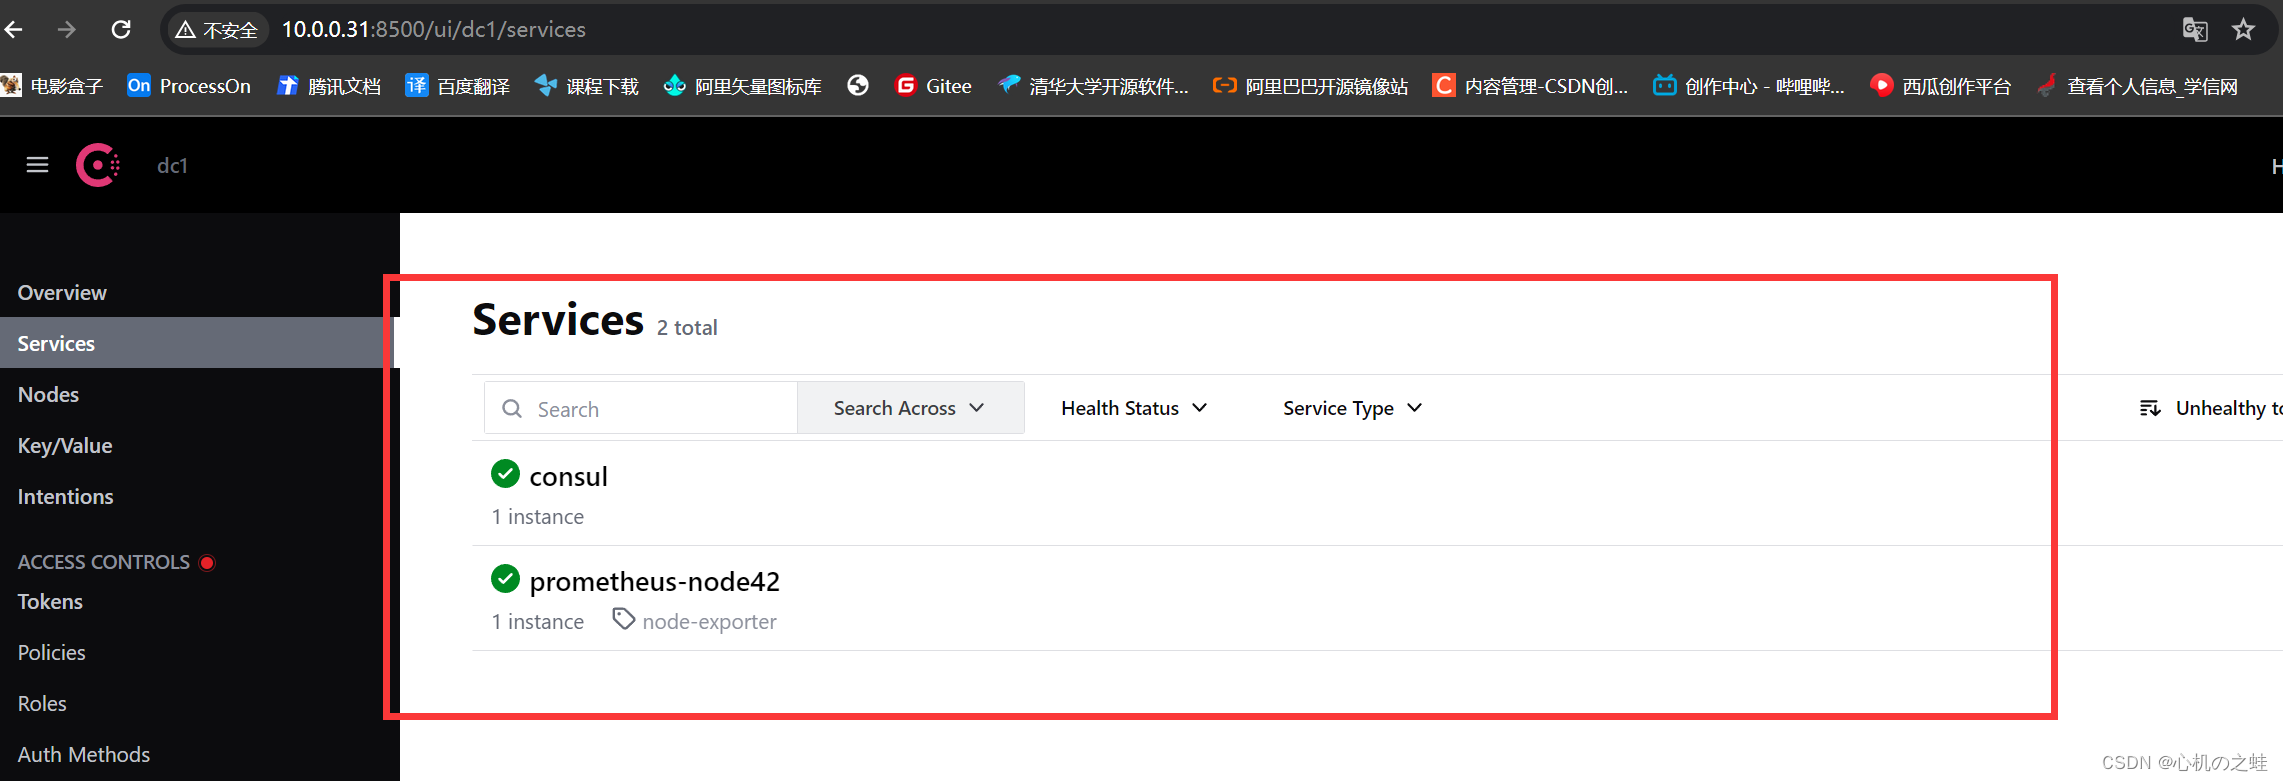
· consul集群頁面查看
42加入成功

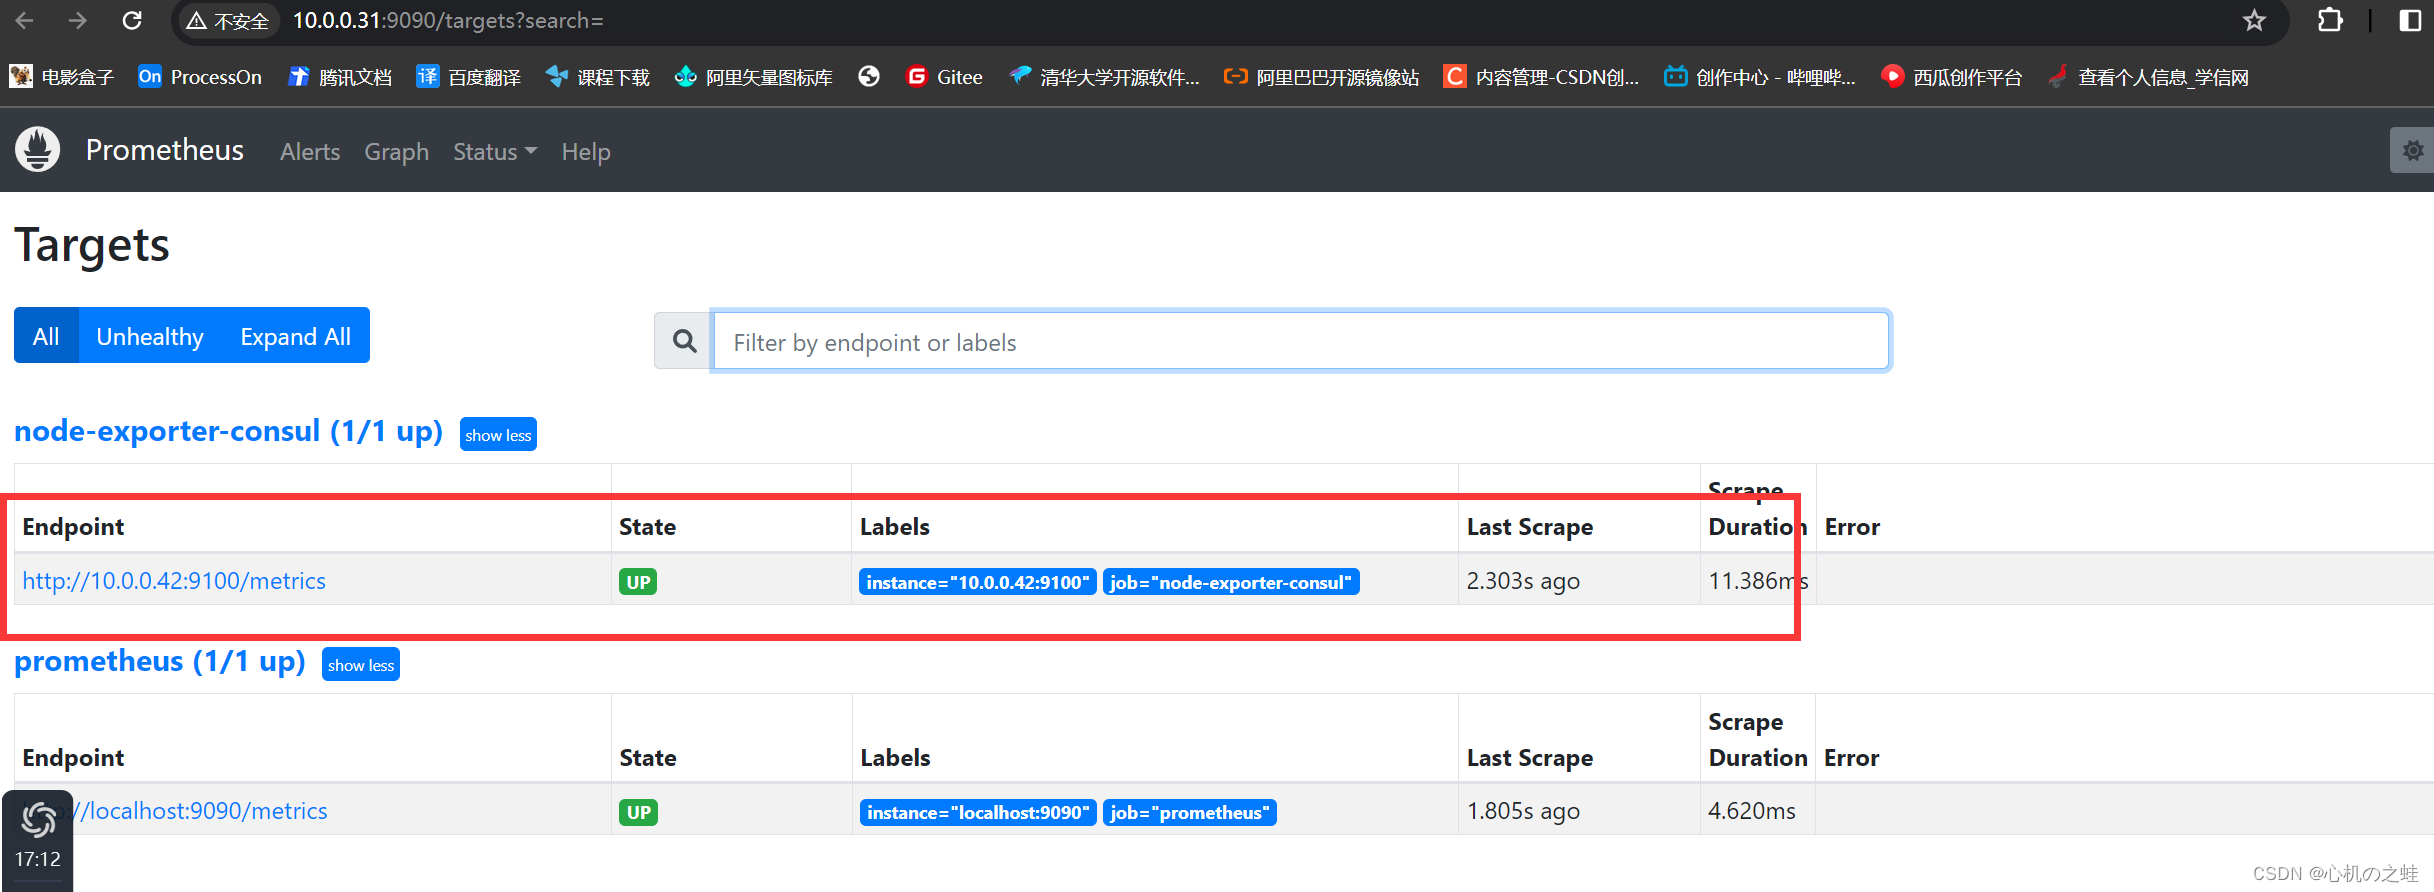
4,prometheus頁面查看
查看是否監控到41和42節點

5,拓展:節點下線consul服務
舉個花生/栗子:節點41下線,不讓prometheus監控了;
注意:
? ? ? ? 我們consul集群中有3臺集群,31、41、71,當被監控節點加入consul時選擇哪個集群節點加入的,那么退出集群時也需要指定加入時的節點;
? ? ? ? 加入指定的31退出也必須指定31.
curl -X PUT http://10.0.0.31:8500/v1/agent/service/deregister/prometheus-node41
四、總結
構建prometheus基于consul局域網絡監控自動發現節點的步驟;
1,構建consul局域網絡集群;
2,被監控節點“加入”consul集群;
3,修改prometheus配置文件,指定consul服務進行監控;
就此,成功了;
###############
至此,prometheus的服務發現,就學習完畢了;
###############
)
)


視覺智能基礎知識:視覺智能常用模型與算法)


NVIC編程)


---數字圖像)
(八))

——排序算法)

