時間序列數據通常以其時間性質為特征。這種時間性質為數據增加了趨勢或季節性,使其與時間序列分析和預測兼容。如果時間序列數據不隨時間變化或沒有時間結構,則稱其為靜態數據。因此,檢查數據是否平穩是非常必要的。在時間序列預測中,如果數據是平穩的,我們就無法從數據中獲得有價值的見解。
靜態數據的示例圖:
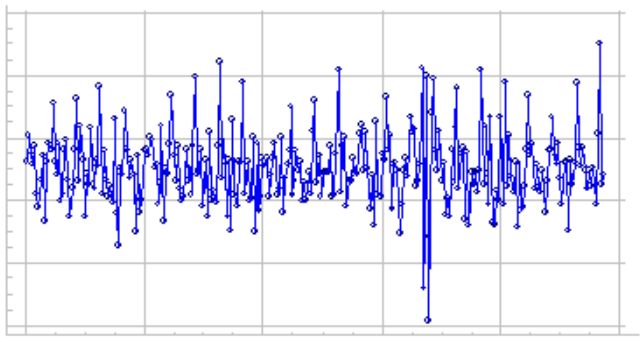
平穩性的類型
當涉及到識別數據是否是平穩的時,這意味著識別數據中平穩性的細粒度概念。在時間序列數據中觀察到的平穩性類型包括:
- 趨勢平穩 :不顯示趨勢的時間序列。
- 季節性平穩(Seasonal Stationary):不顯示季節性變化的時間序列。
- 嚴格平穩:觀測值的聯合分布不隨時間變化。
實現方法及步驟
下面的步驟將讓用戶容易地理解檢查給定時間序列數據是否平穩的方法。
步驟1:繪制時間序列數據
# import python pandas library
import pandas as pd# import python matplotlib library for plotting
import matplotlib.pyplot as plt# read the dataset using pandas read_csv()
# function
data = pd.read_csv("daily-total-female-births-IN.csv",header=0, index_col=0)# use simple line plot to see the distribution
# of the data
plt.plot(data)
輸出
步驟2:評估描述性統計量
這通常是通過將數據分成兩個或多個分區并計算每組的均值和方差來完成的。如果這些一階矩在這些分區之間是一致的,那么我們可以假設數據是平穩的。讓我們使用1949 - 1960年之間的航空公司乘客計數數據集。
# import python pandas library
import pandas as pd# import python matplotlib library for
# plotting
import matplotlib.pyplot as plt# read the dataset using pandas read_csv()
# function
data = pd.read_csv("AirPassengers.csv",header=0, index_col=0)# print the first 6 rows of data
print(data.head(10))# use simple line plot to understand the
# data distribution
plt.plot(data)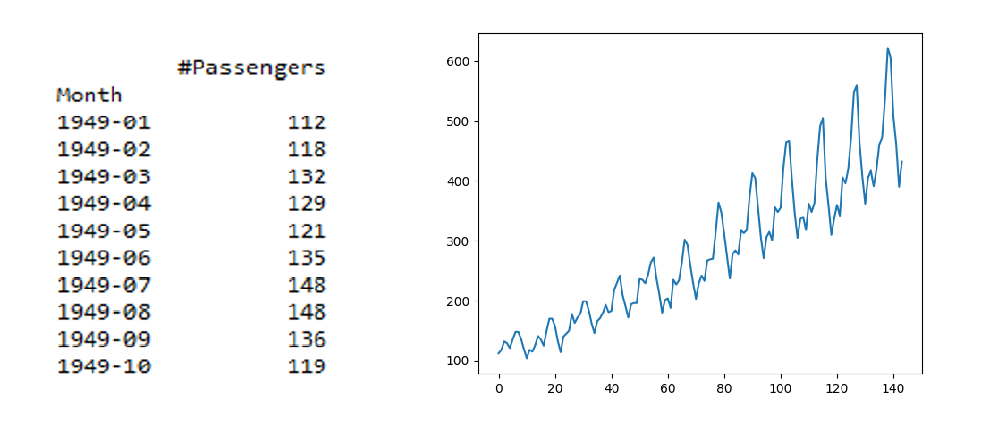
現在,讓我們將這些數據劃分為不同的組,計算不同組的均值和方差,并檢查一致性。
# import the python pandas library
import pandas as pd# use pandas read_csv() function to read the dataset.
data = pd.read_csv("AirPassengers.csv", header=0, index_col=0)# extracting only the air passengers count from
# the dataset using values function
values = data.values# getting the count to split the dataset into 3
parts = int(len(values)/3)# splitting the data into three parts
part_1, part_2, part_3 = values[0:parts], values[parts:(parts*2)], values[(parts*2):(parts*3)]# calculating the mean of the separated three
# parts of data individually.
mean_1, mean_2, mean_3 = part_1.mean(), part_2.mean(), part_3.mean()# calculating the variance of the separated
# three parts of data individually.
var_1, var_2, var_3 = part_1.var(), part_2.var(), part_3.var()# printing the mean of three groups
print('mean1=%f, mean2=%f, mean2=%f' % (mean_1, mean_2, mean_3))# printing the variance of three groups
print('variance1=%f, variance2=%f, variance2=%f' % (var_1, var_2, var_3))
輸出
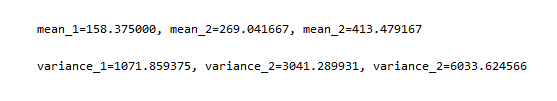
輸出清楚地表明,三組的平均值和方差彼此差異很大,說明數據是非平穩的。例如,如果平均值mean_1 = 150,mean_2 = 160,mean_3 = 155和variance_1 = 33,variance_2 = 35,variance_3 = 37,那么我們可以得出結論,數據是平穩的。有時這種方法可能會對某些分布失敗,如對數范數分布。
讓我們嘗試與上面相同的示例,但使用NumPy的log()函數獲取乘客計數的日志并檢查結果。
# import python pandas library
import pandas as pd# import python matplotlib library for plotting
import matplotlib.pyplot as plt# import python numpy library
import numpy as np# read the dataset using pandas read_csv()
# function
data = pd.read_csv("AirPassengers.csv", header=0, index_col=0)# extracting only the air passengers count
# from the dataset using values function
values = log(data.values)# printing the first 15 passenger count values
print(values[0:15])# using simple line plot to understand the
# data distribution
plt.plot(values)
輸出
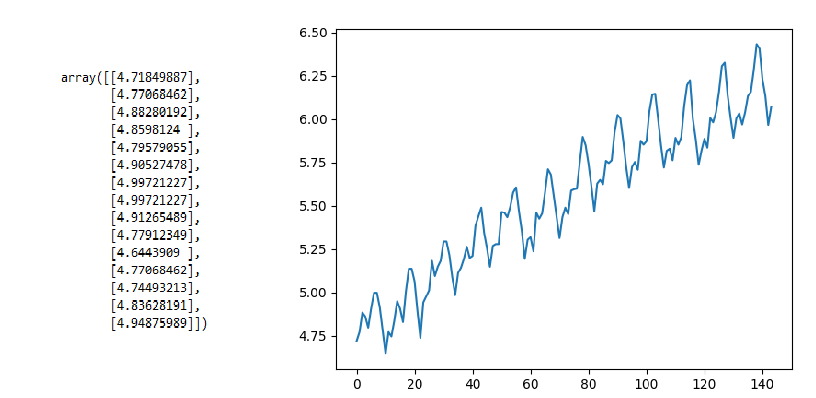
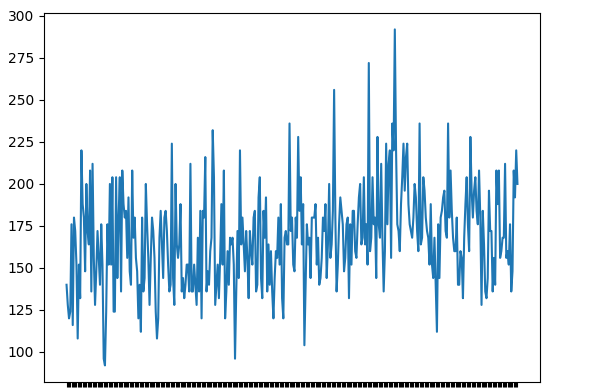
輸出表示有一些趨勢,但不像前面的情況那樣非常陡峭,現在讓我們計算分區均值和方差。
# getting the count to split the dataset
# into 3 parts
parts = int(len(values)/3)# splitting the data into three parts.
part_1, part_2, part_3 = values[0:parts], values[parts:(parts*2)], values[(parts*2):(parts*3)]# calculating the mean of the separated three
# parts of data individually.
mean_1, mean_2, mean_3 = part_1.mean(), part_2.mean(), part_3.mean()# calculating the variance of the separated three
# parts of data individually.
var_1, var_2, var_3 = part_1.var(), part_2.var(), part_3.var()# printing the mean of three groups
print('mean1=%f, mean2=%f, mean2=%f' % (mean_1, mean_2, mean_3))# printing the variance of three groups
print('variance1=%f, variance2=%f, variance2=%f' % (var_1, var_2, var_3))
輸出

理想情況下,我們會期望均值和方差非常不同,但它們是相同的,在這種情況下,這種方法可能會非常失敗。為了避免這種情況,我們有另一個統計測試,下面討論。
步驟3:增強的Dickey-Fuller檢驗
這是一個統計測試,專門用于測試單變量時間序列數據是否平穩。這個測試是基于一個假設,可以告訴我們它可以被接受的概率程度。它通常被歸類為單位根檢驗之一,它決定了一個單變量時間序列數據遵循趨勢的強度。我們來定義零假設和替代假設,
- Ho(假設):時間序列數據是非平穩的
- H1(替代假設):時間序列數據是平穩的
假設α = 0.05,表示(95%置信度)。如果p > 0.05不能拒絕零假設,則用p值解釋檢驗結果,否則如果p <= 0.05則拒絕零假設。現在,讓我們使用相同的航空乘客數據集,并使用stats model包提供的adfuller()統計函數對其進行測試,以檢查數據是否穩定。
# import python pandas package
import pandas as pd# import the adfuller function from statsmodel
# package to perform ADF test
from statsmodels.tsa.stattools import adfuller# read the dataset using pandas read_csv() function
data = pd.read_csv("AirPassengers.csv", header=0, index_col=0)# extracting only the passengers count using values function
values = data.values# passing the extracted passengers count to adfuller function.
# result of adfuller function is stored in a res variable
res = adfuller(values)# Printing the statistical result of the adfuller test
print('Augmneted Dickey_fuller Statistic: %f' % res[0])
print('p-value: %f' % res[1])# printing the critical values at different alpha levels.
print('critical values at different levels:')
for k, v in res[4].items():print('\t%s: %.3f' % (k, v))
輸出
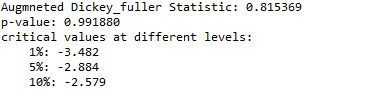
根據我們的假設,ADF統計量遠遠大于不同水平的臨界值,并且p值也大于0.05,這意味著我們無法在90%,95%和99%的置信度下拒絕零假設,這意味著時間序列數據是強非平穩的。
現在,讓我們嘗試對log normed值運行ADF測試,并交叉檢查我們的結果。
# import python pandas package
import pandas as pd# import the adfuller function from statsmodel
# package to perform ADF test
from statsmodels.tsa.stattools import adfuller# import python numpy package
import numpy as np# read the dataset using pandas read_csv() function
data = pd.read_csv("AirPassengers.csv", header=0, index_col=0)# extracting only the passengers count using
# values function and applying log transform on it.
values = log(data.values)# passing the extracted passengers count to adfuller function.
# result of adfuller function is stored in a res variable
res = adfuller(values)# Printing the statistical result of the adfuller test
print('Augmneted Dickey_fuller Statistic: %f' % res[0])
print('p-value: %f' % res[1])# printing the critical values at different alpha levels.
print('critical values at different levels:')
for k, v in res[4].items():print('\t%s: %.3f' % (k, v))
輸出
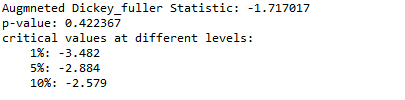
正如你所看到的,ADF測試再次顯示ADF統計量在不同水平上遠遠大于臨界值,并且p值也遠遠大于0.05,這意味著我們無法在90%,95%和99%的置信度下拒絕零假設,這意味著時間序列數據是強非平穩的。
因此,ADF單位根檢驗是檢查時間序列數據是否平穩的魯棒性檢驗。


)


)

)
)


入門)