文獻速遞:帕金森的疾病分享–多模態機器學習預測帕金森病
Title
題目
Multi-modality machine learning predicting Parkinson’s disease
多模態機器學習預測帕金森病
01
文獻速遞介紹
對于漸進性神經退行性疾病,早期和準確的診斷是有效開發和使用新干預措施的關鍵。這種早期檢測范式旨在在患者認識到癥狀和體征之前,當疾病過程最容易接受干預時,識別、分析并防止或管理疾病。
這里我們描述的工作通過數據驅動的方式使用成本效益高的方法促進準確和早期診斷。這份報告還描述了在促進生產規模分析多模態基因組和臨床數據的背景下,應用一個開源自動機器學習(ML),GenoML,的情況。
國家人類基因組研究所發布的最新戰略愿景聲明,到2030年,表觀遺傳學和轉錄組學的特征將常規地納入到基因型對表型影響的預測模型中。生物醫學研究人員目前正處于兩項科學進展的交匯點,這將促進早期檢測和遠程識別潛在高風險個體:首先,大量臨床、人口統計和遺傳/基因組數據集的可用性;其次,機器學習(ML)流程自動化和人工智能的進展,以最大化利用這些大量的、容易獲得的數據的價值。
首次就診時的正確臨床診斷,只有80%在病理學上確認為帕金森病(PD)。以前的生物標志物研究,特別是在神經退行性疾病中,主要關注廣為人知的統計方法和線性模型,使用單一指標或少數幾個指標進行預測。在過去幾年中,多項研究使用ML探索了不同的模態,如CSF生物標志物、成像、RNA或包括與運動相關的指標,甚至可穿戴傳感器數據。雖然這些努力在分類上表現良好,但我們尋求基于相對低成本且容易獲得的數據構建模型。
Results
結果
We have shown that integrating multiple modalities improved model performance in predicting PD diagnosis in a mixed population of cases and controls. For a summary of basic clinical and demographic features, please refer to Table 1 and for a summary of the analysis, please refer to Fig. 1. Additional information in regards to cohorts and interpretation for ML metrics and models are included in Supplementary Notes 2, 3. Our multi-modality model showed a higher area under the curve (AUC;89.72%) than just the clinico-demographic data available prior to neurological assessment (87.52%), the genetics-only model from genome sequencing data and polygenic risk score (PRS; 70.66%), or the transcriptomics-only model from genome-wide whole blood RNA sequencing data (79.73%) in withheld PPMI samples(see Table 2 and Fig. 2 for summaries). This model’s performance improved after tuning, described below and in Table 3, where the mean AUC metric in the untuned model in PPMI is 80.75 with a standard deviation of 8.84 (range = 69.44–88.51) and the mean AUC at tuning in PPMI is 82.17 with a standard deviation of 8.96 (range = 70.93–90.17). Similar improvements can be seen when this model is validated in the PDBP dataset (AUC from the combined modality model at 83.84% before tuning) detailed in Table 4 and Fig. 3. Additionally, the multimodal model also had the lowest false positive and false negative rates compared to other models, only focusing on a single modality, in both the withheld test set in PPMI and in the PDBP validation set. Thus, moving from single to multiple data modalities yielded better results in not only AUC but across all performance metrics
結合多種模態的預測超越了基于單一模態的預測
我們已經展示了,將多種模態整合在一起可以提高模型在混合病例和對照組人群中預測PD診斷的性能。關于基本臨床和人口統計特征的摘要,請參見表1,關于分析的摘要,請參見圖1。關于隊列和解釋ML指標及模型的附加信息包含在補充說明2、3中。我們的多模態模型顯示出的曲線下面積(AUC;89.72%)高于僅有的臨床-人口統計數據(在神經學評估之前可獲得的數據;87.52%)、僅基因組測序數據和多基因風險評分(PRS;70.66%)的遺傳學模型,或僅來自全基因組全血RNA測序數據的轉錄組學模型(79.73%)在保留的PPMI樣本中(見表2和圖2以獲取摘要)。在調整后,此模型的性能得到改善,如下所述及表3中,未調整模型在PPMI的平均AUC指標為80.75,標準差為8.84(范圍=69.44–88.51),而在PPMI調整后的平均AUC為82.17,標準差為8.96(范圍=70.93–90.17)。當這個模型在PDBP數據集中得到驗證時,可以看到類似的改進(調整前結合模態模型的AUC為83.84%),詳細內容見表4和圖3。此外,與其他僅關注單一模態的模型相比,多模態模型在保留的PPMI測試集和PDBP驗證集中都具有最低的假陽性和假陰性率。因此,從單一數據模態轉向多種數據模態不僅在AUC上,而且在所有性能指標上都取得了更好的結果。
Fig
圖

Fig. 1 Workflow and Data Summary. Scientific notation in the workflow diagram denotes minimum p values from reference GWAS or differential expression studies as a pre-screen for feature inclusion. Blue indicates subsets of genetics data (also denoted as “G”), green indicates subsets of transcriptomics data (also denoted as *omics or “O”), yellow indicates clinico-demographic data (also denoted as C + D),and purple indicates combined data modalities. PD Parkinson’s disease, AMP-PD accelerating medicines partnership in Parkinson’s disease, PPMI Parkinson’s progression marker initiative, PDBP Parkinson’s disease biomarker program, WGS whole-genome sequencing, GWAS genome-wide association study, QC quality control, MAF minor allele frequency, PRS polygenic risk score.
圖1 工作流程和數據摘要。工作流程圖中的科學記號表示來自參考GWAS或差異表達研究的最小p值,作為特征包含的預篩選。藍色表示遺傳數據子集(也標記為“G”),綠色表示轉錄組數據子集(也標記為*組學或“O”),黃色表示臨床-人口統計數據(也標記為C + D),紫色表示結合了數據模態。PD帕金森病,AMP-PD加速醫藥合作伙伴關系帕金森病項目,PPMI帕金森病進展標志物計劃,PDBP帕金森病生物標志物計劃,WGS全基因組測序,GWAS全基因組關聯研究,QC質量控制,MAF小等位基因頻率,PRS多基因風險評分。
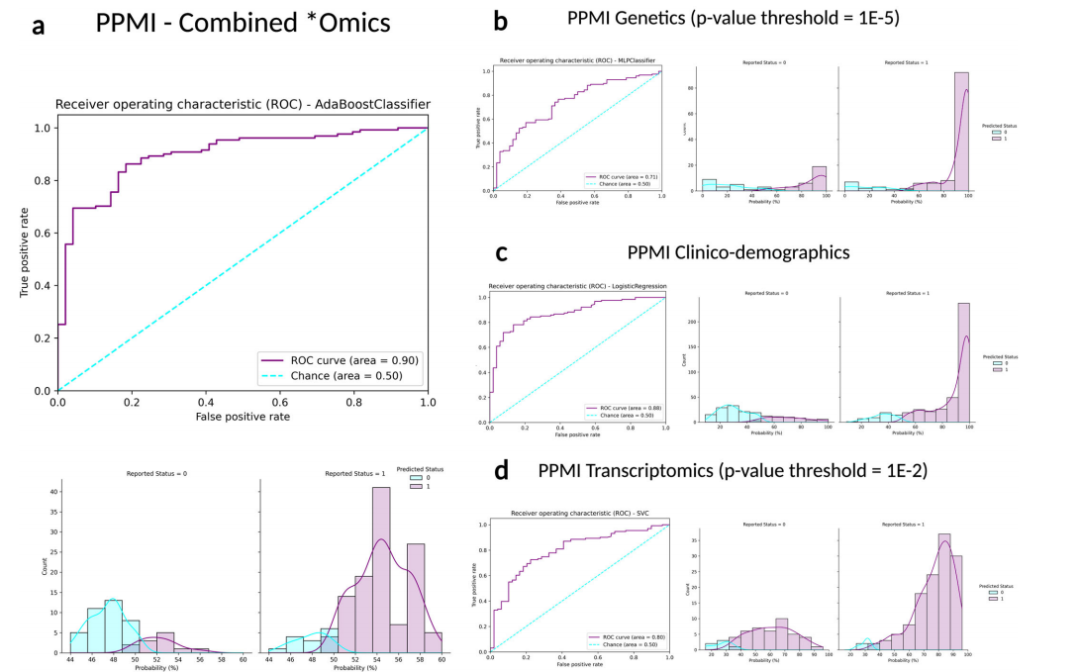
Fig. 2Receiver operating characteristic curves and case probability density plots in withheld training samples at default thresholds comparing performance metrics in different data modalities from the PPMI dataset. P values mentioned indicate the threshold of
significance used per datatype, except for the inclusion of all clinico-demographic features. a PPMI combined *omics dataset (genetics p value threshold = 1E-5, transcriptomics p value threshold = 1E-2, and clinico-demographic information); b PPMI genetics-only dataset (p value threshold = 1E-5); c PPMI clinico-demographics only dataset; d PPMI transcriptomics-only dataset (p value threshold = 1E-2). Note that x-axis limits may vary as some models produce less extreme probability distributions than others inherently based on fit to the input data and the algorithm used, further detailed images are included in Supplementary Fig. 5. PPMI Parkinson’s progression marker initiative, ROC receiver operating characteristic curve.
圖2 在默認閾值下,比較PPMI數據集中不同數據模態的性能指標,保留訓練樣本中的接收器操作特征曲線和案例概率密度圖。提到的P值表示每種數據類型使用的顯著性閾值,除了包含所有臨床-人口統計特征外。a PPMI綜合*組學數據集(遺傳學P值閾值=1E-5,轉錄組學P值閾值=1E-2,以及臨床-人口統計信息);b PPMI僅遺傳學數據集(P值閾值=1E-5);c PPMI僅臨床-人口統計數據集;d PPMI僅轉錄組學數據集(P值閾值=1E-2)。請注意,x軸的限制可能會有所不同,因為一些模型基于對輸入數據的適應度和使用的算法,天生就會產生比其他模型更不極端的概率分布,更詳細的圖像包含在補充圖5中。PPMI帕金森病進展標志物計劃,ROC接收器操作特征曲線。
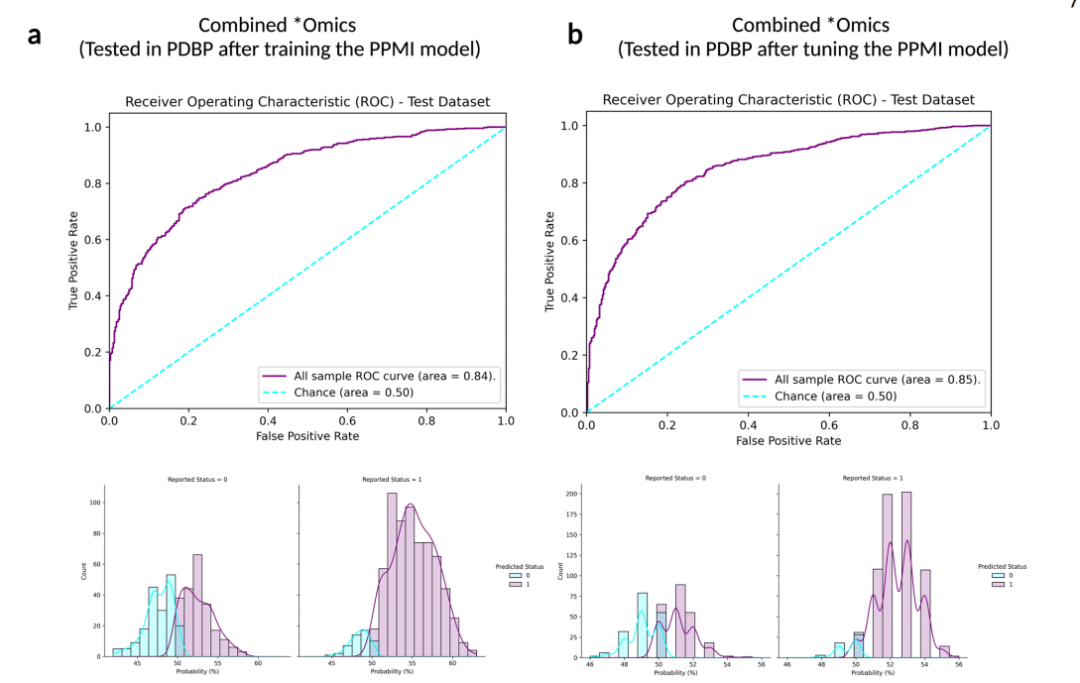
Fig. 3Receiver operating characteristic and case probability density plots in the external dataset (PDBP) at validation for the trained and then tuned models at default thresholds. Probabilities are predicted case status (r1), so controls (status of 0) skews towards more samples on the left, and positive PD cases (status of 1) skews more samples on the right. a Testing in PDBP the combined *omics model (genetics p value threshold = 1E-5, transcriptomics p value threshold = 1E-2, and clinico-demographic information) developed in PPMI prior to tuning the hyperparameters of the model; b Testing in PDBP the combined *omics model (genetics p value threshold = 1E-5, transcriptomics p value threshold = 1E-2, and clinico-demographic information) developed in PPMI after tuning the hyperparameters of the model. PPMI Parkinson’s progression marker initiative, PDBP Parkinson’s disease biomarker program, ROC receiver operating characteristic curve.
圖3在外部數據集(PDBP)上對訓練并調整后的模型進行驗證時的接收器操作特征和案例概率密度圖,使用默認閾值。概率預測的是案例狀態(r1),因此對照組(狀態為0)的樣本偏向左側,陽性PD案例(狀態為1)的樣本偏向右側。a 在PDBP測試結合組學模型(遺傳學P值閾值=1E-5,轉錄組學P值閾值=1E-2,以及臨床-人口統計信息),該模型在PPMI中開發,在調整模型的超參數之前;b 在PDBP測試結合組學模型(遺傳學P值閾值=1E-5,轉錄組學P值閾值=1E-2,以及臨床-人口統計信息),該模型在PPMI中開發,調整模型的超參數之后。PPMI帕金森病進展標志物計劃,PDBP帕金森病生物標志物項目,ROC接收器操作特征曲線。
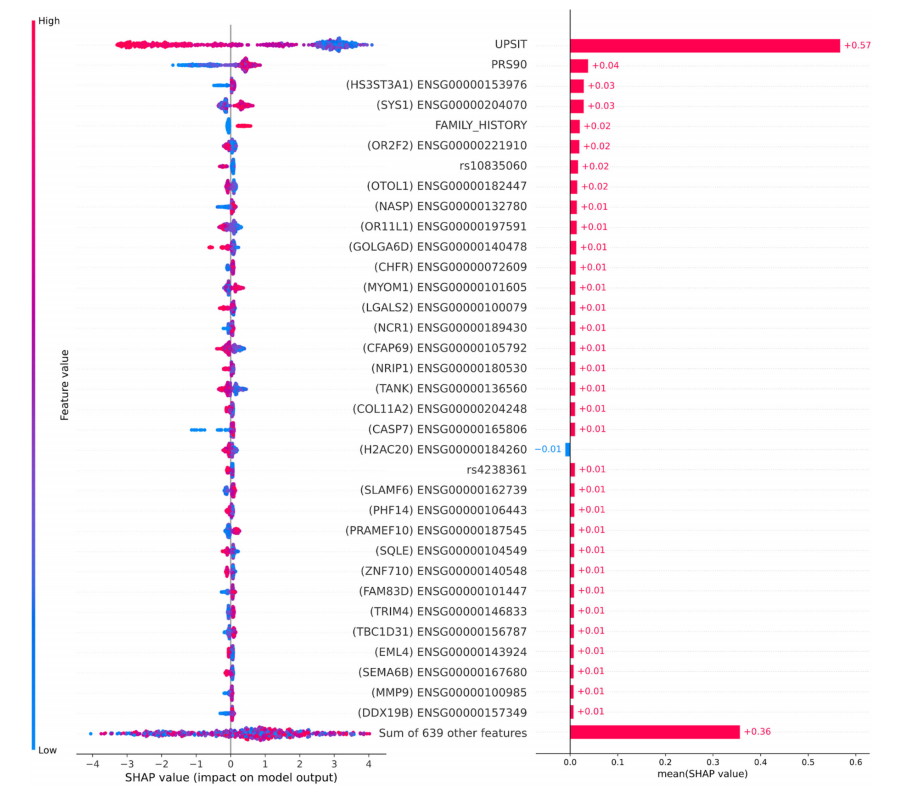
Fig. 4Feature importance plots for top 5% of features in data. The plot on the left has lower values indicated by the color blue, while higher values are indicated in red compared to the baseline risk estimate. Plot on the right indicates directionality, with features predicting for cases indicated in red, while features better-predicting controls are indicated in blue. SHAP Shapley values, UPSIT University of Pennsylvania smell identification test, PRS polygenic risk score.
圖4數據中前5%特征的特征重要性圖。左側的圖中,較低的值用藍色表示,而較高的值與基線風險估計相比用紅色表示。右側的圖表明方向性,預測案例的特征用紅色表示,而更好地預測對照組的特征用藍色表示。SHAP沙普利值,UPSIT賓夕法尼亞大學嗅覺識別測試,PRS多基因風險評分。
Table
表
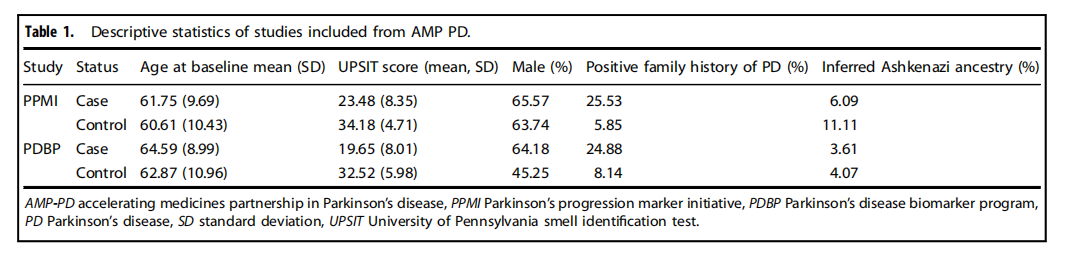
Table 1.Descriptive statistics of studies included from AMP PD.
表1.包含自AMP PD的研究的描述性統計。
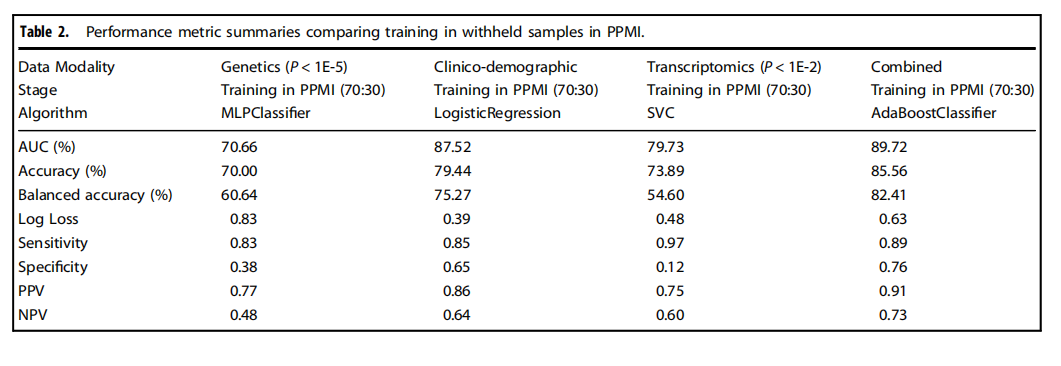
Table 2.Performance metric summaries comparing training in withheld samples in PPMI.
表2.比較在PPMI中保留樣本訓練的性能指標摘要。
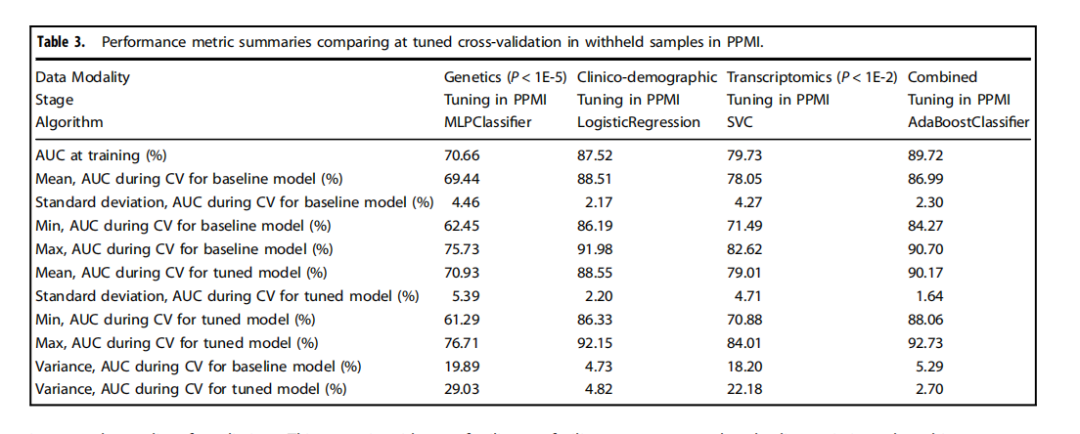
Table 3.Performance metric summaries comparing at tuned cross-validation in withheld samples in PPMI.
表3.比較在PPMI中保留樣本的調整后交叉驗證的性能指標摘要。
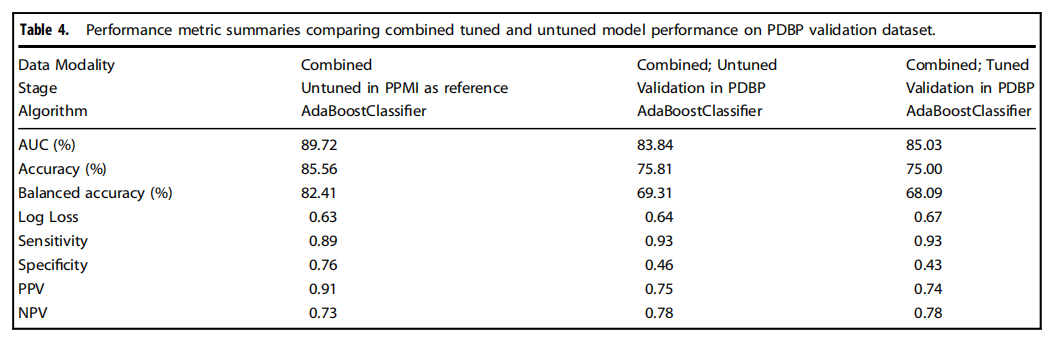
Table 4.Performance metric summaries comparing combined tuned and untuned model performance on PDBP validation dataset.
表4.比較在PDBP驗證數據集上結合調整和未調整模型性能的性能指標摘要。
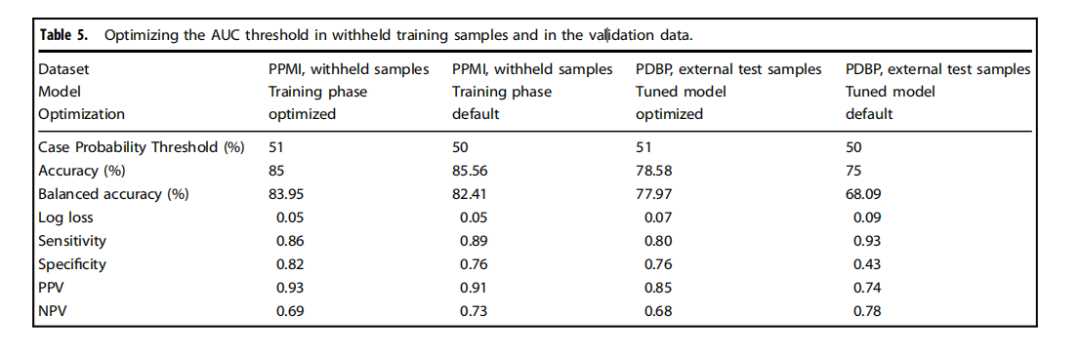
Table 5.Optimizing the AUC threshold in withheld training samples and in the validation data.
表5.在保留的訓練樣本和驗證數據中優化AUC閾值


)


處理高光譜及多光譜遙感數據)


)
)
![【PyTorch][chapter 20][李宏毅深度學習]【無監督學習][ GAN]【實戰】](http://pic.xiahunao.cn/【PyTorch][chapter 20][李宏毅深度學習]【無監督學習][ GAN]【實戰】)


)

