There are the following types of labels,
標簽有以下幾種,
1)X軸貼標 (1) X-axis labelling)
plt.xlabel('Number Line')
# Default labelling
plt.xlabel('Number Line', color='green')
#Font colour Changed
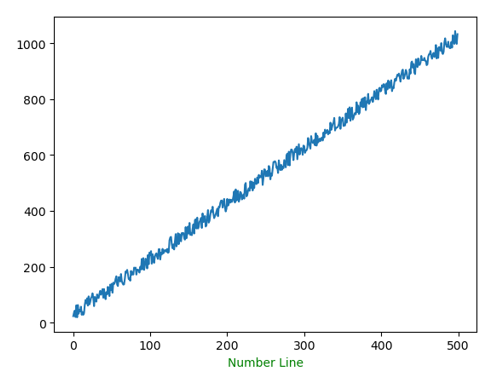
plt.xlabel('Number Line', color='Green', fontsize=15)
#Font size Change
plt.xlabel('Number Line', color='Green', fontsize=15, bbox=dict(facecolor='yellow', alpha=0.5))
#Background Box Addition with opaque ratio
2)Y軸貼標 (2) Y-axis labelling)
plt.ylabel('Function')
#Default Labelling
plt.xlabel('Function', color='green')
#Colour Change
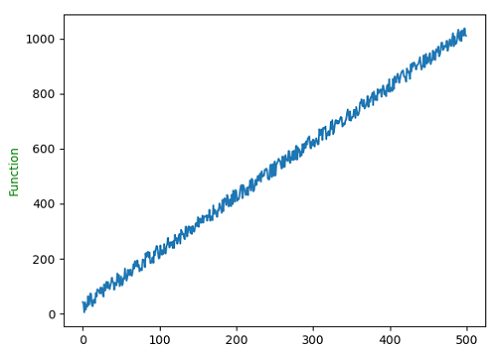
plt.xlabel('Function', color='Green', fontsize=15)
#Font Size Modification
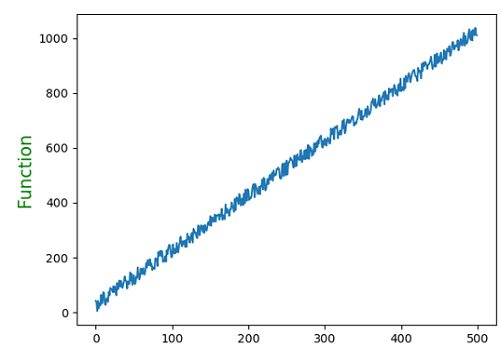
plt.xlabel('Function', color='Green', fontsize=15, bbox=dict(facecolor='yellow', alpha=0.5))
#Background Box Addition with opaque ratio
pythion代碼演示pyplot標簽示例 (Pythion code to demonstrate example of pyplot labelling)
import numpy as np
import matplotlib.pyplot as plt
x = np.arange(500)
y1 = np.arange(500)
for i in range(500):
y1[i] = 2*x[i] + np.random.randint(0,56)
#x-axis labelling
#default
plt.figure()
plt.plot(x,y1)
plt.xlabel('Number Line')
#Colour
plt.figure()
plt.plot(x,y1)
plt.xlabel('Number Line', color='green')
#size
plt.figure()
plt.plot(x,y1)
plt.xlabel('Number Line', color='Green', fontsize=15)
#Background Box
plt.figure()
plt.plot(x,y1)
plt.xlabel('Number Line', color='Green', fontsize=15, bbox=dict(facecolor='yellow', alpha=0.5))
#y-axis labelling
#default
plt.figure()
plt.plot(x,y1)
plt.ylabel('Function')
#Colour
plt.figure()
plt.plot(x,y1)
plt.ylabel('Function', color='g')
#size
plt.figure()
plt.plot(x,y1)
plt.ylabel('Function', color='Green', fontsize=15)
#Background Box
plt.figure()
plt.plot(x,y1)
plt.ylabel('Function', color='Green', fontsize=15, bbox=dict(facecolor='yellow', alpha=0.5))
Output:
輸出:
Output is as figure
翻譯自: https://www.includehelp.com/python/pyplot-labelling.aspx


)

![[轉載] python 簡單示例說明os.walk和os.path.walk的不同](http://pic.xiahunao.cn/[轉載] python 簡單示例說明os.walk和os.path.walk的不同)


![[轉載] Python3.X 線程中信號量的使用方法示例](http://pic.xiahunao.cn/[轉載] Python3.X 線程中信號量的使用方法示例)


![[轉載] Python京東搶購](http://pic.xiahunao.cn/[轉載] Python京東搶購)


![[轉載] python通過adb獲取android手機耗電量](http://pic.xiahunao.cn/[轉載] python通過adb獲取android手機耗電量)
 變量的解構賦值。默認值)

![[轉載] 基于LSTM的股票預測模型_python實現_超詳細](http://pic.xiahunao.cn/[轉載] 基于LSTM的股票預測模型_python實現_超詳細)
