分布分析用于研究數據的分布特征,常用分析方法:
1、極差
2、頻率分布
3、分組組距及組數
df = pd.DataFrame({'編碼':['001','002','003','004','005','006','007','008','009','010','011','012','013','014','015'],\'小區':['A村','B村','C村','D村','E村','A村','B村','C村','D村','E村','A村','B村','C村','D村','E村'],\'朝向':['south','east_north','south','east_south','eath_south','north','east_north','west_north','south','west','north','east_north','south','south','east'],\'單價':[7374,6435,6643,5874,6738,6453,5733,6034,5276,5999,6438,5864,6099,5699,6999],\'首付':[15,7.5,18,10,30,10,18,30,40,30,20,22,29,30,40],\'總價':[50,65,68,73,80,55,45,70,59,57,40,60,50,48,60],\'經度':[114.0,114.6,114.8,114.2,114.5,114.3,114.4,114.7,114.9,114.1,114.8,114.2,114.5,114.3,114.8],\'緯度':[22.0,22.4,22.6,22.8,22.2,22.1,22.7,22.5,22.9,22.3,22.8,22.2,22.1,22.7,22.5] }) ?
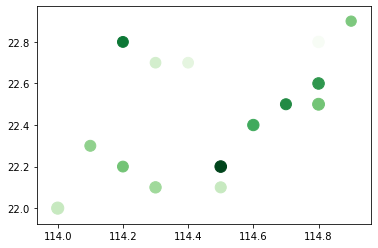
先對總體做關于經緯度的散點圖
plt.scatter(df['經度'],df['緯度'],s = df['單價']/50,c = df['總價'],cmap='Greens') #原點的大小可以表示單價,越大單價越高;顏色深淺可以表示總價,越深總價越高
?
?求總價、單價和首付的極差
def d_range(df,*cols):krange = []for c in cols:crange = df[c].max() - df[c].min()krange.append(crange)return ('%s極差:%s\n%s極差:%s\n%s極差:%s'%(cols[0],krange[0],cols[1],krange[1],cols[2],krange[2]))
print(d_range(df,'總價','單價','首付'))
# 總價極差:40
# 單價極差:2098
# 首付極差:32.5
?
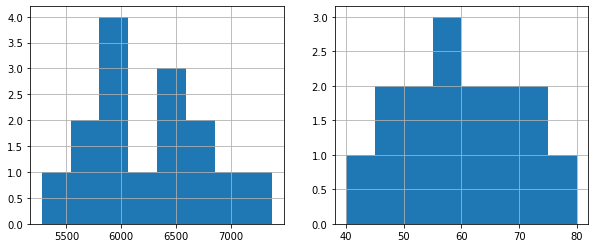
單價和總價的頻率分布
fig,axes = plt.subplots(1,2,figsize = (10,4))
df['單價'].hist(bins = 8,ax = axes[0])
df['總價'].hist(bins = 8,ax = axes[1])
?
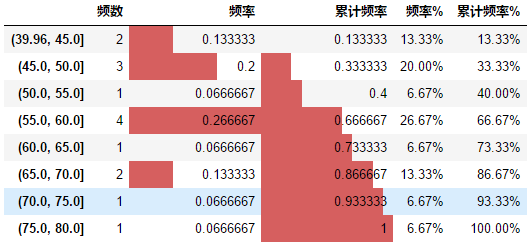
將總價分為8個區間,求出每個區間的頻數、頻率,并求出累計頻率
# 頻率分布,分組區間
total_range = pd.cut(df['總價'],8)   #通過cut將總價分為8個區間
total_range_count = total_range.value_counts(sort=False)   #求每個區間的個數,結果為一個Seris,不按列的大小排序
total_range_s = pd.DataFrame(total_range_count)  #將Seris轉化為DataFrame,生成一個用于統計總價的DataFrame
# # total_range_s.rename(columns = {total_range_count.name:'頻數',inplace = True})
total_range_s.columns = ['頻數']  #給轉化后的DataFrame重命名列
df['區間'] = total_range.values  #給原數據加一列區間
total_range_s['頻率'] = total_range_s['頻數']/total_range_s['頻數'].sum()  #求總價在每個區間出現的頻率
total_range_s['累計頻率'] = total_range_s['頻率'].cumsum()   ##求總價在每個區間的累計頻率
total_range_s['頻率%'] = total_range_s['頻率'].apply(lambda x:'%.2f%%'%(100*x))  #格式化頻率列,顯示為2位百分數
total_range_s['累計頻率%'] = total_range_s['累計頻率'].apply(lambda x:'%.2f%%'%(100*x))#格式化頻率列,顯示為2位百分數
total_range_s.style.bar(subset = ['頻率','累計頻率'])
?
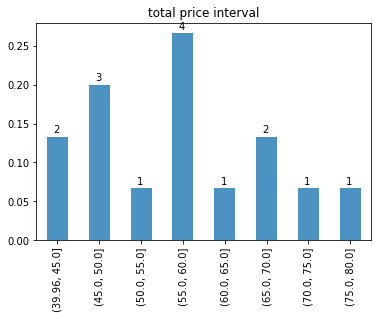
?對每個總價區間出現的頻率做柱狀圖
total_range_s['頻率'].plot(kind = 'bar',alpha = 0.8,title ='total price interval')
x = range(len(total_range_s.index))
for i,j,k in zip(x,total_range_s['頻率'],total_range_s['頻數']):plt.text(i,j+0.01,k)
?
?
對于單個字段比如朝向,做頻率統計分析
# 頻率分布 定性字段
cx = df['朝向'].value_counts()
cx_s = pd.DataFrame(cx)
cx_s.columns = ['頻數']
cx_s['頻率'] = cx_s['頻數']/cx_s['頻數'].sum()
cx_s['累計頻率'] = cx_s['頻率'].cumsum()
cx_s['頻率%'] = cx_s['頻率'].apply(lambda x:'%.2f%%'%(100*x))
cx_s['累計頻率%'] = cx_s['累計頻率'].apply(lambda x:'%.2f%%'%(100*x))
cx_s.style.bar(subset = ['頻率','累計頻率'] )

?
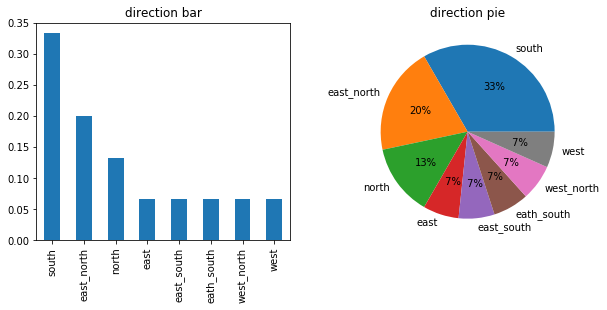
?對朝向做柱狀圖和餅圖
fig,axes = plt.subplots(1,2,figsize = (10,4))
cx_s['頻率'].plot(kind = 'bar',ax = axes[0],title = 'direction bar')   plt.pie(cx_s['頻數'],labels=cx_s.index,autopct='%2.f%%')
plt.title('direction pie')
?
之全面總結Android Studio2.X的填坑指南)


)


)


