對比分析是對兩個互相聯系的指標進行比較。
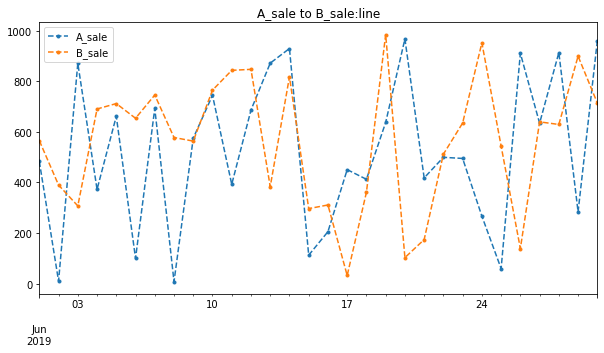
絕對數比較(相減):指標在量級上不能差別過大,常用折線圖、柱狀圖
相對數比較(相除):結構分析、比例分析、空間比較分析、動態對比分析
?
df = pd.DataFrame(np.random.rand(30,2)*1000,columns=['A_sale','B_sale'],index = pd.date_range('2019/6/1','2019/6/30'))
df.style.format({'A':'{:.2f}','B':'{:.2f}'})
?
#
df.plot(figsize = (10,5),linestyle ='--',title ='A_sale to B_sale:line',marker = '.')
df.plot(kind = 'bar',figsize = (12,5),title = 'A_sale to B_sale:bar',width = 0.8,alpha = 0.8)
 ??
??
?
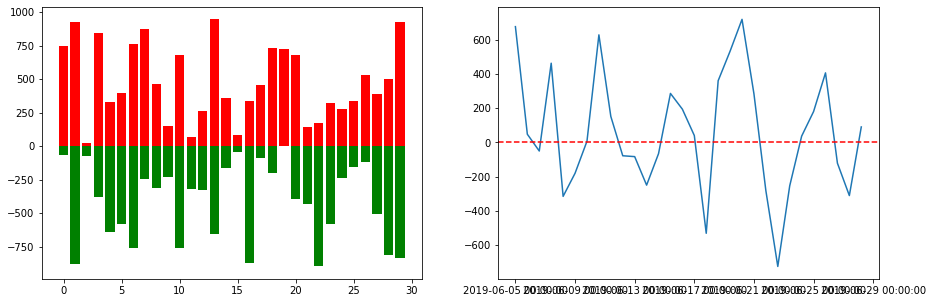
x = range(len(df))
y1 = df['A_sale']
y2 = -df['B_sale']fig,axes = plt.subplots(1,2,figsize = (15,5))
ax1 = axes[0]
ax1.bar(x,y1,facecolor = 'r')
ax1.bar(x,y2,facecolor = 'g')ax2 = axes[1]
y3 = df['A_sale'] - df['B_sale']
ax2.plot(x,y3)
plt.axhline(0,linestyle = '--',color = 'r')   #在y值為0處生成一條水平線
ax2.set_xticklabels(df.index[::4])
?
?
?
https://www.cnblogs.com/shengyang17/p/9630749.html


)


)


)

