power bi中的切片器
Just recently, while presenting my session: “Magnificent 7 — Simple tricks to boost your Power BI Development” at the New Stars of Data conference, one of the questions I’ve received was:
就在最近,在“新數據之星”會議上介紹我的會議: “壯麗的7 —促進Power BI開發的簡單技巧”時,我收到的問題之一是:
根據頁面上的切片器選擇,是否可以顯示實際的活動過濾器? (Is there a way to show the actual active filters as a result of the slicer choices on the page?)
I’ve already answered the question in this article, but then I thought: maybe more people search for the solution to this problem, so I decided to write a short post to explain in detail how you can achieve this.
我已經在本文中回答了這個問題,但是后來我想:也許更多的人正在尋找解決這個問題的方法,所以我決定寫一篇簡短的文章來詳細說明如何實現此目的。
As usual, I will use a sample Contoso database for demo purposes:
和往常一樣,我將使用示例Contoso數據庫進行演示:
DAX是您的朋友! (DAX is your friend!)
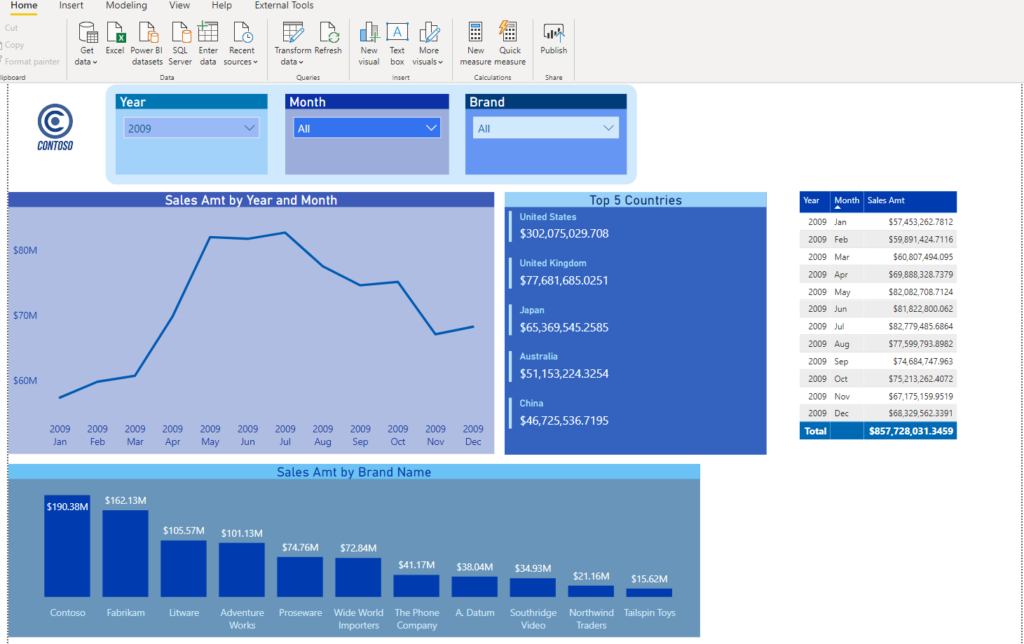
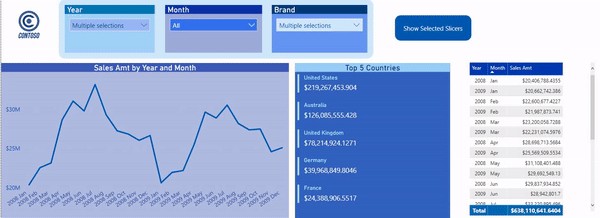
This is the starting point. You can notice three slicers on the report canvas, and let’s say that I want to show my users which brands are selected within Brands slicer.
這是起點。 您可以在報表畫布上注意到三個切片器,并且假設我要向用戶顯示在“品牌”切片器中選擇了哪些品牌。
The first step is to create a DAX measure that will capture all selected values in the slicer. You can use two different DAX functions to obtain the values: VALUES() or DISTINCT(). VALUES() function is more complex since you can use both table name and column name as an argument, but let’s focus here on the column name as an argument.
第一步是創建一個DAX度量,它將捕獲切片器中的所有選定值。 您可以使用兩個不同的DAX函數來獲取值: VALUES()或DISTINCT() 。 VALUES()函數更加復雜,因為您可以將表名和列名都用作參數,但是在這里,我們將重點放在列名作為參數上。
Basically, VALUES() will return all distinct values from the column we passed, including blanks (if exist)! On the other hand, DISTINCT() will return all distinct values but ignoring blank values. Which one you want to use, depends mostly on the business request (if your users want to see numbers for blanks or not). Personally, I prefer to use VALUES(), because it gives me the full picture.
基本上, VALUES()將返回我們傳遞的列中的所有不同值,包括空格(如果存在)! 另一方面, DISTINCT()將返回所有不同的值,但忽略空白值。 您要使用哪一個,主要取決于業務請求(如果您的用戶希望查看是否為空白的數字)。 就個人而言,我更喜歡使用VALUES() ,因為它可以給我完整的畫面。
So, I will create the following measure:
因此,我將創建以下措施:
Selected Brands = VALUES('Product'[BrandName])Now, when I put this measure in the Card visual, let’s see what happens:
現在,當我將此度量放入Card視覺中時,讓我們看看會發生什么:
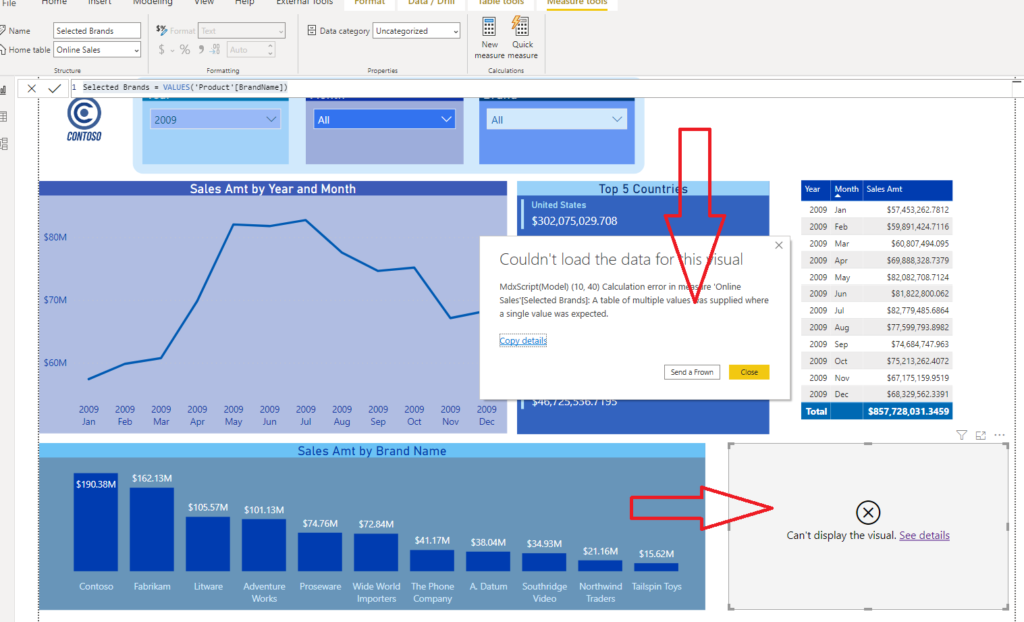
Oops, that gives me an error! Error message explains that the calculation expects a single value. The problem is that VALUES() and DISTINCT() return TABLE! However, it’s not a “normal” table, it’s virtual table created on the fly by DAX engine, so we should apply some additional calculations in order to extract single values from it.
糟糕,這給了我一個錯誤! 錯誤消息說明計算需要單個值。 問題是VALUES()和DISTINCT()返回TABLE! 但是,它不是“普通”表,而是由DAX引擎動態創建的虛擬表,因此我們應該應用一些其他計算,以便從中提取單個值。
迭代器功能可以解救! (Iterator functions to the rescue!)
Iterator functions do what their name says — they iterate over the table and apply the calculation row by row! Iterator functions have X in the end: SUMX, AVERAGEX, COUNTX…In our scenario, we need to iterate over our distinct values and concatenate them into our string, which will be later displayed in the report. To achieve that, we will use CONCATENATEX() function.
迭代器函數按其名稱所述執行操作-遍歷表并逐行應用計算! 迭代器函數的末尾有X:SUMX,AVERAGEX,COUNTX…在我們的方案中,我們需要遍歷不同的值并將它們連接到我們的字符串中,然后將其顯示在報告中。 為此,我們將使用CONCATENATEX()函數。
This function accepts three arguments: the first is a table that we want to iterate on (in our case, a virtual table created using VALUES() function), then expression we are applying row by row on this table, and finally delimiter we want to use for separating extracted values.
該函數接受三個參數:第一個是要迭代的表(在本例中,是使用VALUES()函數創建的虛擬表),然后在表中逐行應用表達式,最后使用所需的定界符用于分離提取的值。
Selected Brands = CONCATENATEX(
VALUES('Product'[BrandName]),
'Product'[BrandName],
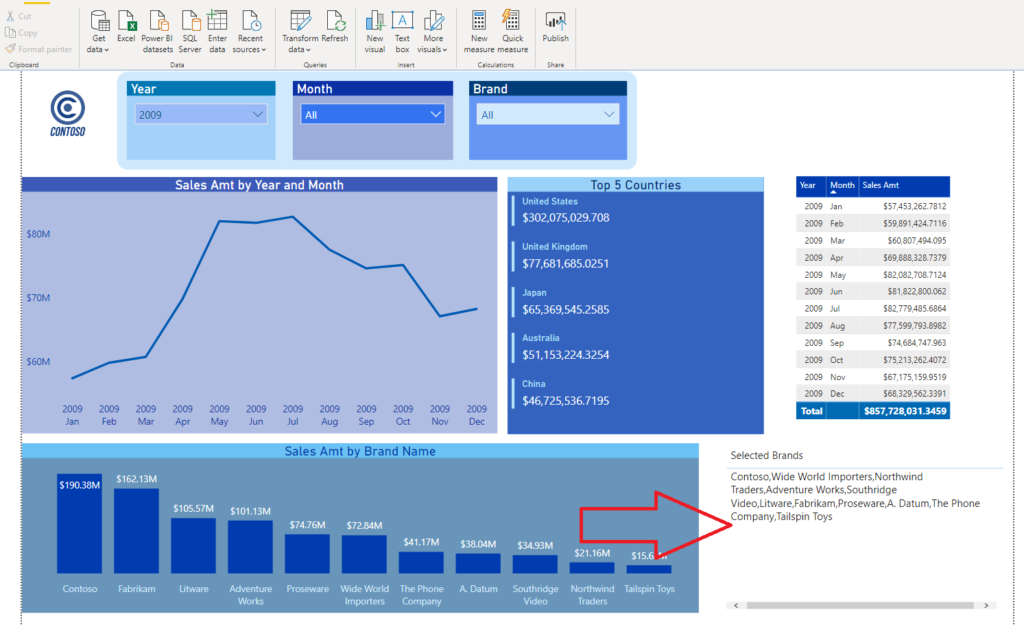
",")In my example, I’m using comma as a delimiter, but you can also use others, such as a semicolon, etc. Now, when I look again in my report, I can see that I got desired results:
在我的示例中,我使用逗號作為定界符,但是您也可以使用其他字符,例如分號等。現在,當我再次查看報表時,可以看到獲得了預期的結果:
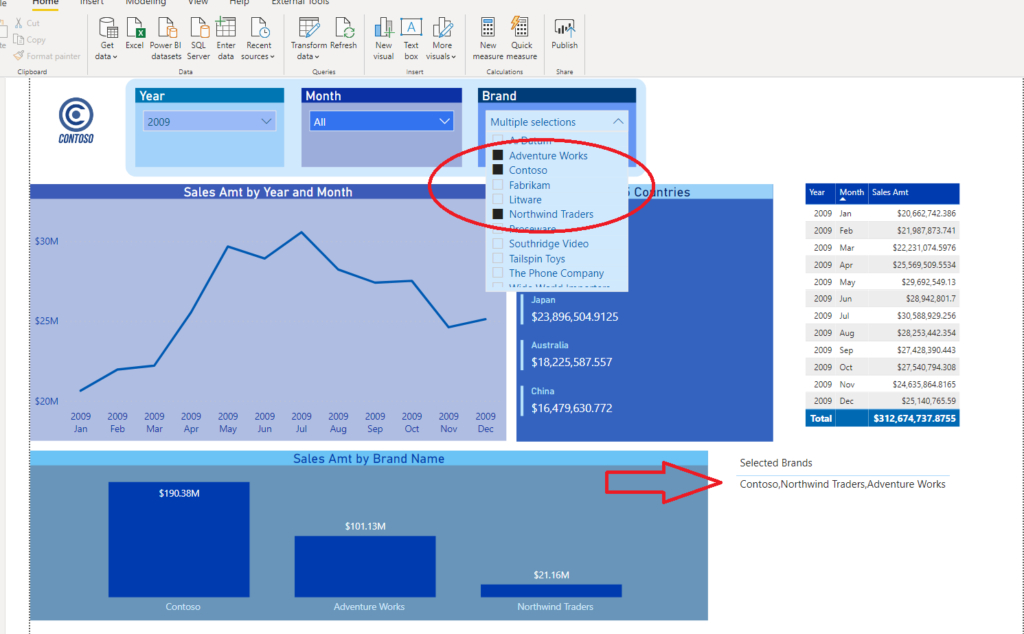
And, if I choose only few brands within the slicer, my card will adjust to reflect the changes:
而且,如果我在切片器中只選擇了少數幾個品牌,我的卡將進行調整以反映更改:
結合多種措施 (Combining multiple measures)
You can create the same measure for other slicers also, and then put all the results in the table visual. So, I will create the measure for Year slicer:
您也可以為其他切片器創建相同的度量,然后將所有結果顯示在表格中。 因此,我將為Year slicer創建度量:
Selected Year = CONCATENATEX(
                            VALUES(Dates[Year])
                            ,Dates[Year]
                            ,",")
Now, when I drag bit my measures into the table fields, I see both of my selected slicers’ values at one place:
現在,當我將度量值拖到表字段中時,我會在一個位置看到兩個選擇的切片器的值:

獎勵想法! (Bonus idea!)
If you have many slicers in your report, and you want to display all of the selections, but you don’t want to waste space on your report canvas, you can create a bookmark containing the table with all selected values, and then just display the bookmark on user’s request.
如果報表中有許多切片器,并且要顯示所有選擇,但又不想浪費報表畫布上的空間,則可以創建一個包含表的書簽,其中包含所有選定值,然后僅顯示根據用戶要求添加書簽。
Something like this:
像這樣:
How cool is that! So, you don’t need to worry about bloating your report space with this table. You can show/hide it using bookmarks and actions.
多么酷啊! 因此,您不必擔心使用此表會增加報告空間。 您可以使用書簽和操作顯示/隱藏它。
翻譯自: https://towardsdatascience.com/display-selected-slicers-in-power-bi-a99d81500e76
power bi中的切片器
本文來自互聯網用戶投稿,該文觀點僅代表作者本人,不代表本站立場。本站僅提供信息存儲空間服務,不擁有所有權,不承擔相關法律責任。 如若轉載,請注明出處:http://www.pswp.cn/news/389621.shtml 繁體地址,請注明出處:http://hk.pswp.cn/news/389621.shtml 英文地址,請注明出處:http://en.pswp.cn/news/389621.shtml
如若內容造成侵權/違法違規/事實不符,請聯系多彩編程網進行投訴反饋email:809451989@qq.com,一經查實,立即刪除!相關文章

字符串匹配 sunday算法

5939. 半徑為 k 的子數組平均值

Adobe After Effects CS6 操作記錄

數據庫邏輯刪除的sql語句_通過數據庫的眼睛查詢sql的邏輯流程


5940. 從數組中移除最大值和最小值

BZOJ4127Abs——樹鏈剖分+線段樹

數據挖掘流程_數據流挖掘

北門外的小吃街才是我的大學食堂

786. 第 K 個最小的素數分數
![[LeetCode]最長公共前綴(Longest Common Prefix)](http://pic.xiahunao.cn/[LeetCode]最長公共前綴(Longest Common Prefix))
[LeetCode]最長公共前綴(Longest Common Prefix)

域嵌套太深_pyspark如何修改嵌套結構域


WIN10下ADB工具包安裝的教程和總結 --201809

1816. 截斷句子

spark的流失計算模型_使用spark對sparkify的流失預測

峰識別 峰面積計算 peak detection peak area 源代碼 下載

區塊鏈開發公司談區塊鏈與大數據的關系

Jupyter Notebook的15個技巧和竅門,可簡化您的編碼體驗
