實現klib
TL;DRThe klib package provides a number of very easily applicable functions with sensible default values that can be used on virtually any DataFrame to assess data quality, gain insight, perform cleaning operations and visualizations which results in a much lighter and more convenient to work with Pandas DataFrame.
TL; DR klib軟件包提供了許多非常容易應用的功能以及合理的默認值,幾乎可以在任何DataFrame上使用這些功能來評估數據質量,了解洞察力,執行清潔操作和可視化,從而使工作更輕便,更方便使用Pandas DataFrame。
Over the past couple of months I’ve implemented a range of functions which I frequently use for virtually any data analysis and preprocessing task, irrespective of the dataset or ultimate goal.
在過去的幾個月中,我實現了一系列功能,而無論數據集或最終目標如何,我經常將這些功能用于幾乎所有數據分析和預處理任務。
These functions require nothing but a Pandas DataFrame of any size and any datatypes and can be accessed through simple one line calls to gain insight into your data, clean up your DataFrames and visualize relationships between features. It is up to you if you stick to sensible, yet sometimes conservative, default parameters or customize the experience by adjusting them according to your needs.
這些函數只需要任何大小和任何數據類型的Pandas DataFrame,就可以通過簡單的一行調用來訪問它們,以深入了解數據,清理DataFrame并可視化要素之間的關系。 如果您堅持明智但有時還是保守的默認參數,或者根據需要調整體驗來定制體驗,則取決于您。
This package is not meant to provide an Auto-ML style API. Rather it is a collection of functions which you can — and probably should — call every time you start working on a new project or dataset. Not only for your own understanding of what you are dealing with, but also to produce plots you can show to supervisors, customers or anyone else looking to get a higher level representation and explanation of the data.
該程序包無意提供Auto-ML樣式的API。 而是它是函數的集合,您每次開始處理新項目或數據集時都可以(可能應該)調用這些函數。 不僅是為了您自己對正在處理的內容的理解,而且還可以制作出可以顯示給主管,客戶或希望獲得更高級表示和數據解釋的任何人的圖。
安裝說明 (Installation Instructions)
Install klib using pip:
使用pip安裝klib:
pip install --upgrade klibAlternatively, to install with conda run:
或者,使用conda運行:
conda install -c conda-forge klibWhat follows is a workflow and set of best practices which I repeatedly apply when facing new datasets.
接下來是工作流程和一組最佳實踐,當面對新數據集時,我會反復應用這些最佳實踐。
快速大綱 (Quick Outline)
- Assessing Data Quality 評估數據質量
- Data Cleaning 數據清理
- Visualizing Relationships 可視化關系
The data used in this guide is a slightly truncated version of the NFL Dataset found on Kaggle. You can download it here or use any arbitrary data you want to follow along.
本指南中使用的數據是在Kaggle上找到的NFL數據集的略微截短的版本。 您可以在此處下載該文件,也可以使用要跟蹤的任意數據。
評估數據質量 (Assessing the Data Quality)
Determining data quality before starting to work on a dataset is crucial. A quick way to achieve that is to use the missing value visualization of klib, which can be called as easy as follows:
在開始使用數據集之前確定數據質量至關重要。 一種快速的實現方法是使用klib的缺失值可視化,可以這樣簡單地調用它:
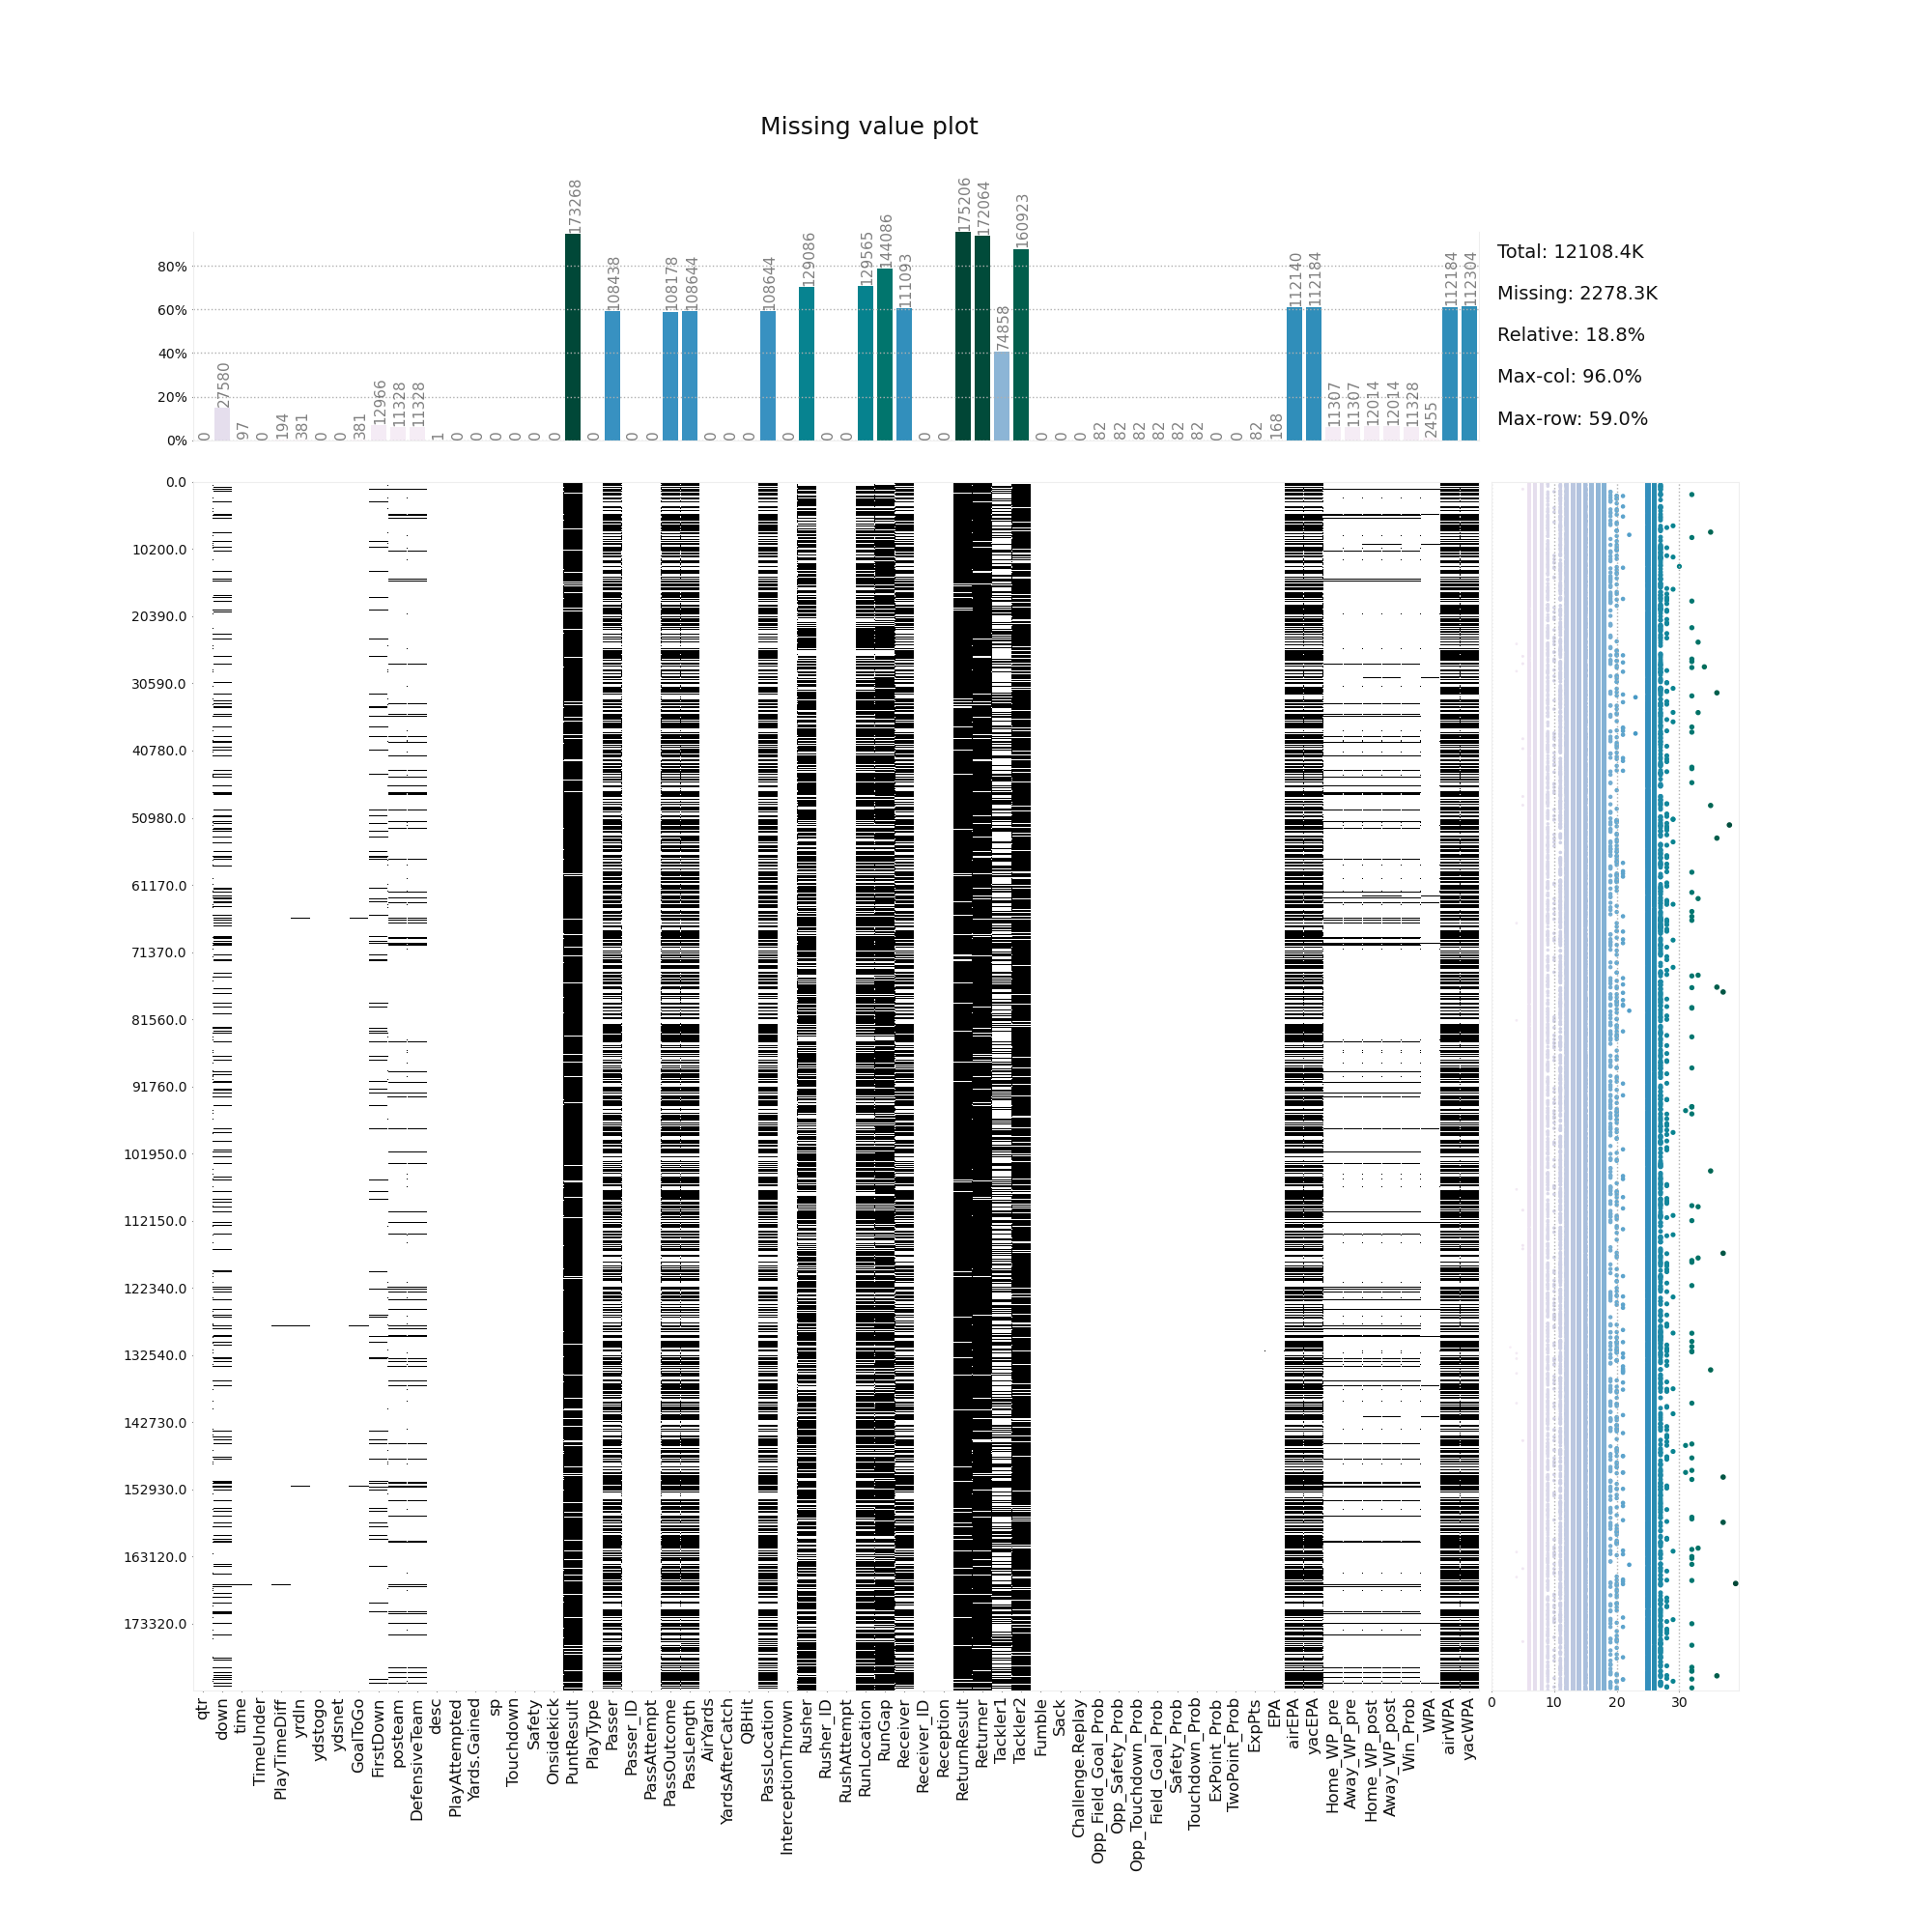
This single plot already shows us a number of important things. Firstly, we can identify columns where all or most of the values are missing. These are candidates for dropping, while those with fewer missing values might benefit from imputation.
這個單一的圖已經向我們展示了許多重要的事情。 首先,我們可以確定缺少所有或大多數值的列。 這些是丟棄的候選對象,而那些缺失值較少的對象可能會從插補中受益。
Secondly, we can often times see patterns of missing rows stretching across many features. We might want to eliminate them first before thinking about dropping potentially relevant features.
其次,我們經常可以看到缺失行的樣式遍布許多要素。 在考慮刪除潛在的相關功能之前,我們可能希望先消除它們。
And lastly, the additional statistics at the top and the right side give us valuable information regarding thresholds we can use for dropping rows or columns with many missing values. In our example we can see that if we drop rows with more than 30 missing values, we only lose a few entries. At the same time, if we eliminate columns with missing values larger than 80% the four most affected columns are removed.
最后,頂部和右側的其他統計信息為我們提供了有關閾值的有價值的信息,可用于刪除具有許多缺失值的行或列。 在我們的示例中,我們可以看到,如果我們刪除缺失值超過30個的行,則只會丟失一些條目。 同時,如果我們刪除缺失值大于80%的列,則會刪除四個受影響最大的列。
A quick note on performance: Despite going through about 2 million entries with 66 features each, the plot takes only seconds to create.
關于性能的簡要說明:盡管要經歷大約200萬個條目,每個條目具有66個特征,但創建圖僅需幾秒鐘。
數據清理 (Data Cleaning)
With this insight, we can go ahead and start cleaning the data. With klib this is as simple as calling klib.data_cleaning(), which performs the following operations:
有了這種洞察力,我們就可以開始清理數據。 使用klib,就像調用klib.data_cleaning()一樣簡單,該函數執行以下操作:
cleaning the column names:This unifies the column names by formatting them, splitting, among others, CamelCase into camel_case, removing special characters as well as leading and trailing white-spaces and formatting all column names to lowercase_and_underscore_separated. This also checks for and fixes duplicate column names, which you sometimes get when reading data from a file.
清理列名稱:通過格式化列名稱,將CamelCase拆分為camel_case,除掉特殊字符以及前導和尾隨空格以及將所有列名稱格式化為小寫的方式來統一列名稱,將它們命名為lowercase_and_underscore_separated 。 這還將檢查并修復重復的列名,當您從文件中讀取數據時有時會得到這些重復的列名。
dropping empty and virtually empty columns:You can use the parameters drop_threshold_cols and drop_threshold_rows to adjust the dropping to your needs. The default is to drop columns and rows with more than 90% of the values missing.
刪除空列和幾乎為空的列:可以使用參數drop_threshold_cols和drop_threshold_rows來調整刪除以適應您的需要。 默認設置是刪除缺少90%以上值的列和行。
removes single valued columns:As the name states, this removes columns in which each cell contains the same value. This comes in handy when columns such as “year” are included while you’re just looking at a single year. Other examples are “download_date” or indicator variables which are identical for all entries.
刪除單值列:顧名思義,這將刪除其中每個單元格包含相同值的列。 當您僅查看一年時,如果包括“年”之類的列,這將很方便。 其他示例是“ download_date”或指標變量,它們對于所有條目都相同。
drops duplicate rows:This is a straightforward drop of entirely duplicate rows. If you are dealing with data where duplicates add value, consider setting drop_duplicates=False.
刪除重復的行:這是直接刪除完全重復的行。 如果要處理重復項可增加價值的數據,請考慮設置drop_duplicates = False。
Lastly, and often times most importantly, especially for memory reduction and therefore for speeding up the subsequent steps in your workflow, klib.data_cleaning() also optimizes the datatypes as we can see below.
最后,而且通常是最重要的,尤其是對于減少內存 ,從而加快工作流程中的后續步驟, klib.data_cleaning()還優化了數據類型 ,如下所示。
Shape of cleaned data: (183337, 62) - Remaining NAs: 1754608
Changes:
Dropped rows: 123
     of which 123 duplicates. (Rows: [22257, 25347, 26631, 30310, 33558, 35164, 35777, ..., 182935, 182942, 183058, 183368, 183369])
Dropped columns: 4
     of which 1 single valued. (Column: ['play_attempted'])
Dropped missing values: 523377
Reduced memory by at least: 63.69 MB (-68.94%)
You can change the verbosity of the output using the parameter show=None, show=”changes” or show=”all”. Please note that the memory reduction indicates a very conservative value (i.e. less reduction than is actually achieved), as it only performs a shallow memory check. A deep memory analysis slows down the function for larger datasets but if you are curious about the “true” reduction in size you can use the df.info() method as shown below.
您可以使用參數show = None , show =” changes”或show =” all”來更改輸出的詳細程度。 請注意,內存減少表示一個非常保守的值(即減少的數量少于實際實現的數量),因為它僅執行淺內存檢查。 深度內存分析會使大型數據集的功能變慢,但是如果您對大小的“真實”減少感到好奇,則可以使用df.info()方法,如下所示。
df.info(memory_usage='deep')dtypes: float64(25), int64(20), object(21)
memory usage: 256.7 MB
As we can see, pandas assigns 64 bits of storage for each float and int. Additionally, 21 columns are of type “object”, which is a rather inefficient way to store data. After data cleaning, the memory usage drops to only 58.4 MB, a reduction of almost 80%! This is achieved by converting, where possible, float64 to float32, and int64 to int8. Also, the dtypes string and category are utilized. The available parameters such as convert_dtypes, category, cat_threshold and many more allow you to tune the function to your needs.
如我們所見,pandas為每個float和int分配了64位存儲空間。 另外,有21列是“對象”類型的,這是存儲數據的一種非常低效的方式。 清除數據后, 內存使用量下降到只有58.4 MB,減少了近80%! 這是通過在可能的情況下將float64轉換為float32 ,并將int64轉換為int8來實現的 。 同樣,使用dtypes 字符串和類別 。 可用的參數(如convert_dtypes,category , cat_threshold等)可讓您根據需要調整函數。
df_cleaned.info(memory_usage='deep')dtypes: category(17), float32(25), int8(19), string(1)
memory usage: 58.4 MB
Lastly, we take a look at the column names, which were actually quite well formatted in the original dataset already. However, after the cleaning process, you can rely on lowercase and underscore-connected column names. While not advisable to avoid ambiguity, this now allows you to use df.yards_gained instead of df[“Yards.Gained”], which can be really useful when doing quick lookups or when exploring the data for the first time.
最后,我們來看一下列名,這些列名實際上已經在原始數據集中格式化了。 但是, 在清理過程之后,您可以依賴小寫字母和下劃線連接的列名 。 盡管不建議您避免歧義,但現在允許您使用df.yards_gained而不是df [“ Yards.Gained”] ,這在進行快速查找或首次瀏覽數據時非常有用。
Some column name examples:
Yards.Gained --> yards_gained
PlayAttempted --> play_attempted
Challenge.Replay --> challenge_replay
Ultimately, and to sum it all up: we find that not only have the column names been neatly formatted and unified, but also that the features have been converted to more efficient datatypes. With the relatively milde default settings, only 123 rows and 4 columns, of which one column was singled valued, have been eliminated. This leaves us with a lightweight DataFrame of shape: (183337, 62) and 58 MB memory usage.
歸根結底,總而言之:我們發現不僅列名被整齊地格式化和統一了,而且功能也已轉換為更有效的數據類型。 使用相對溫和的默認設置,僅消除了123行和4列(其中一列為單值)。 這為我們提供了一個形狀輕巧的DataFrame:(183337,62)和58 MB的內存使用量。
相關圖 (Correlation Plots)
Once the initial data cleaning is done, it makes sense to take a look at the relationships between the features. For this we employ the function klib.corr_plot(). Setting the split parameter to “pos”, “neg”, “high” or “low” and optionally combining each setting with a threshold, allows us to dig deeper and highlight the most important aspects.
完成初始數據清理后,有必要查看一下功能之間的關系。 為此,我們使用函數klib.corr_plot() 。 將split參數設置為“ pos” , “ neg” , “ high”或“ low”并可選地將每個設置與閾值組合在一起,使我們能夠更深入地挖掘并突出最重要的方面。
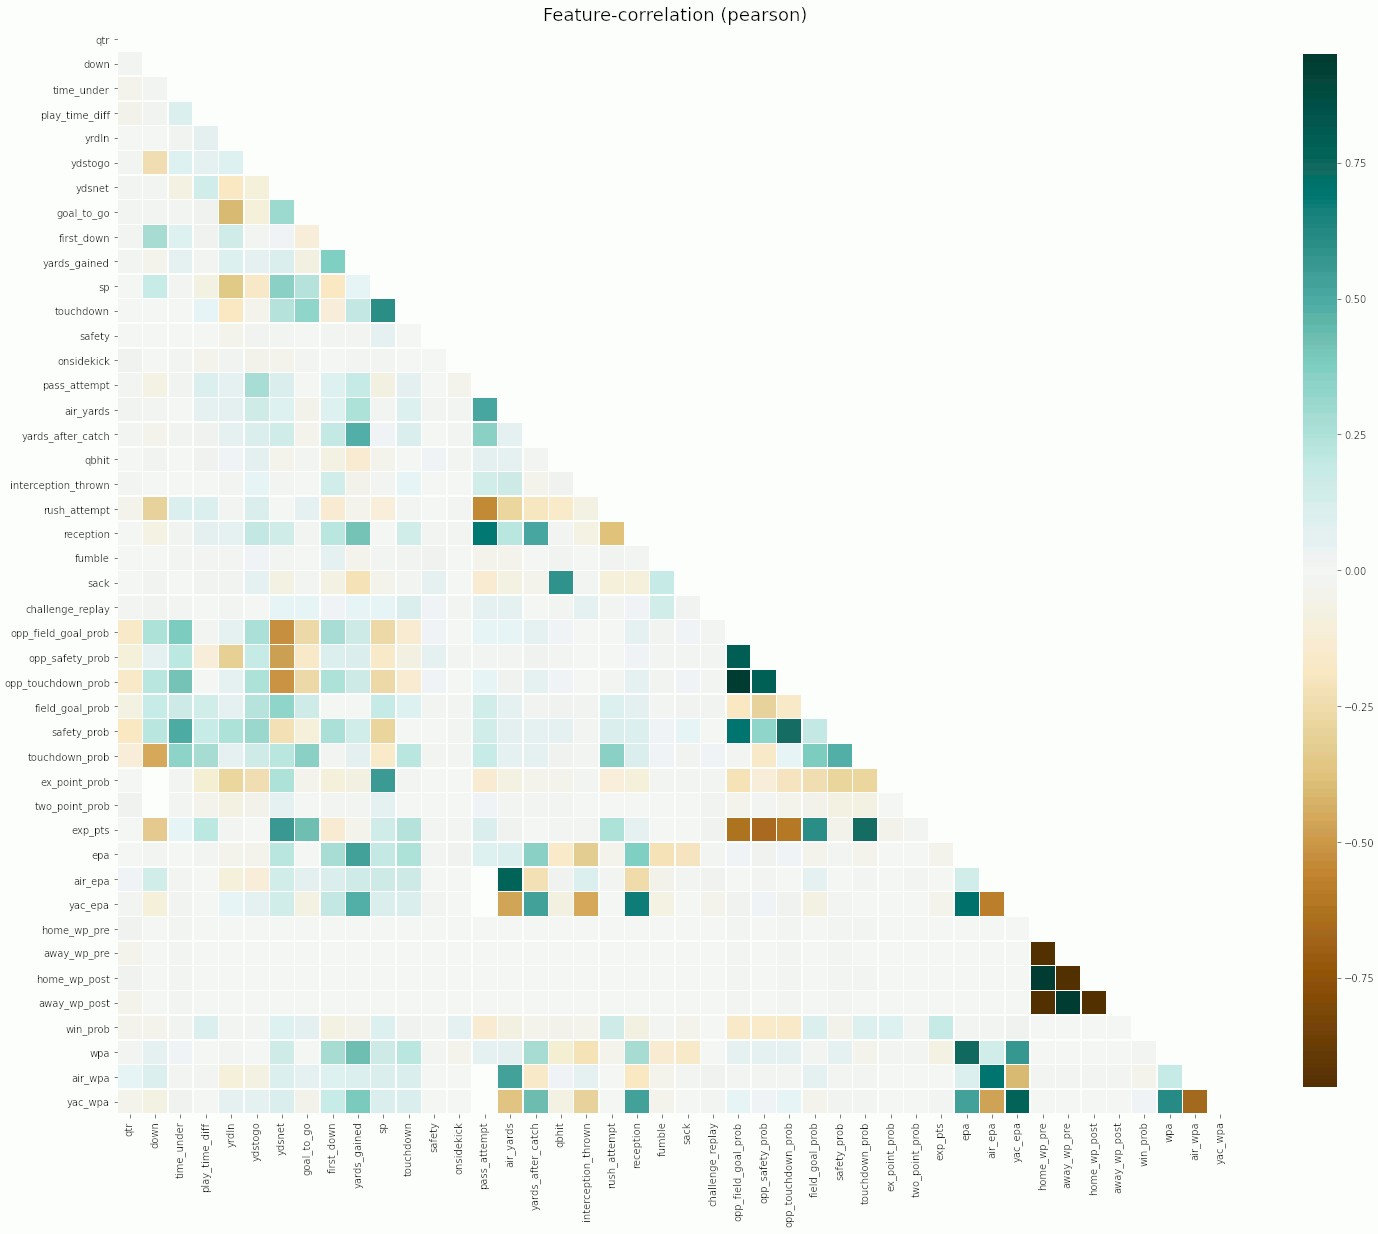
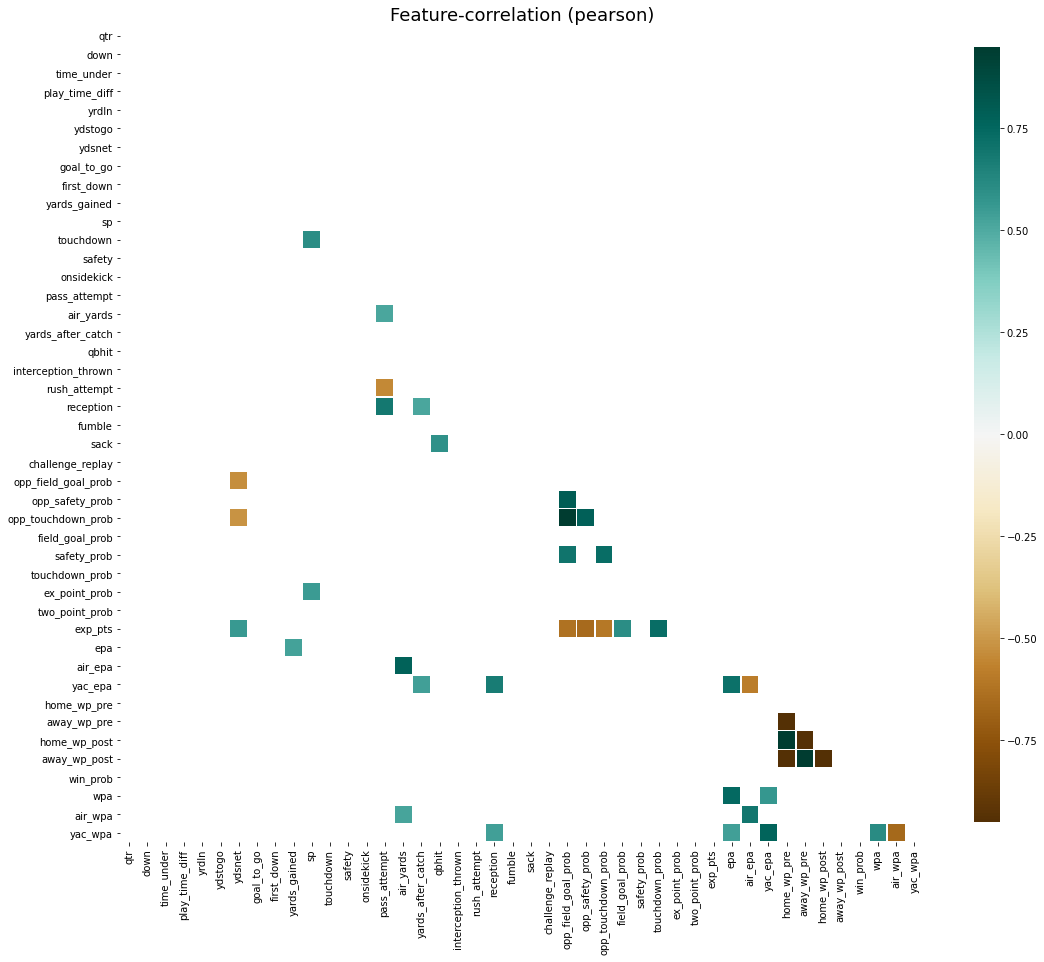
At a glance, we can identify a number of interesting relations. Similarly, we can easily zoom in on correlations above any given threshold, let’s say |0.5|. Not only does this allow us to spot features which might be causing trouble later on in our analysis, it also shows us that there are quite a few highly negatively correlated features in our data. Given sufficient domain expertise, this can be a great starting point for some feature engineering!
乍一看,我們可以確定許多有趣的關系。 類似地,我們可以輕松放大高于任何給定閾值(例如| 0.5 |)的相關性。 這不僅使我們能夠發現可能在以后的分析中引起麻煩的要素,還向我們表明,我們的數據中有很多高度負相關的要素。 有了足夠的領域專業知識,對于某些功能設計來說,這可能是一個很好的起點!
Further, using the same function, we can take a look at the correlations between features and a chosen target. The target column can be supplied as a column name of the current DataFrame, as a separate pd.Series, a np.ndarry or simply as a list.
此外,使用相同的功能,我們可以看一下特征與選定目標之間的相關性。 目標列可以作為當前DataFrame的列名,單獨的pd.Series,np.ndarry或僅作為列表提供。
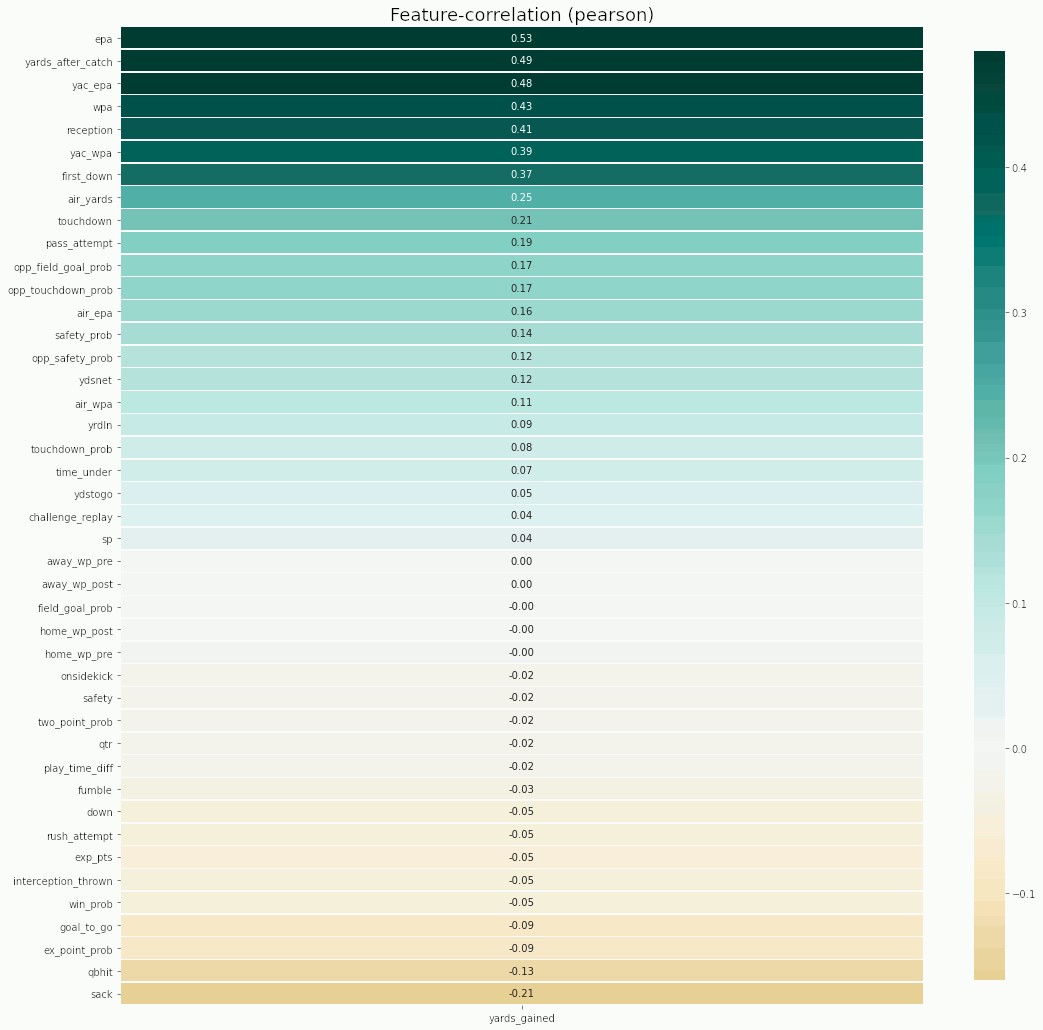
Just as before it is possible to use a wide range of parameters for customizations, such as removing annotations, changing the correlation method or changing the colormap to match your preferred style or corporate identity.
與以前一樣,可以使用各種參數進行自定義,例如刪除注釋,更改關聯方法或更改顏色圖以匹配您的首選樣式或公司標識。
分類數據 (Categorical data)
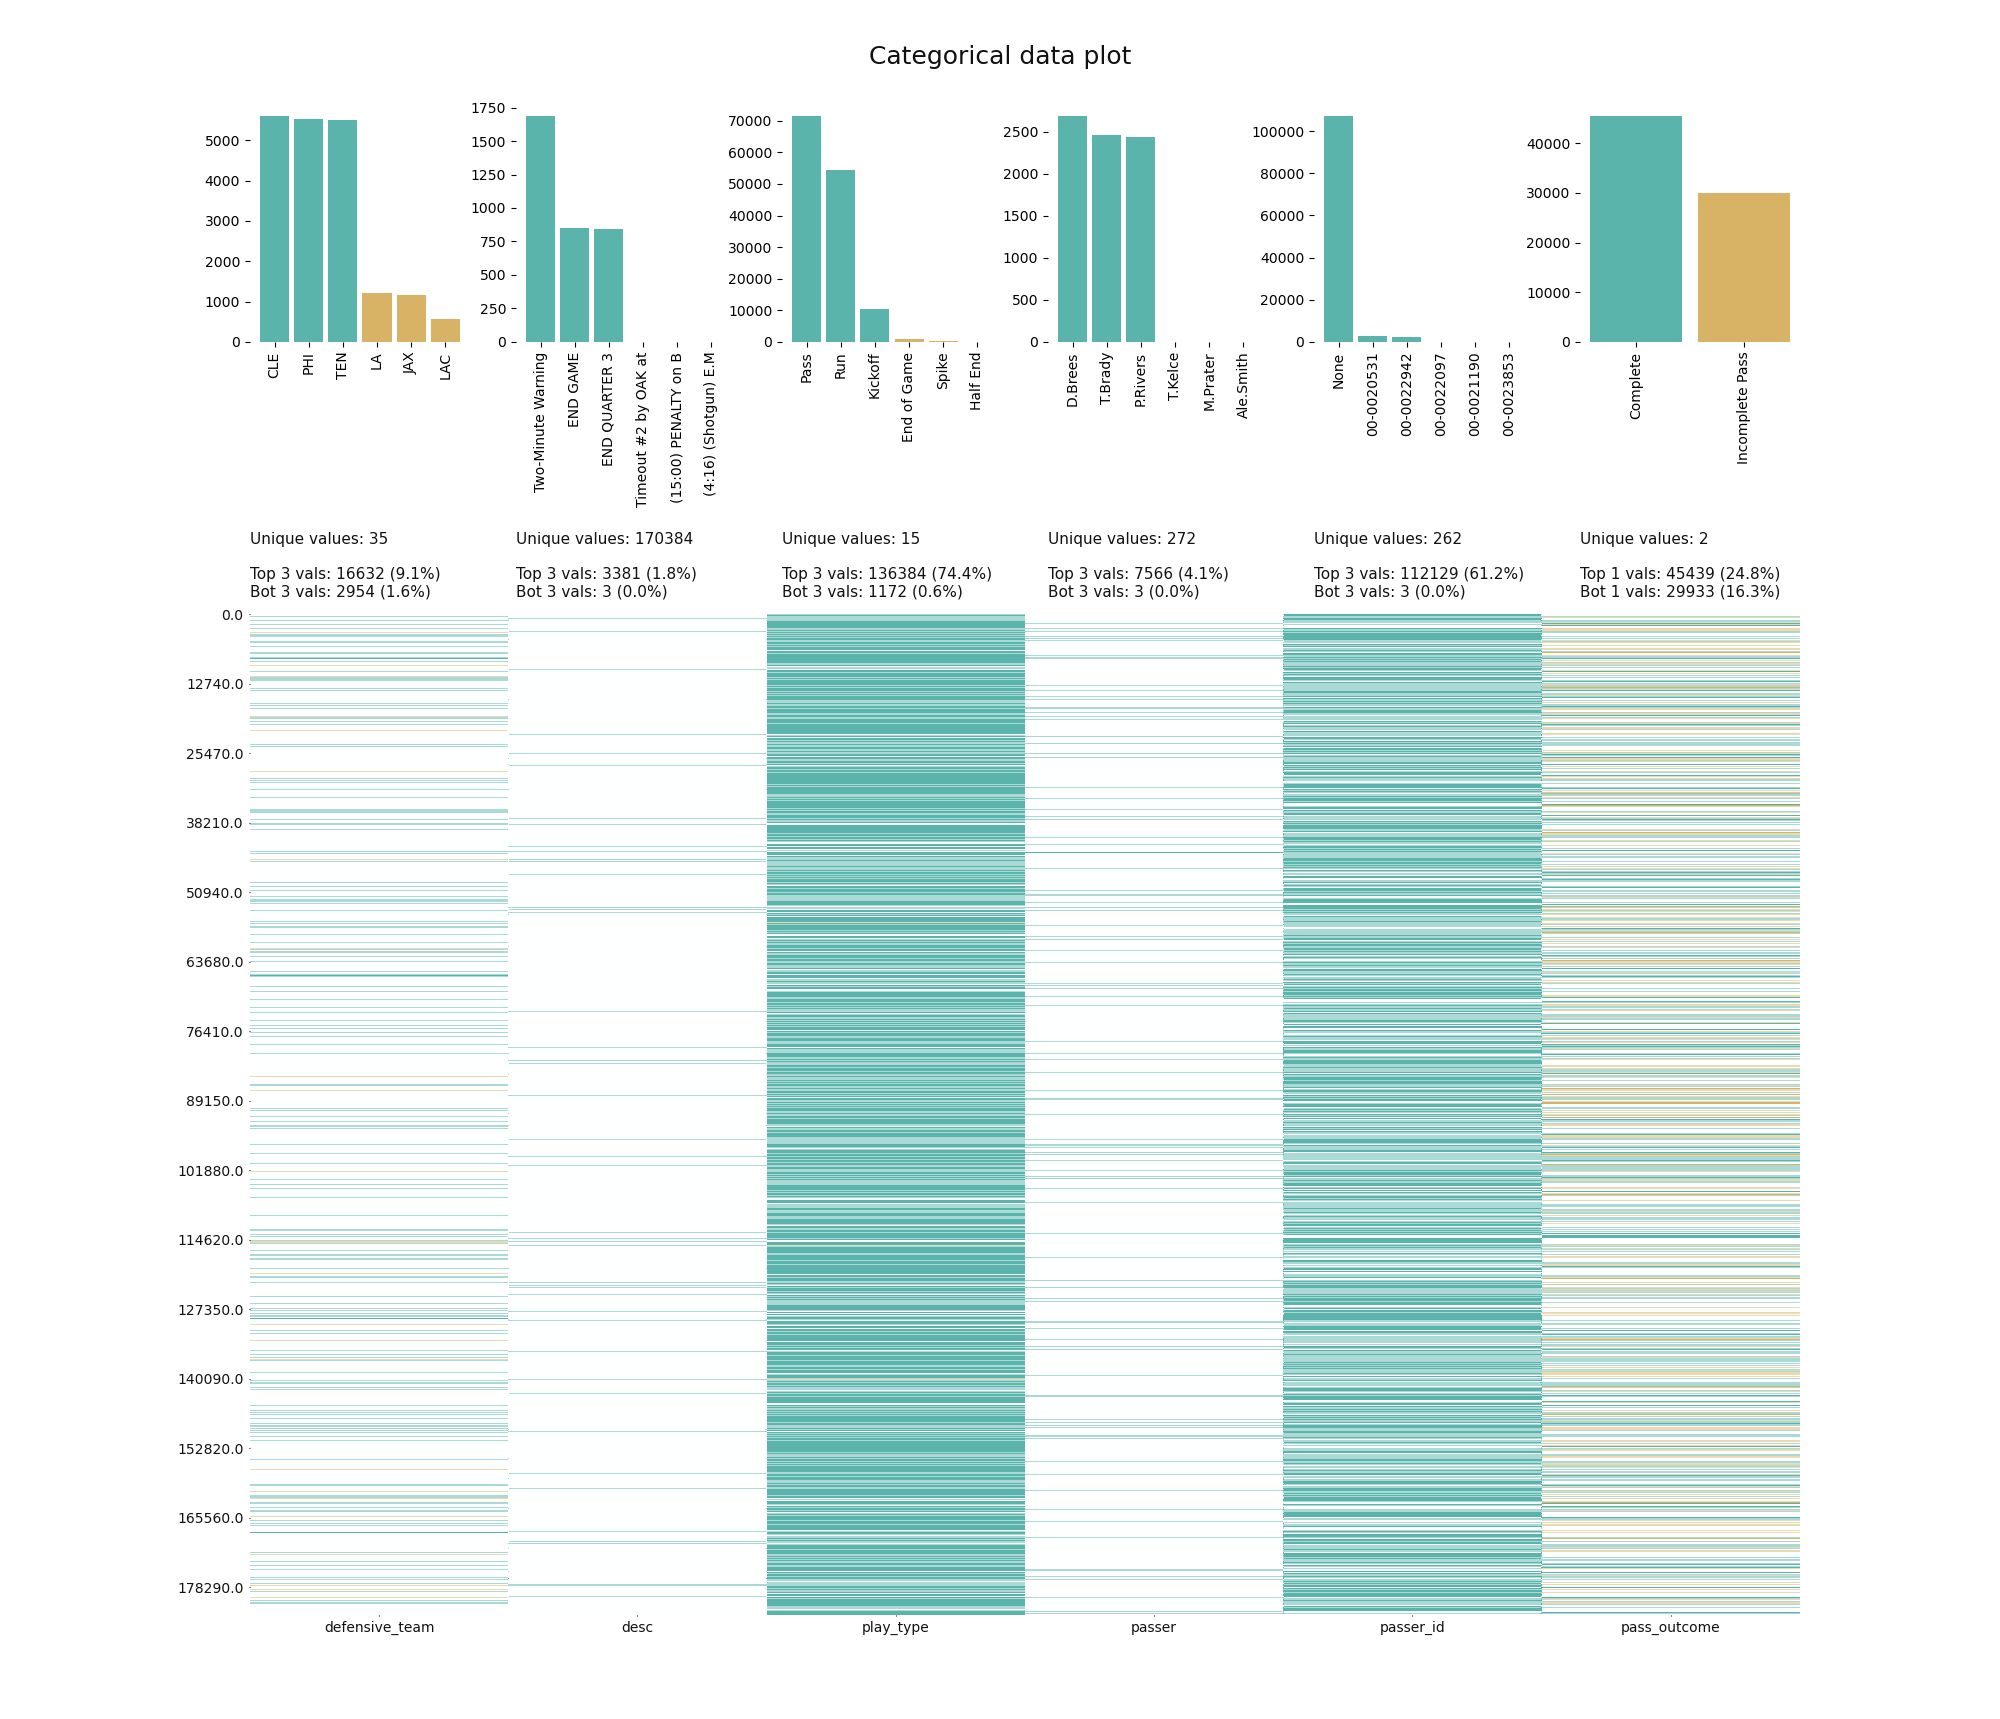
In a last step in this guide, we take a quick look at the capabilities to visualize categorical columns. The function klib.cat_plot() allows to display the top and/or bottom values regarding their frequency in each column. This gives us an idea of the distribution of the values in the dataset what is very helpful when considering to combine less frequent values into a seperate category before applying one-hot-encoding or similar functions. In this example we can see that for the column “play_type” roughly 75% of all entries are made up of the three most frequent values. Further, we can immediately see that “Pass” and “Run” are by far the most frequent values (75k and 55k). Conversely, the plot also shows us that “desc” is made up of 170384 unique strings.
在本指南的最后一步,我們快速瀏覽了可視化分類列的功能。 函數klib.cat_plot()允許在每列中顯示有關其頻率的最高和/或最低值。 這使我們了解了數據集中值的分布,這在考慮在應用單熱編碼或類似函數之前考慮將頻率較低的值組合到單獨的類別中時非常有幫助。 在此示例中,我們可以看到,對于“ play_type”列,大約所有條目的75%由三個最頻繁的值組成。 此外,我們可以立即看到“通過”和“運行”是迄今為止最頻繁的值(75k和55k)。 相反,該圖也向我們顯示“ desc”由170384個唯一字符串組成。
The klib package includes many more helpful functions for data analysis and cleaning, not to mention some customized sklearn pipelines, which you can easily stack together using a FeatureUnion and then use with in GridSearchCV or similar. So if you intend to take a shortcut, simply call klib.data_cleaning() and plug the resulting DataFrame into that pipeline. Likely, you will already get a very decent result!
klib軟件包包括許多用于數據分析和清理的更有用的功能,更不用說一些自定義的sklearn管道了,您可以使用FeatureUnion輕松地將它們堆疊在一起,然后在GridSearchCV或類似版本中使用。 因此,如果您打算采取捷徑,只需調用klib.data_cleaning()并將生成的DataFrame插入該管道即可。 可能,您已經獲得了非常不錯的結果!
結論 (Conclusion)
All of these functions make for a very convenient data cleaning and visualization and come with many more features and settings than described here. They are by no means a one fits all solution but they should be very helpful in your data preparation process. klib also includes various other functions, most notably pool_duplicate_subsets(), to pool subsets of the data across different features as a means of dimensionality reduction, dist_plot(), to visualize distributions of numerical features, as well as mv_col_handling(), which provides a sophisticated 3-step process, attempting to identify any remaining information in columns with many missing values, instead of simply dropping them right away.
所有這些功能使數據清理和可視化變得非常方便,并且具有比此處所述更多的功能和設置。 它們絕不是一個適合所有解決方案的方法,但是它們在您的數據準備過程中應該會非常有幫助。 klib還包括其他各種功能,最引人注目的是pool_duplicate_subsets() ,它可以將不同特征之間的數據子集合并為降維方法; dist_plot() ,可以顯示數字特征的分布; mv_col_handling()可以提供復雜的三步過程,嘗試識別列中有許多缺失值的任何剩余信息,而不是立即將其丟棄。
Note: Please let me know what you would like to see next and which functions you feel are missing, either in the comments below or by opening an issue on GitHub. Also let me know if you would like to see some examples on the handling of missing values, subset pooling or the customized sklearn pipelines.
注意:請在下面的評論中或通過在GitHub上打開問題,讓我知道您接下來想看什么以及感覺缺少哪些功能。 如果您想查看一些有關缺失值處理,子集池或自定義sklearn管道的示例,也請讓我知道。
翻譯自: https://towardsdatascience.com/speed-up-your-data-cleaning-and-preprocessing-with-klib-97191d320f80
實現klib
本文來自互聯網用戶投稿,該文觀點僅代表作者本人,不代表本站立場。本站僅提供信息存儲空間服務,不擁有所有權,不承擔相關法律責任。 如若轉載,請注明出處:http://www.pswp.cn/news/389234.shtml 繁體地址,請注明出處:http://hk.pswp.cn/news/389234.shtml 英文地址,請注明出處:http://en.pswp.cn/news/389234.shtml
如若內容造成侵權/違法違規/事實不符,請聯系多彩編程網進行投訴反饋email:809451989@qq.com,一經查實,立即刪除!相關文章

MMDetection修改代碼無效

docker etcd

SpringBoot簡要

發送郵件 的類 C# .net

簡明易懂的c#入門指南_統計假設檢驗的簡明指南

計算機科學期刊_成為數據科學家的五種科學期刊

Torch.distributed.elastic 關于 pytorch 不穩定


云原生全球最大峰會之一KubeCon首登中國 Kubernetes將如何再演進?

分布分析和分組分析_如何通過群組分析對用戶進行分組并獲得可行的見解

python 工具箱_Python交易工具箱:通過指標子圖增強圖表

PDA端的數據庫一般采用的是sqlce數據庫
![bzoj 1016 [JSOI2008]最小生成樹計數——matrix tree(相同權值的邊為階段縮點)(碼力)...](http://pic.xiahunao.cn/bzoj 1016 [JSOI2008]最小生成樹計數——matrix tree(相同權值的邊為階段縮點)(碼力)...)
bzoj 1016 [JSOI2008]最小生成樹計數——matrix tree(相同權值的邊為階段縮點)(碼力)...


數據科學家 數據工程師_數據科學家應該對數據進行版本控制的4個理由

JDK 下載相關資料


C#生成安裝文件后自動附加數據庫的思路跟算法

python交互式和文件式_使用Python創建和自動化交互式儀表盤
