欺詐行為識別
背景 (Background)
Online recruitment fraud (ORF) is a form of malicious behaviour that aims to inflict loss of privacy, economic damage or harm the reputation of the stakeholders via fraudulent job advertisements.
在線招聘欺詐(ORF)是一種惡意行為,旨在通過欺詐性的招聘廣告造成隱私的喪失,經濟損失或損害利益相關者的聲譽。
The aim of the analytics task was to identify fraudulent job advertisements from the data, determine key indicators of fraud and make recommendations on how to identify fraudulent job advertisements in the future.
分析任務的目的是從數據中識別欺詐性工作廣告,確定欺詐的關鍵指標,并就未來如何識別欺詐性工作廣告提出建議。
數據集 (Dataset)
We will use the Employment Scam Aegean Dataset (EMSCAD), which can be downloaded at http://icsdweb.aegean.gr/emscad. A description of how the data was collected and a data dictionary is available on this page.
我們將使用“就業騙局愛琴海數據集(EMSCAD)”,該數據集可從http://icsdweb.aegean.gr/emscad下載。 此頁面上提供了有關如何收集數據和數據字典的描述。
The dataset contains 17,880 real-life job ads. Variables within the dataset include:
數據集包含17,880個現實工作廣告。 數據集中的變量包括:
方法 (Methodology)
It is firstly important to understand how the dataset can be utilized to distinguish between fraudulent and non-fraudulent ads as this will govern the type of analytical method will be employed. The response variable which is the binary field “fraudulent” is what we are trying to predict where t = “Yes” and f = “No”.
首先,重要的是要了解如何利用數據集來區分欺詐性廣告和非欺詐性廣告,因為這將決定采用何種分析方法。 我們試圖預測的響應變量是二進制字段“欺詐性”,其中t =“是”而f =“否”。
了解數據集以選擇分析方法 (Understanding the dataset to choose the analytical approach)
We have a set of variables which are not categorized and are essentially HTML strings — Benefits, Company profile, Description and Requirements. The type of analysis that will be required of textual data is Sentiment & Emotion analysis or Frequency analysis.
我們有一組未分類的變量,它們實質上是HTML字符串-收益,公司簡介,描述和要求。 文本數據所需的分析類型為情感與情感分析或頻率分析。
The categorical or factor variables of which there are 11 — location, company logo, industry, function, salary range, department, required education, required experience, employment type, telecommuting, and questions will be inputs into a machine learning algorithm such as the gradient boosting machine (GBM), distributed random forest (DRF) and generalized linear model (GLMNET) to determine the top predictors that can be used to distinguish between fraudulent and non-fraudulent ads.
其中包含11個類別或類別變量-位置,公司徽標,行業,職能,薪資范圍,部門,所需教育,所需經驗,就業類型,遠程辦公和問題將輸入到機器學習算法中,例如漸變提升機(GBM),分布式隨機森林(DRF)和廣義線性模型(GLMNET)來確定可用于區分欺詐性廣告和非欺詐性廣告的最佳預測指標。
As two analytical approaches will be used — one for the string variables and the other for the factor variables, there will be two sets of output as follows:
由于將使用兩種分析方法(一種用于字符串變量,另一種用于因子變量),因此將有兩組輸出,如下所示:
- HTML variables: Sentiment, emotion and word frequency plots HTML變量:情感,情感和單詞頻率圖
- Nominal & Binary Variables: Top predictors, coefficients 標稱和二進制變量:最佳預測變量,系數
Some variables do not contribute to any information and as such, they were excluded from the analysis. These include title and in-balanced as title is identifying information and in-balanced is used to include and exclude records to balance the dataset.
一些變量不會提供任何信息,因此將其從分析中排除。 這些包括標題和不平衡,因為標題是標識信息,不平衡用于包括和排除記錄以平衡數據集。
數據ETL (Data ETL)
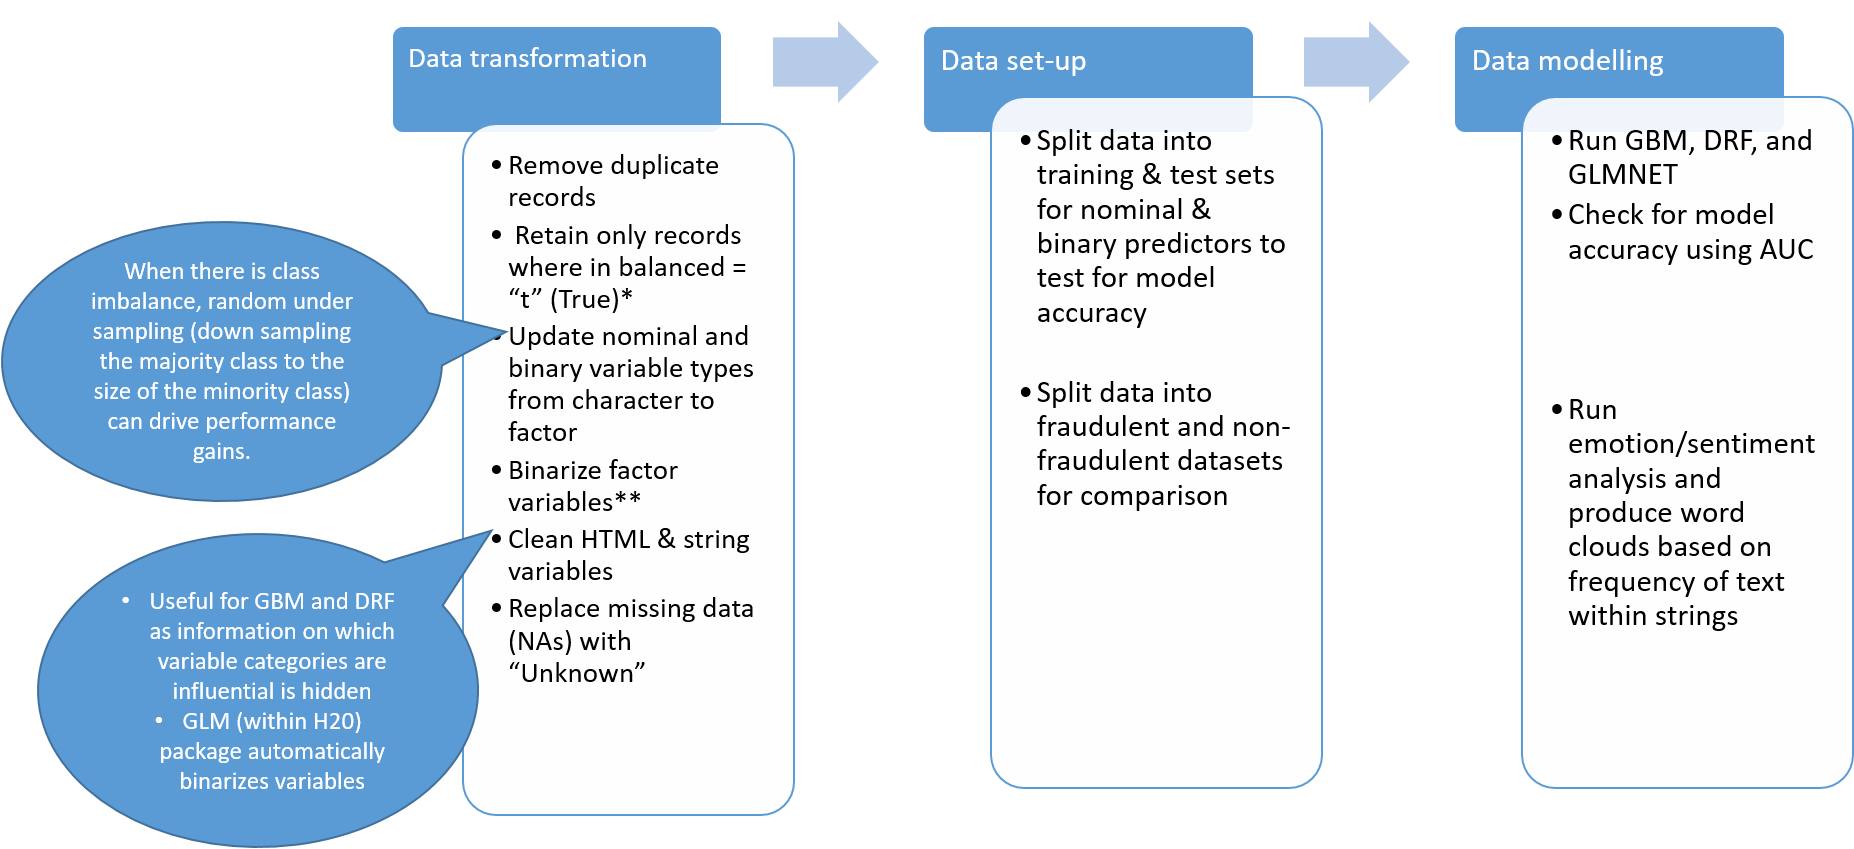
Prior to modelling, a number of steps have to be carried out to cleanse the dataset. The flow diagram below shows the steps that were carried out to prepare the dataset for modelling.
在建模之前,必須執行許多步驟來清理數據集。 下面的流程圖顯示了為準備建模數據集而執行的步驟。
結果 (Results)
輸出-文本分析 (Output — Text Analytics)
詞云 (Word clouds)
Word clouds were created for each of the HTML strings — company profile, job description, requirements and benefits.
為每個HTML字符串創建了文字云-公司簡介,職位描述,要求和收益。
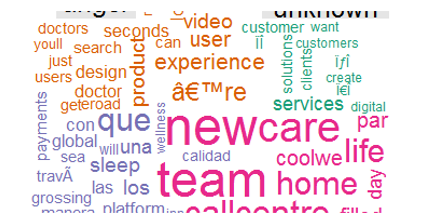
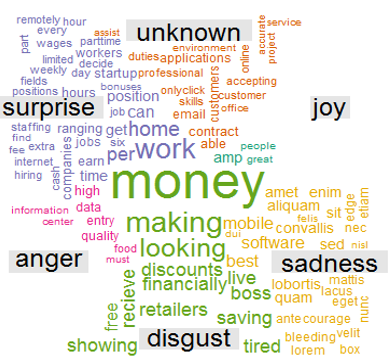
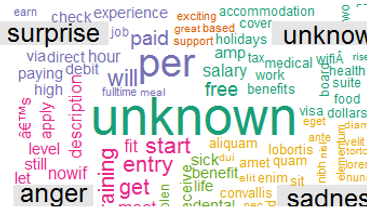
The word clouds below are for company profile for non-fraudulent ads (left) and fraudulent ads (right).
下面的詞云是針對非欺詐性廣告(左)和欺詐性廣告(右)的公司資料。
- Non-fraudulent ads emphasize a work life balance (“home”, “life”, “care”) and company culture (“team”, “experience”) 不欺詐的廣告強調工作與生活之間的平衡(“家庭”,“生活”,“護理”)和公司文化(“團隊”,“體驗”)
- Fraudulent ads are largely missing the company profile with an emphasis on monetary perks (“cell phones”, “money”, “cost”) 欺詐性廣告在很大程度上缺少公司形象,而側重于金錢利益(“手機”,“金錢”,“成本”)
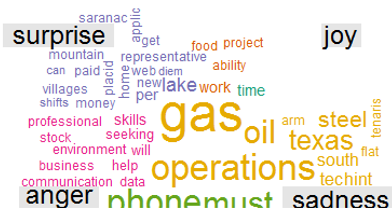
The word clouds below are for job description for non-fraudulent ads (left) and fraudulent ads (right).
以下單詞云用于描述非欺詐性廣告(左)和欺詐性廣告(右)的工作。
- Non-fraudulent ads emphasize company offerings (“gas”, “oil”, “operations”) 非欺詐性廣告強調公司產品(“天然氣”,“石油”,“運營”)
- Fraudulent ads emphasize monetary value (“money”, “financially”, “discounts”) Non-fraudulent ads emphasize company offerings (“gas”, “oil”, “operations”) 欺詐性廣告強調貨幣價值(“金錢”,“財務”,“折扣”)欺詐性廣告強調公司產品(“天然氣”,“石油”,“運營”)
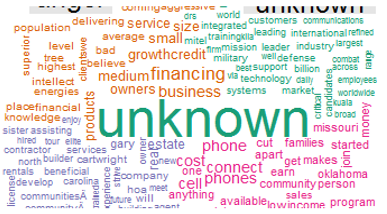
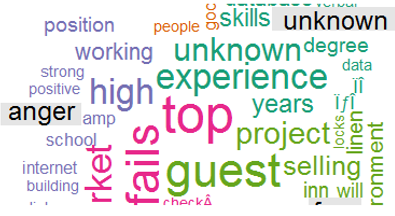
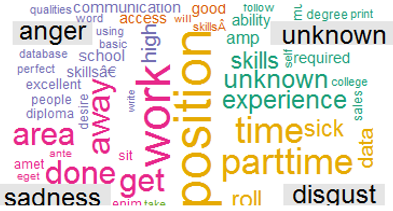
Below are word clouds for job requirements — non-fraudulent on the left and fraudulent on the right.
以下是工作要求的詞云-左側為欺詐性質,右側為欺詐性質。
- Non-fraudulent ads emphasize years of experience, skills, degree qualifications and project orientation 非欺詐性廣告強調多年的經驗,技能,學位資格和項目方向
- Fraudulent ads emphasize the above attributes to a lesser extent Non-fraudulent ads emphasize years of experience, skills, degree qualifications and project orientation 欺詐性廣告較少強調上述屬性欺詐性廣告強調較少的經驗,技能,學位資格和項目方向
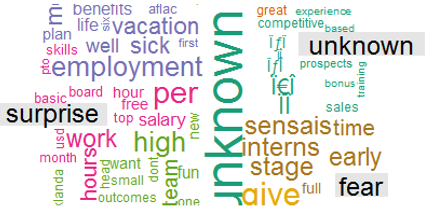
Finally, the word clouds below are based on the test for job benefits.
最后,下面的“云”一詞基于對工作福利的測試。
- Non-fraudulent ads emphasize benefits such as “sick leave”, “hours” and “vacation” 不欺詐的廣告會強調諸如“請病假”,“工作時間”和“假期”之類的好處
- Fraudulent ads appear to offer monetary perks such as accommodation, holidays, food, competitive salary, visa, and food among others. 欺詐性廣告似乎提供金錢福利,例如住宿,假期,食物,有競爭力的薪水,簽證和食物等。
情緒分析 (Sentiment Analysis)
Another way to analyse text is via sentiment analysis, which is type of emotion (positive or negative) associated with each word in text.
分析文本的另一種方法是通過情感分析,這是與文本中每個單詞相關的情感類型(正面或負面)。
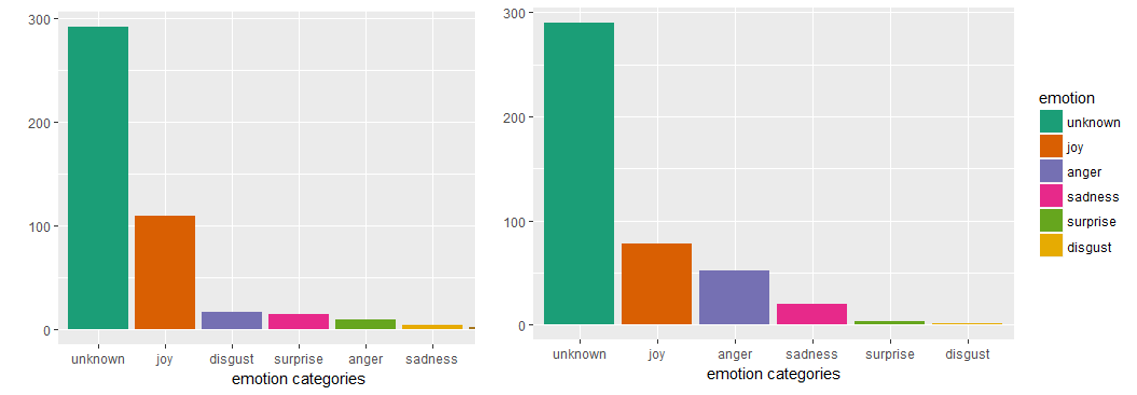
For instance, looking at the emotion categories below for non-fraudulent and fraudulent ads for job requirements, we can see that a greater proportion of non-fraudulent ads (left) are positive (“joy”, “surprise”), whereas the contrast is true for fraudulent ads (right).
例如,查看下面針對工作要求的不欺詐和欺詐廣告的情感類別,我們可以看到,較大比例的不欺詐廣告(左)是積極的(“歡樂”,“驚奇”),而對比對于欺詐性廣告是正確的(右)。
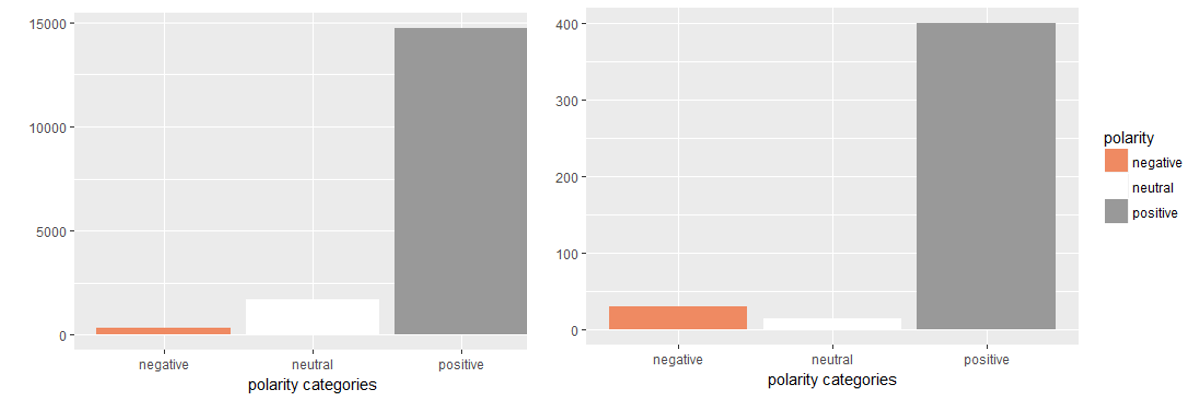
We can also look at the polarity of these ads that is the orientation towards a specific emotion category, positive or negative. A greater proportion of non-fraudulent ads are positive than fraudulent ads.
我們還可以查看這些廣告的極性,即針對特定情緒類別(正面或負面)的方向。 與欺詐性廣告相比,非欺詐性廣告中肯定的比例更大。
As shown from the examples of word clouds and bar graphs of textual sentiment, we can see that text information is very useful in predicting certain behaviour. The next logical step would be to tag these ads as positive or negative based on their emotion/ polarity and introduce this information as binary variables into a machine learning model for prediction to determine the importance of these variables for prediction.
從單詞云和文本情感條形圖的示例中可以看出,文本信息對于預測某些行為非常有用。 下一步的邏輯步驟是根據廣告的情感/極性將這些廣告標記為肯定或否定,并將此信息作為二進制變量引入到機器學習模型中進行預測,以確定這些變量對預測的重要性。
For instance, you would create four variables, job requirements, description, benefits and company profile. For each variable, each ad would be assigned a “0” or “1” to signify “positive” or “negative” sentiment.
例如,您將創建四個變量,工作要求,描述,福利和公司簡介。 對于每個變量,將為每個廣告分配“ 0”或“ 1”,以表示“積極”或“消極”情緒。
Now, let’s move on to utilizing the numerical variables in a model for predicting which ads are fraudulent and non-fraudulent.
現在,讓我們繼續使用模型中的數字變量來預測哪些廣告是欺詐性和非欺詐性的。
機器學習模型 (Machine Learning Models)
總覽 (Overview)
It is always good to run a number of different types of models and then select the one or combination of models that provide you not only with the highest accuracy but also meaningful results that can readily be explained to business stakeholders and are likely to be accepted by them.
最好運行多個不同類型的模型,然后選擇一個或多個模型組合,這些模型不僅可以為您提供最高的準確性,而且還可以向業務利益相關方解釋并可以為您所接受的有意義的結果。他們。
For this problem, I ran three types of models:
對于這個問題,我運行了三種類型的模型:
Distributed random forest (DRF): Essentially a random forest which is an ensemble of classification trees but run in parallel on the h2o server, hence, the word distributed.
分布式隨機森林 ( DRF ):本質上是一個隨機森林,它是分類樹的集合,但是在h2o服務器上并行運行,因此是分布式的。
Gradient boosting machine (GBM): Like the random forest, it is also a classification method consisting of an ensemble of trees. The difference is that random forests are used to build deep independent trees (i.e. each tree is run on a random set of variables on a random subset of the data — the “bagging” method), whereas GBMs built lots of shallow and weak, dependent, successive trees. In this approach, each tree learns from the previous tree and tries to improve on it by reducing the amount of error and increasing the amount of variation in the response variable explained by the predictive variables.
梯度提升機 ( GBM ):與隨機森林一樣,它也是一種由樹木集合組成的分類方法。 不同之處在于,隨機森林用于構建深層獨立的樹(即,每棵樹都在數據的隨機子集上的隨機變量集上運行-“裝袋”方法),而GBM則構建了許多淺層和弱層,相關的,連續的樹木。 在這種方法中,每棵樹都從前一棵樹中學習,并嘗試通過減少錯誤量和增加由預測變量解釋的響應變量的變化量來對其進行改進。
Generalized linear model (GLM): GLMs are just an extension of linear models that can be run on a non-normally distributed dependent variable. As this is a classification problem, the link function used is for logistic regression. The output of a logistic regression algorithm are coefficients for the predictor in logits, where a one unit change in the predictor variable leads to the coefficient value change in the log odds. These logits can be converted to odds ratio to provide more meaningful information.
廣義線性模型 ( GLM ): GLM只是線性模型的擴展,可以在非正態分布的因變量上運行。 由于這是一個分類問題,因此使用的鏈接函數用于邏輯回歸 。 Logistic回歸算法的輸出是logits中預測變量的系數,其中預測變量的單位變化導致對數賠率的系數值變化。 可以將這些logit轉換為優勢比,以提供更多有意義的信息。
To calculate the odds ratio, we need to exponentiate each coefficient by raising it to the power of e i.e. e^b
要計算比值比,我們需要通過將每個系數提高到e的冪( 即e ^ b)來取冪
Now that you have some understanding of the three types of models, let’s compare their model accuracy.
現在您已經對這三種類型的模型有了一定的了解,讓我們比較它們的模型準確性。
方法 (Methodology)
The dataset was split into training (80% of dataset) and test (20% of dataset) sets using a random seed where the goal is to train the model on the training set and test its accuracy on the test set.
使用隨機種子將數據集分為訓練集(占數據集的80%)和測試集(占數據集的20%),其目的是在訓練集上訓練模型并在測試集上測試其準確性。
The GBM was run with the following parameters where the max depth of the tree was set to 4 (4 levels), a small learn rate, and five fold cross validation.
使用以下參數運行GBM,其中樹的最大深度設置為4(4個級別),學習率小,交叉驗證五倍。
Cross-validation is a technique used to validate our training model before we apply it to the test set. By specifying five folds, it means that we build five different models where each model is trained on four parts and tested on the fifth. So, the first model is trained on parts 1, 2, 3, and 4 and tested on 5. The second model is trained on parts 1, 3, 4, and 5 and tested on part 2 and so on.
交叉驗證是一種用于將訓練模型應用于測試集之前對其進行驗證的技術。 通過指定五折,這意味著我們建立了五個不同的模型,其中每個模型分為四個部分進行訓練,并在第五個部分進行測試。 因此,第一個模型在零件1、2、3和4上進行訓練,并在5上進行測試。第二個模型在零件1、3、4和5上進行訓練,并在第2部分上進行測試,依此類推。
This method is called k-fold cross-validation and allows us to be more confident in the performance of the modelling method utilised. When we create five different models, we are testing it on five different/unseen datasets. If we only test the model once, for example, on our test set, then we only have a single evaluation which may be a biased results.
這種方法稱為k折交叉驗證,它使我們對所使用的建模方法的性能更有信心。 當我們創建五個不同的模型時,我們正在五個不同/看不見的數據集上對其進行測試。 例如,如果僅在測試集上對模型進行一次測試,則只有一個評估,這可能是有偏差的結果。
gbm_model <-h2o.gbm(y=y_dv, x=x_iv, training_frame = model_train.h2o,
ntrees =500, max_depth = 4, distribution="bernoulli", #for 0-1 outcomes
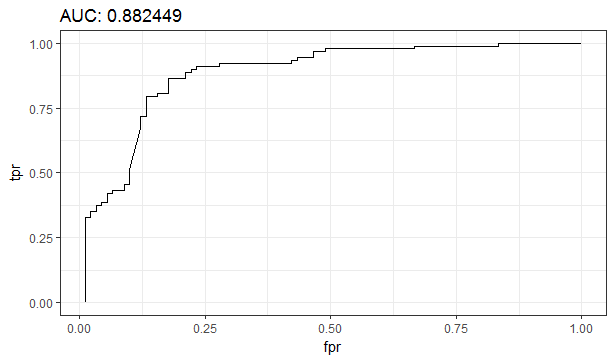
learn_rate = 0.01, seed = 1234, nfolds = 5, keep_cross_validation_predictions = TRUE)To measure model accuracy, I used the ROC-AUC metrics. ROC or Receiver Operating Characteristic is a probability curve and the AUC, Area Under Curve, is a measure of the degree of separation between classes. In our case, the AUC is how accurately can the given model distinguish between non-fraudulent and fraudulent ads. The higher the AUC, the more accurate the model is at classifying the ads correctly.
為了測量模型的準確性,我使用了ROC-AUC指標。 ROC或接收器工作特性是一條概率曲線,而AUC(曲線下面積)是對類別之間分離程度的度量。 在我們的案例中,AUC是給定模型在非欺詐性廣告和欺詐性廣告之間的區分精度。 AUC越高,模型正確分類廣告的準確性就越高。
fpr <- h2o.fpr( h2o.performance(gbm_model, newdata=model_test.h2o) )[['fpr']]
tpr <- h2o.tpr( h2o.performance(gbm_model, newdata=model_test.h2o) )[['tpr']]
ggplot( data.table(fpr = fpr, tpr = tpr), aes(fpr, tpr) ) +
  geom_line() + theme_bw() + ggtitle( sprintf('AUC: %f', gbm.auc) )
AUC is made up of a couple of metrics to test model accuracy which are:
AUC由幾個衡量模型準確性的指標組成:
- True Positives (TP): Fraudulent ads that were correctly predicted as fraudulent 真實肯定(TP):被正確預測為欺詐的欺詐性廣告
- True Negatives (TN): Non-fraudulent ads that were correctly predicted as non-fraudulent 真實否定詞(TN):正確預測為非欺詐性的非欺詐性廣告
- False Positives (FP): Non-fraudulent ads that were incorrectly predicted as fraudulent 誤報(FP):被誤認為是欺詐的非欺詐性廣告
- False Negatives (FN): Fraudulent ads that were incorrectly predicted as non-fraudulent 假陰性(FN):被錯誤地預測為非欺詐的欺詐廣告
These metrics can then be combined to calculate sensitivity and specificity.
然后可以將這些指標進行組合以計算敏感性和特異性。
Sensitivity is a measure of what proportion of fraudulent ads were correctly classified.
敏感性衡量正確分類欺詐廣告的比例。
Sensitivity = count (TP) / sum(count(TP) + count(FP))
靈敏度=計數(TP)/總和(計數(TP)+計數(FP))
Specificity is a measure of what proportion of non-fraudulent ads were correctly identified.
特異性是衡量正確識別非欺詐性廣告比例的一種方法。
Specificity = count (FP)/sum (count(TP) + count(FP))
特異性=計數(FP)/總和(計數(TP)+計數(FP))
When determining which measure is more important for your analysis, ask yourself the question whether it is more important for you to identify the number of correctly classified positives (sensitivity is more important) or negatives (specificity is more important). In our case, we want a model with higher sensitivity as we are more interested in correctly distinguishing fraudulent ads.
在確定哪種量度對您的分析更重要時,問自己一個問題,即確定正確分類的陽性(敏感性更重要)或陰性(特異性更重要)的數量對您來說更重要。 在我們的案例中,我們希望模型具有更高的靈敏度,因為我們對正確區分欺詐性廣告更加感興趣。
All these metrics can be summarized in a confusion matrix which is a table comparing number of cases that were correctly and incorrectly predicted against the actual number of fraudulent and non-fraudulent cases. This information can be used to supplement our understanding of the ROC and AUC metrics.
所有這些指標都可以匯總在一個混淆矩陣中 ,該矩陣是一個表格,該表格將正確和錯誤地預測的案件數量與欺詐和非欺詐案件的實際數量進行比較。 此信息可用于補充我們對ROC和AUC指標的理解。
Another aspect of the ROC-AUC metrics is the threshold used to determine whether an ad is fraudulent or non-fraudulent. To determine the best threshold t that maximizes the number of TPs positives, we can use the ROC curve, where we plot the TPR (True Positive Rate) on the y-axis against the FPR (False Positive Rate) on the x-axis.
ROC-AUC指標的另一個方面是用于確定廣告是欺詐還是不欺詐的閾值 。 為了確定使TP陽性數最大化的最佳閾值t,我們可以使用ROC曲線,在該曲線上我們繪制y軸上的TPR(真陽性率)相對于x軸上的FPR(假陽性率)。
The AUC allows for comparison of models where we can compare their ROC curves for model accuracy on the test set as shown in the model output below.
AUC允許對模型進行比較,我們可以在測試集上比較其ROC曲線以確保模型準確性,如下面的模型輸出所示。
模型輸出 (Model Output)
模型精度比較 (Model Accuracy Comparison)
The table below shows that the DRF produces a model with the highest AUC of 0.962 on the test set. All three models have high AUC values (> 0.5 or random prediction).
下表顯示了DRF在測試集上生成的AUC最高為0.962的模型。 這三個模型均具有較高的AUC值(> 0.5或隨機預測)。
However, let’s dig deeper into what this AUC means in terms of correctly classified ads as fraudulent by looking at the confusion matrix below for the GLM model as an example.
但是,讓我們通過以GLM模型為例,查看下面的混淆矩陣,進一步深入了解該AUC在將廣告正確分類為欺詐廣告方面的含義。
The confusion matrix for GLM on the test set indicates an error rate of 8.15% in classifying fraudulent cases incorrectly. The sensitivity for this model is 327/(327+29) = 92% which is very good.
測試集上的GLM混淆矩陣表明,錯誤地對欺詐案件進行分類的錯誤率為8.15%。 該模型的靈敏度為327 /(327 + 29)= 92%,非常好。
Now, let’s look at the remaining output from the models, more specifically what are the top predictors in classifying fraudulent and non-fraudulent ads.
現在,讓我們看一下模型的其余輸出,更具體地說,是對欺詐性和非欺詐性廣告進行分類的最佳預測指標是什么。
最重要的預測因子 (Most Important Predictors)
The variable importance rank in a classification problem tells us how accurately can a predictor variable classify fraudulent ads over non-fraudulent ads relative to all other predictors that were used int he mode.
分類問題中變量的重要性等級告訴我們,與在模式中使用的所有其他預測變量相比,預測變量可以如何準確地將欺詐性廣告分類為非欺詐性廣告。
For both (a) GBM and (b) DRF, the top three variables — location, company logo and industry — in terms of how useful they are in classifying job ads into fraudulent or non-fraudulent are the same. This is also true for the has questions and telecommuting variables as being least important
對于(a)GBM和(b)DRF,就它們在將招聘廣告分類為欺詐或不欺詐方面的有用程度而言,前三個變量(位置,公司徽標和行業)是相同的。 對于具有最不重要的問題和遠程辦公變量也是如此
Now, let’s plot the dataset to better understand how the top predictors vary for fraudulent and non-fraudulent ads.
現在,讓我們繪制數據集,以更好地了解欺詐性和非欺詐性廣告的主要預測變量如何變化。
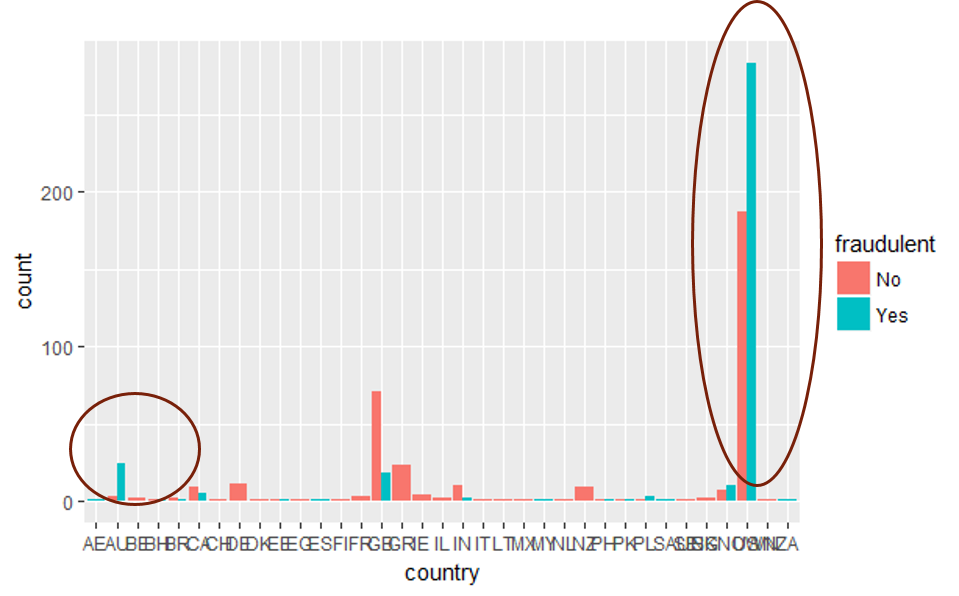
Let’s look at the top variable, location, where we can see that a greater proportion of fraudulent than non-fraudulent ads are from the USA and Australia as indicated by the circled bars.
讓我們看一下最上面的變量location ,在該變量中,如帶圓圈的條所示,我們發現來自美國和澳大利亞的欺詐廣告比非欺詐廣告更大。
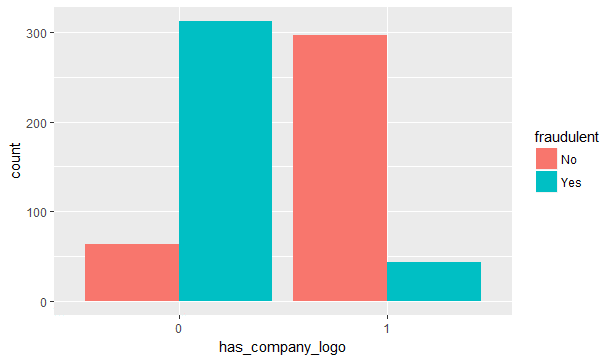
A greater proportion of fraudulent than non-fraudulent ads do not display a company logo in their job ads.
欺詐性廣告中比不欺詐性廣告更大的比例在其招聘廣告中不顯示公司徽標。
了解模型系數 (Understanding the model coefficients)
Now, let’s try to numerically understand the relationship between the predictor variables and the classification of ads.
現在,讓我們嘗試從數字上了解預測變量與廣告分類之間的關系。
As shown in the table below, the highlighted predictors are best at distinguishing fraudulent and non-fraudulent ads.
如下表所示,突出顯示的預測變量最能區分欺詐性和非欺詐性廣告。
767 variables entered into model, only 48 have a non-zero coefficient (Top predictors shown)
輸入模型的767個變量中,只有48個具有非零系數(顯示了最高預測變量)
The greater the probability, the higher the chance of the ad being fraudulent
可能性越大,則廣告被欺詐的可能性越高。
結論和后續步驟 (Conclusion and Next Steps)
Now that you have a good understanding of using both textual and numerical predictors in a classification problem with the employment of both textual analytics tools and machine learning classification algorithms.
現在,您已經對使用文本分析工具和機器學習分類算法同時使用文本預測器和數字預測器在分類問題中有了很好的了解。
So, what can we do next?
那么,下一步我們該怎么做?
- A combination of textual analysis and predictive modelling should be used to classify job ads into fraudulent and non-fraudulent job ads 應結合使用文本分析和預測模型來將求職廣告分為欺詐性和非欺詐性職業廣告
- To improve accuracy of textual analysis the following methods can be introduced: 為了提高文本分析的準確性,可以引入以下方法:
N-grams modelling: Look at the combination of words that occur together to identify patterns
N-gram建模 :查看一起出現的單詞組合以識別模式
- Look for trends in capitalization and punctuation 尋找大寫和標點符號的趨勢
- Look for trends in emphasized text (bold, italicized) 在強調的文本中查找趨勢(粗體,斜體)
- Look for trends in types of HTML tags used (raw text lists vs. list text wrapped in list elements) 尋找使用HTML標簽類型的趨勢(原始文本列表與列表元素中包裹的列表文本)
Predictive model accuracy can be improved by:
預測模型的準確性可以通過以下方法提高:
- Working with a larger dataset 處理更大的數據集
- Splitting dataset into three: training, test and validation sets 將數據集分為三部分:訓練集,測試集和驗證集
- Splitting salary range into numerical variables: minimum & maximum 將薪水范圍分為數字變量:最小和最大
- Removing variables that are associated with each other (i.e. use of chi-squared test of independence) 刪除相互關聯的變量(即,使用卡方獨立性檢驗)
- Splitting location into country, state, and city 將位置分為國家,州和城市
- Reducing number of variables by grouping industry and function categories 通過對行業和職能類別進行分組來減少變量數量
- Expanding the dataset to include online behaviour — i.e. number of times ad was clicked on, IP location, time ad was uploaded, etc. 擴展數據集以包含在線行為,例如,廣告被點擊的次數,IP地址,廣告被上傳的時間等。
For all the code used to generate results, see my GitHub repository — https://github.com/shedoesdatascience/fraudanalytics
有關用于生成結果的所有代碼,請參見我的GitHub存儲庫— https://github.com/shedoesdatascience/fraudanalytics
翻譯自: https://towardsdatascience.com/identifying-fraudulent-job-advertisements-using-r-programming-230daa20aec7
欺詐行為識別
本文來自互聯網用戶投稿,該文觀點僅代表作者本人,不代表本站立場。本站僅提供信息存儲空間服務,不擁有所有權,不承擔相關法律責任。 如若轉載,請注明出處:http://www.pswp.cn/news/388537.shtml 繁體地址,請注明出處:http://hk.pswp.cn/news/388537.shtml 英文地址,請注明出處:http://en.pswp.cn/news/388537.shtml
如若內容造成侵權/違法違規/事實不符,請聯系多彩編程網進行投訴反饋email:809451989@qq.com,一經查實,立即刪除!相關文章

PE文件的感染C++源代碼

c語言實驗四報告,湖北理工學院14本科C語言實驗報告實驗四數組


rabbitmq channel參數詳解【轉】
)
感染EXE文件代碼(C++)

nlp gpt論文_GPT-3:NLP鎮的最新動態

真實不裝| 阿里巴巴新人上路指北


tomcat java環境配置

uber 數據可視化_使用R探索您在Uber上的活動:如何分析和可視化您的個人數據歷史記錄
Ribbon)
java B2B2C springmvc mybatis電子商城系統(四)Ribbon

c語言函數的形參有幾個,C中子函數最多有幾個形參

Linux上Libevent的安裝

Win7安裝oracle 10 g
![基于plotly數據可視化_[Plotly + Datashader]可視化大型地理空間數據集](http://pic.xiahunao.cn/基于plotly數據可視化_[Plotly + Datashader]可視化大型地理空間數據集)
基于plotly數據可視化_[Plotly + Datashader]可視化大型地理空間數據集

Centos用戶和用戶組管理

吹氣球問題的C語言編程,C語言怎樣給一個數組中的數從大到小排序


劃痕實驗 遷移面積自動統計_從Jupyter遷移到合作實驗室
)