一、安裝prometheus
1.1 安裝
prometheus官網下載地址
sudo -i
mkdir -p /opt/prometheus
#移動解壓后的文件名到/opt/,并改名prometheus
mv prometheus-2.45 /opt/prometheus/
#創建一個專門的prometheus用戶: -M 不創建家目錄, -s 不讓登錄
useradd -M -s /usr/sbin/nologin prometheus##更改prometheus用戶的文件夾權限:
chown prometheus:prometheus -R /opt/prometheus
1.2 修改配置
global:scrape_interval: 30s # Set the scrape interval to every 15 seconds. Default is every 1 minute.evaluation_interval: 30s # Evaluate rules every 15 seconds. The default is every 1 minute.# 其他全局配置...scrape_configs:# Prometheus 自身的監控配置- job_name: "prometheus"static_configs:- targets: ["localhost:9070"]- job_name: 'node_widgets'scheme: https # 使用 HTTPStls_config:insecure_skip_verify: true # 忽略證書驗證static_configs:- targets: ['xxxxx.xxx.com:443'] # 替換為您的服務器 B 地址和端口metrics_path: '/prometheus/metrics' # Node Exporter 的路徑
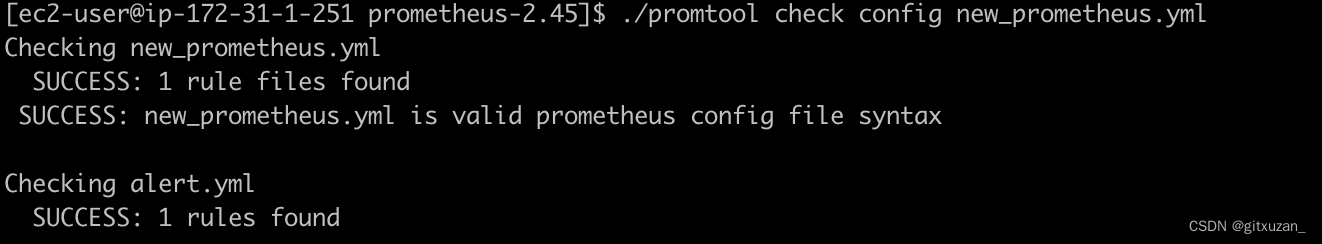
如果修改了配置可以驗證配置
./promtool check config new_prometheus.yml
熱更新
curl -X POST http://localhost:9070/-/reload
1.3 配置自啟動
vim /etc/systemd/system/prometheus.service
寫入數據
[Unit]
Description=Prometheus Server
After=network-online.target
[Service]
Type=simple
User=prometheus
Group=prometheus
Restart=on-failure
WorkingDirectory=/opt/prometheus/prometheus-2.45
ExecStart=/opt/prometheus/prometheus-2.45/prometheus --web.listen-address ":9070" --config.file /opt/prometheus/prometheus-2.45/new_prometheus.yml --storage.tsdb.path /opt/prometheus/prometheus-2.45/data --storage.tsdb.retention.time=20d --web.enable-lifecycle
[Install]
WantedBy=multi-user.target
開機自啟動
sudo systemctl daemon-reload
sudo systemctl enable prometheus
sudo systemctl restart prometheus
sudo systemctl status prometheus
二、安裝node_exporter
2.1 官網下載地址 https://prometheus.io/download/
2.2 開機自啟動
添加
sudo vim /etc/systemd/system/node_exproter.service
[Unit]
Description=node_exporter
Documentation=https://prometheus.io/
After=network.target
[Service]
User=ubuntu
Group=ubuntu
ExecStart=/opt/prometheus/node_exproter-1.7.0/node_exporter --web.listen-address=":9101"
Restart=on-failure
[Install]
WantedBy=multi-user.target
sudo systemctl daemon-reload
sudo systemctl enable node_exproter
sudo systemctl restart node_exproter
sudo systemctl status node_exproter
三、安裝grafana
3.1 官網下載地址 https://grafana.com/grafana/download?edition=oss&platform=linux
3.2 添加開機啟動
添加service
sudo vim /etc/systemd/system/grafana.service
[Unit]
Description=Grafana server
Documentation=http://docs.grafana.org
[Service]
Type=simple
User=prometheus
Group=prometheus
Restart=on-failure
ExecStart=/opt/prometheus/grafana-v10.2.2/bin/grafana-server \--config=/opt/prometheus/grafana-v10.2.2/conf/grafana.ini \--homepath=/opt/prometheus/grafana-v10.2.2 \--http-port=3000
[Install]
WantedBy=multi-user.target
3.2 修改 grafana.init 郵箱配置
[smtp]
enabled = true
host = smtp.gmail.com:587
user = xuzan@lippu.ltd
# If the password contains # or ; you have to wrap it with triple quotes. Ex """#password;"""
password = 授權碼
cert_file =
key_file =
skip_verify = true
from_address = xuzan@lippu.ltd
from_name = Grafana
ehlo_identity =
startTLS_policy =
sudo systemctl daemon-reload
sudo systemctl enable grafana
sudo systemctl restart grafana
sudo systemctl status grafana
四、alertmanager 安裝
4.1 安裝官網地址 https://prometheus.io/download/
4.2 新增啟動項
編輯
sudo vim /etc/systemd/system/alertmanager.service
[Unit]
Description=Alert Manager
Wants=network-online.target
After=network-online.target[Service]
Type=simple
User=prometheus
Group=prometheus
ExecStart=/opt/prometheus/alertmanager-0.26.0/alertmanager \--config.file=/opt/prometheus/alertmanager-0.26.0/alertmanager.yml \--storage.path=/opt/prometheus/alertmanager-0.26.0/data \--web.listen-address=:9071 \--cluster.listen-address=:9072Restart=always[Install]
WantedBy=multi-user.target
sudo systemctl daemon-reload
sudo systemctl enable alertmanager
sudo systemctl restart alertmanager
sudo systemctl status alertmanager
4.3 使用了prometheus 需要修改 new_prometheus.yml
新增
# Alertmanager configuration
alerting:alertmanagers:- static_configs:- targets:- alertmanager:9071# Load rules once and periodically evaluate them according to the global 'evaluation_interval'.
rule_files:- "alert.yml"
在項目更目錄下新增 新增alert.yml
groups:
- name: Prometheus alertrules:# 對任何實例超過30s無法聯系的情況發出警報- alert: 服務告警expr: up == 0for: 30slabels:severity: criticalannotations:instance: "{{ $labels.instance }}"description: "{{ $labels.job }} 服務已關閉"
具體告警規則:alert: 這是告警的名稱,在這個例子中命名為 "服務告警"。
expr: 這是觸發告警的表達式。在這個例子中,表達式 up == 0 檢查 up 指標是否等于 0。up 指標是 Prometheus 用來表示目標實例可達性的標準指標,其中 0 表示不可達,1 表示可達。
for: 這個條件指定了在觸發告警之前必須滿足告警條件的持續時間。在這里設置為 30s,意味著只有當 up 指標持續為 0 超過 30 秒時,才會觸發告警。
labels: 這部分定義了附加到告警上的標簽。在這個例子中,它設置了一個嚴重性標簽(severity: critical),表示這是一個嚴重的告警。
annotations:
這部分提供了關于告警的更多信息,通常用于在告警通知中顯示。在這個例子中,它包括兩個注解:
instance: "{{ $labels.instance }}":這將顯示觸發告警的實例。
description: "{{ $labels.job }} 服務已關閉":這提供了一個描述性的消息,指出哪個服務(job)已經關閉。
4.4 驗證配置
./promtool check config new_prometheus.yml
重新熱加載配置
curl -X POST http://localhost:9070/-/reload
五、grafana 添加數據源
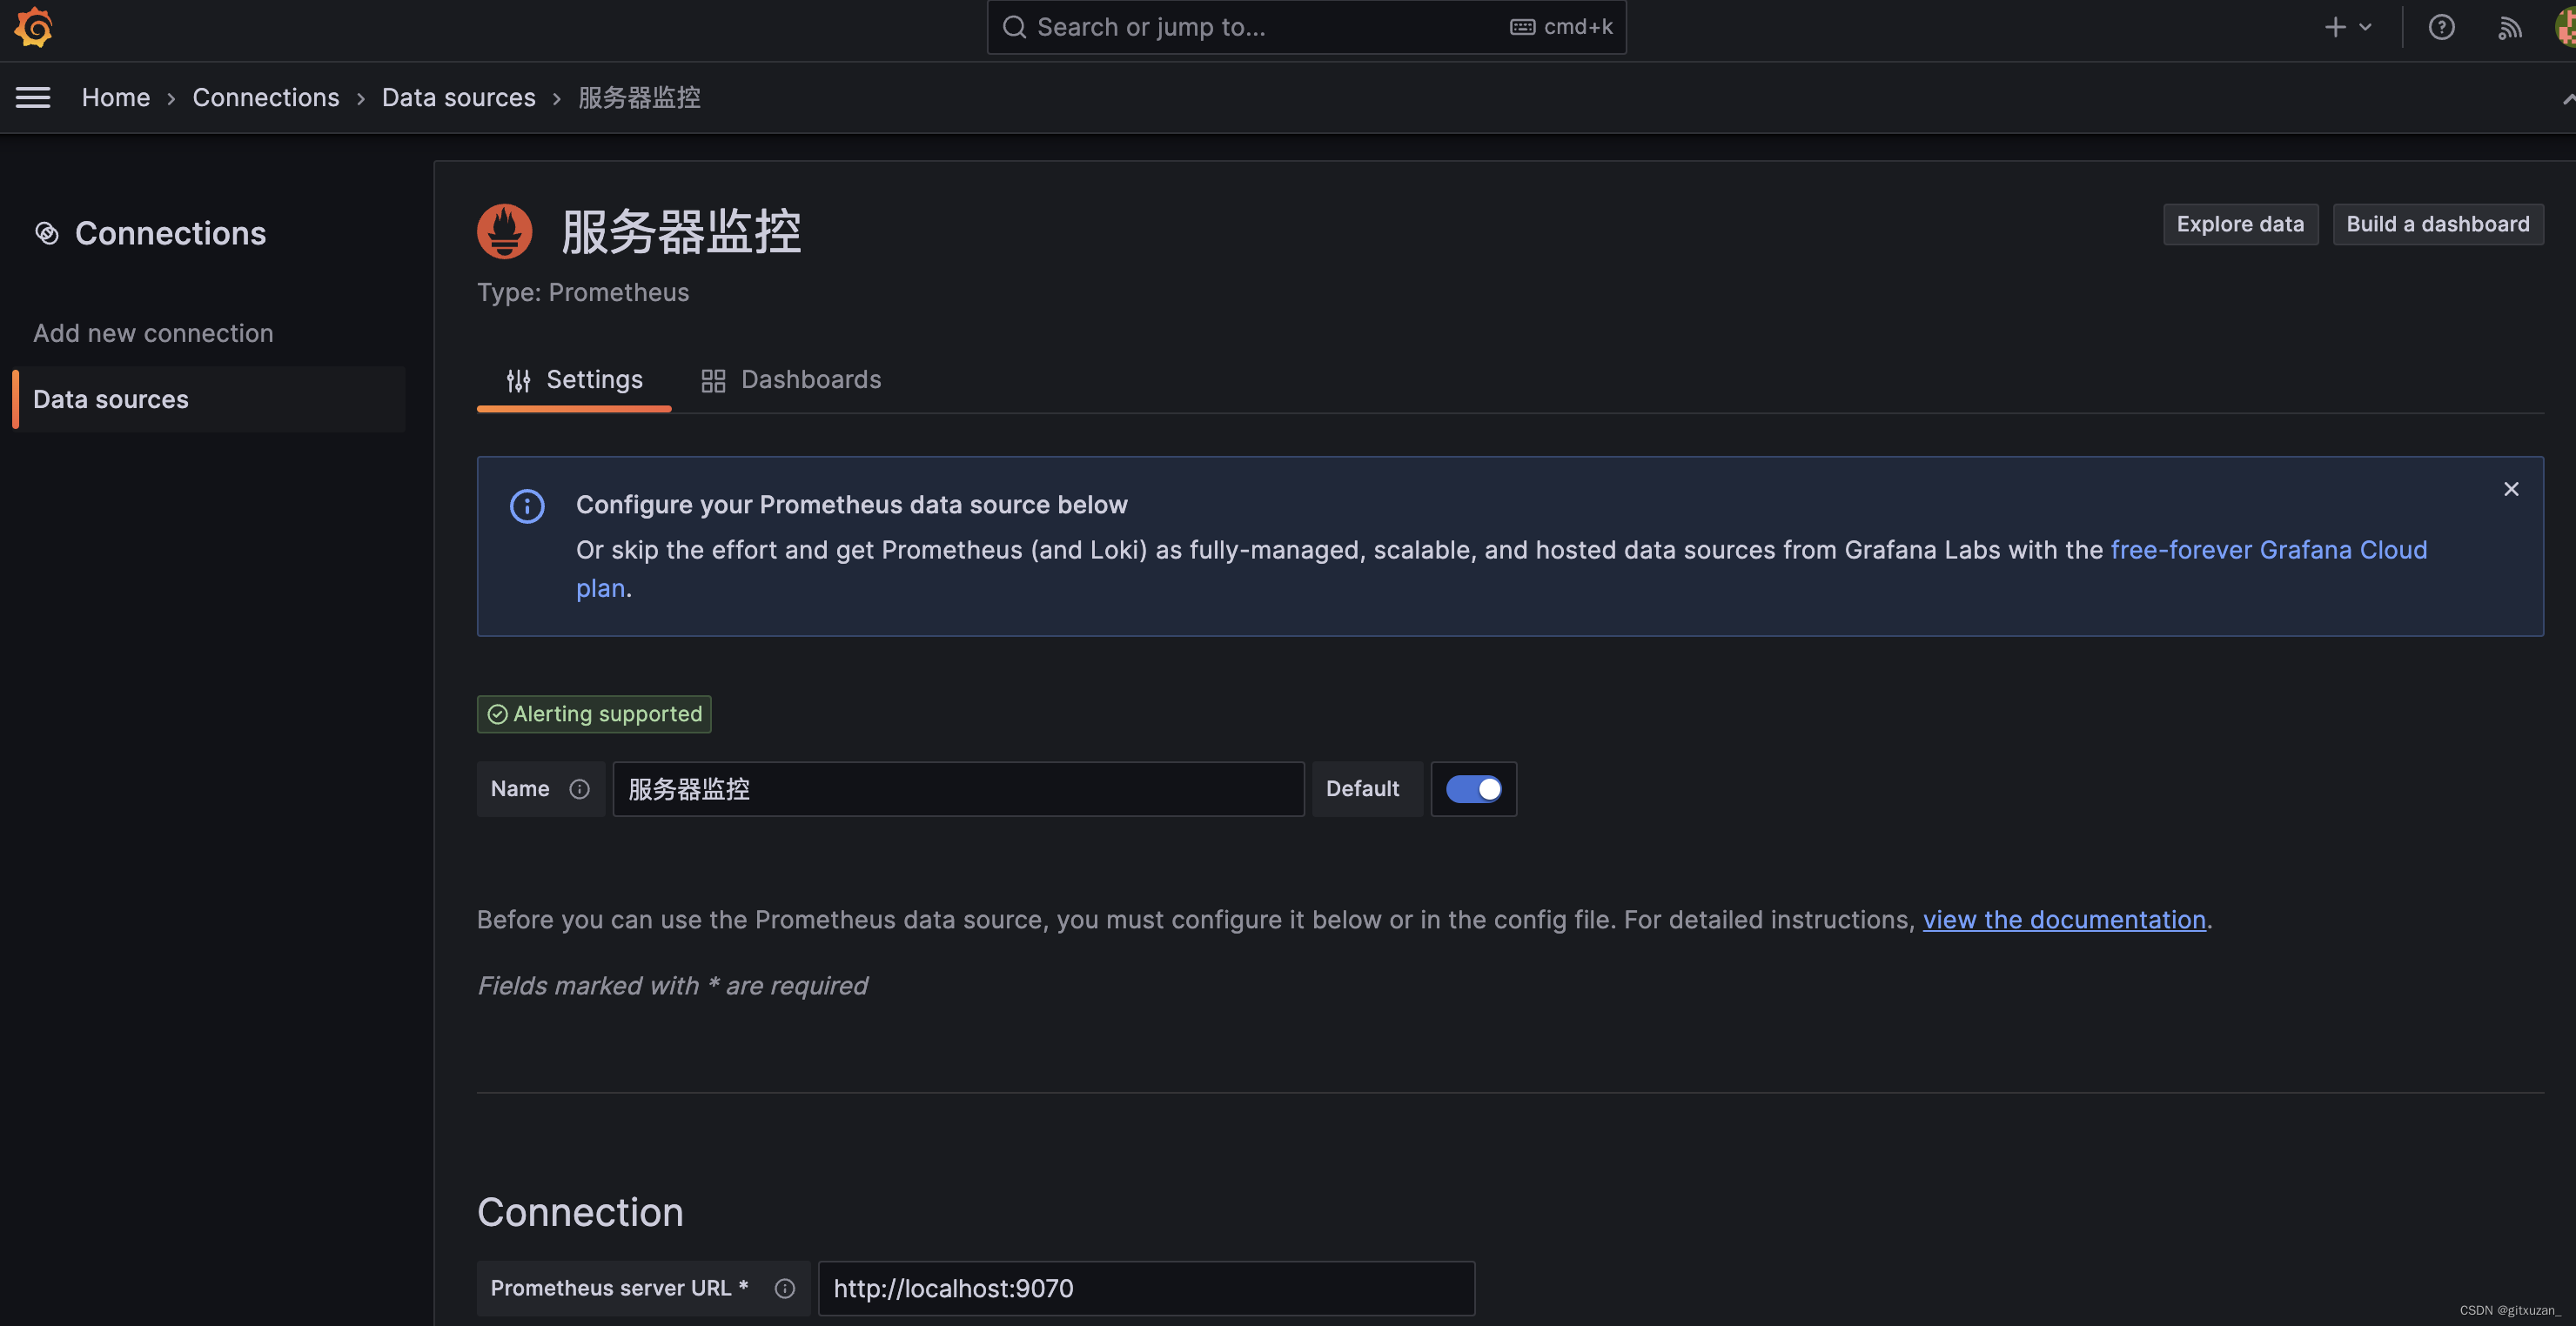
5.1 添加數據來源
這里填寫prometheus 的數據源地址,因為grafana 和 prometheus 放到一臺服務器上了,所以我填寫的是localhost
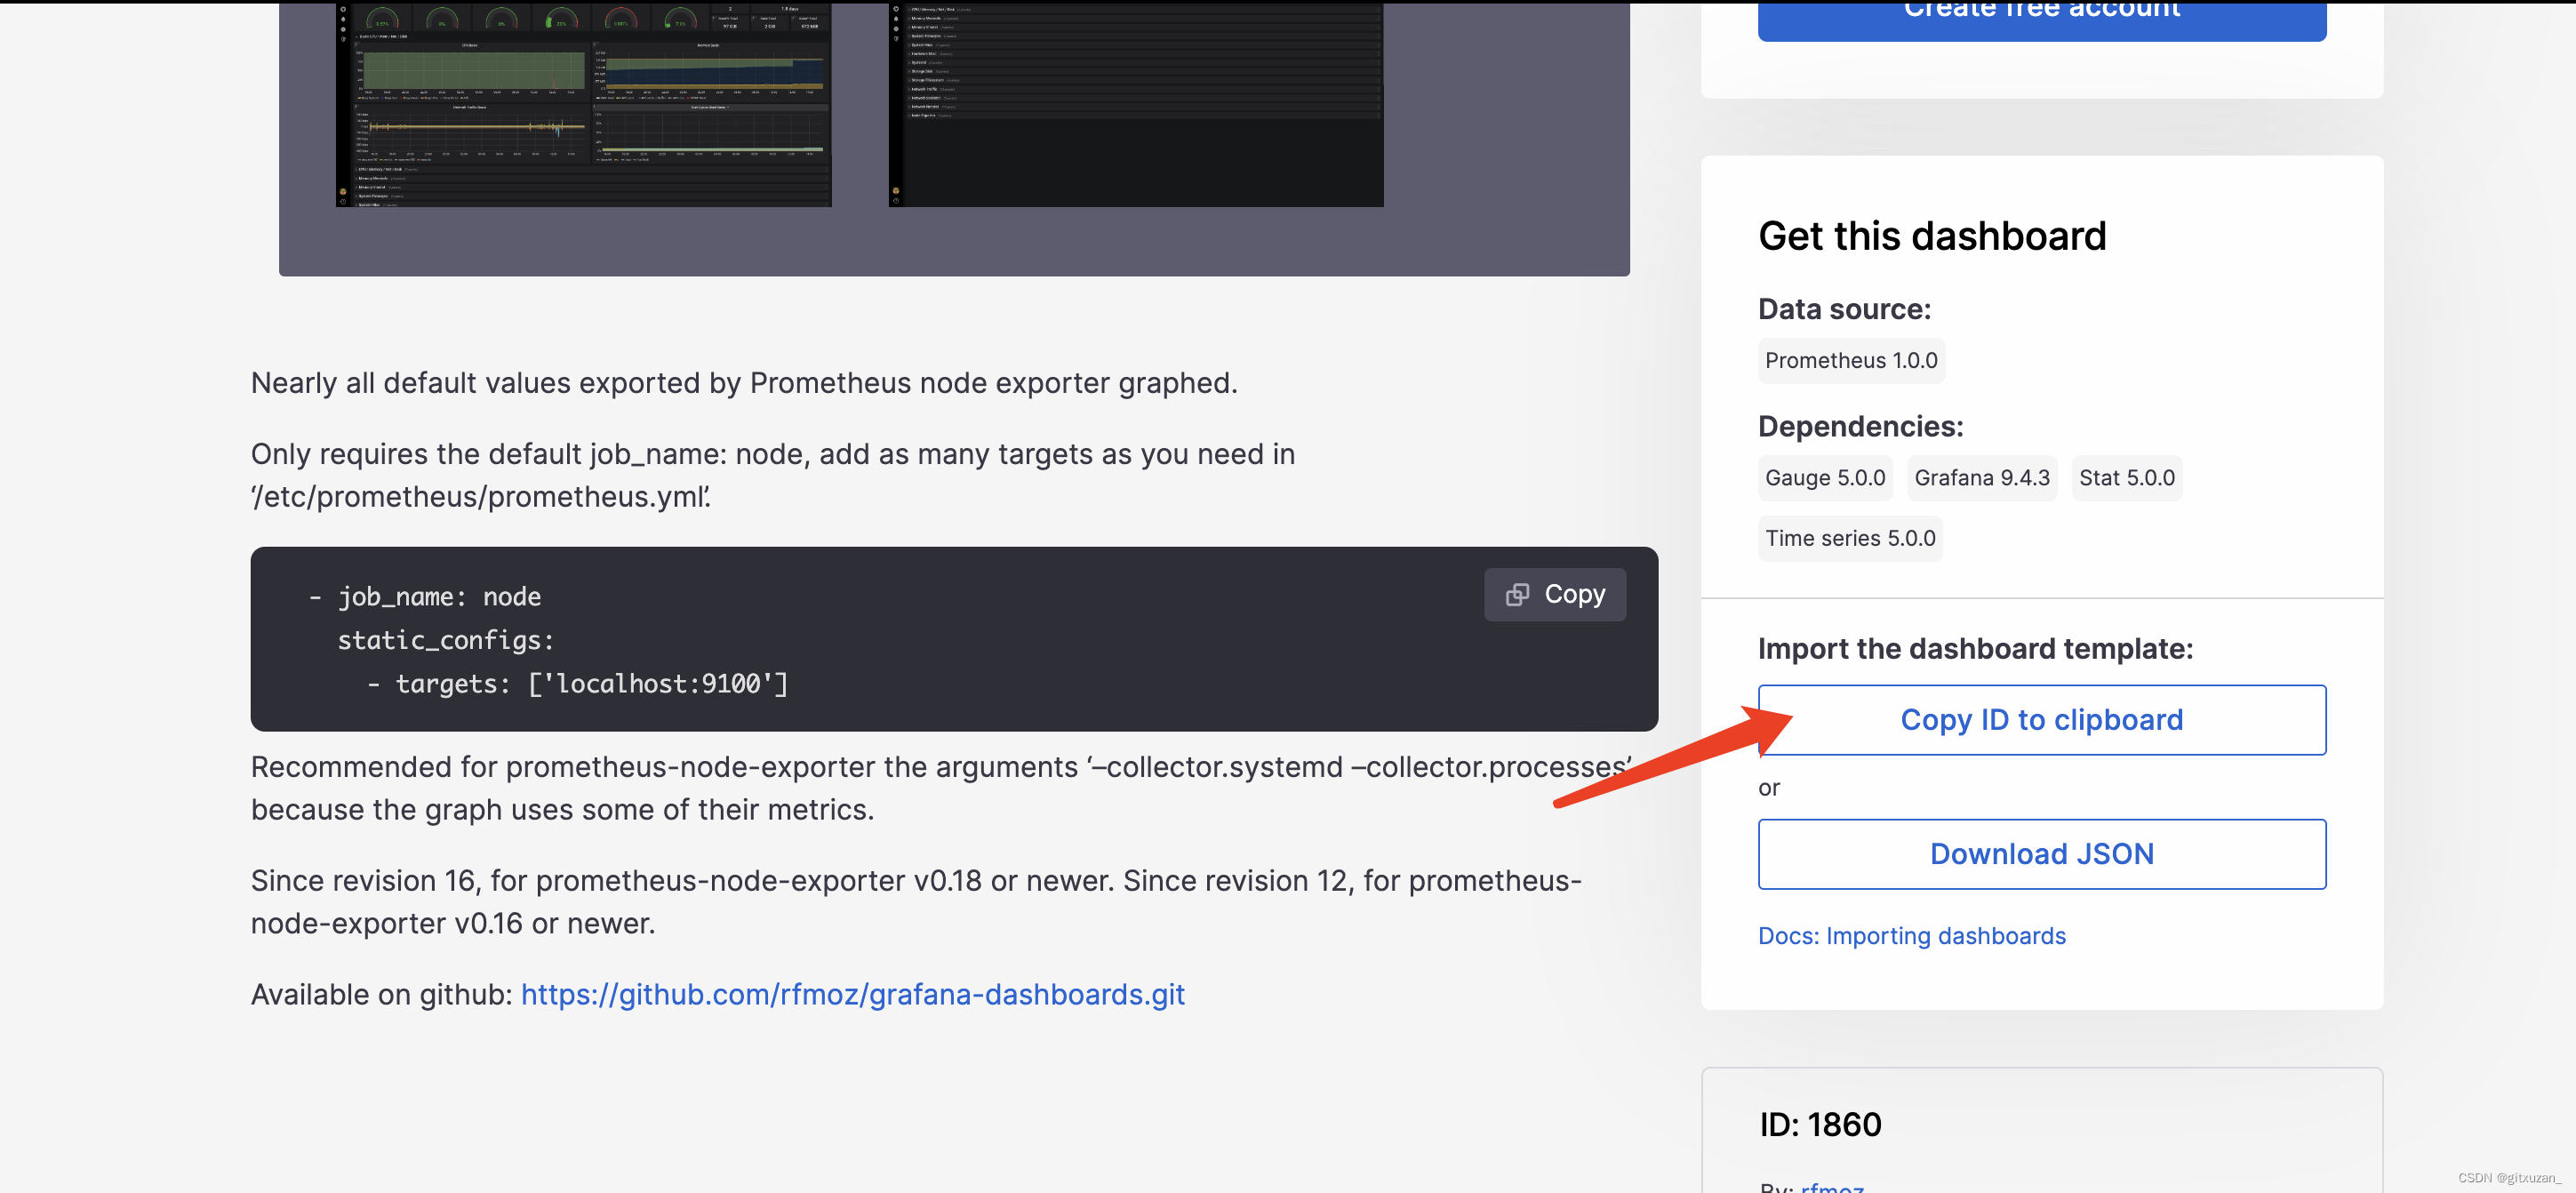
5.2 添加dashboards,添加地址: https://grafana.com/grafana/dashboards/
選擇一個dashborads

copy dashborads 的ID
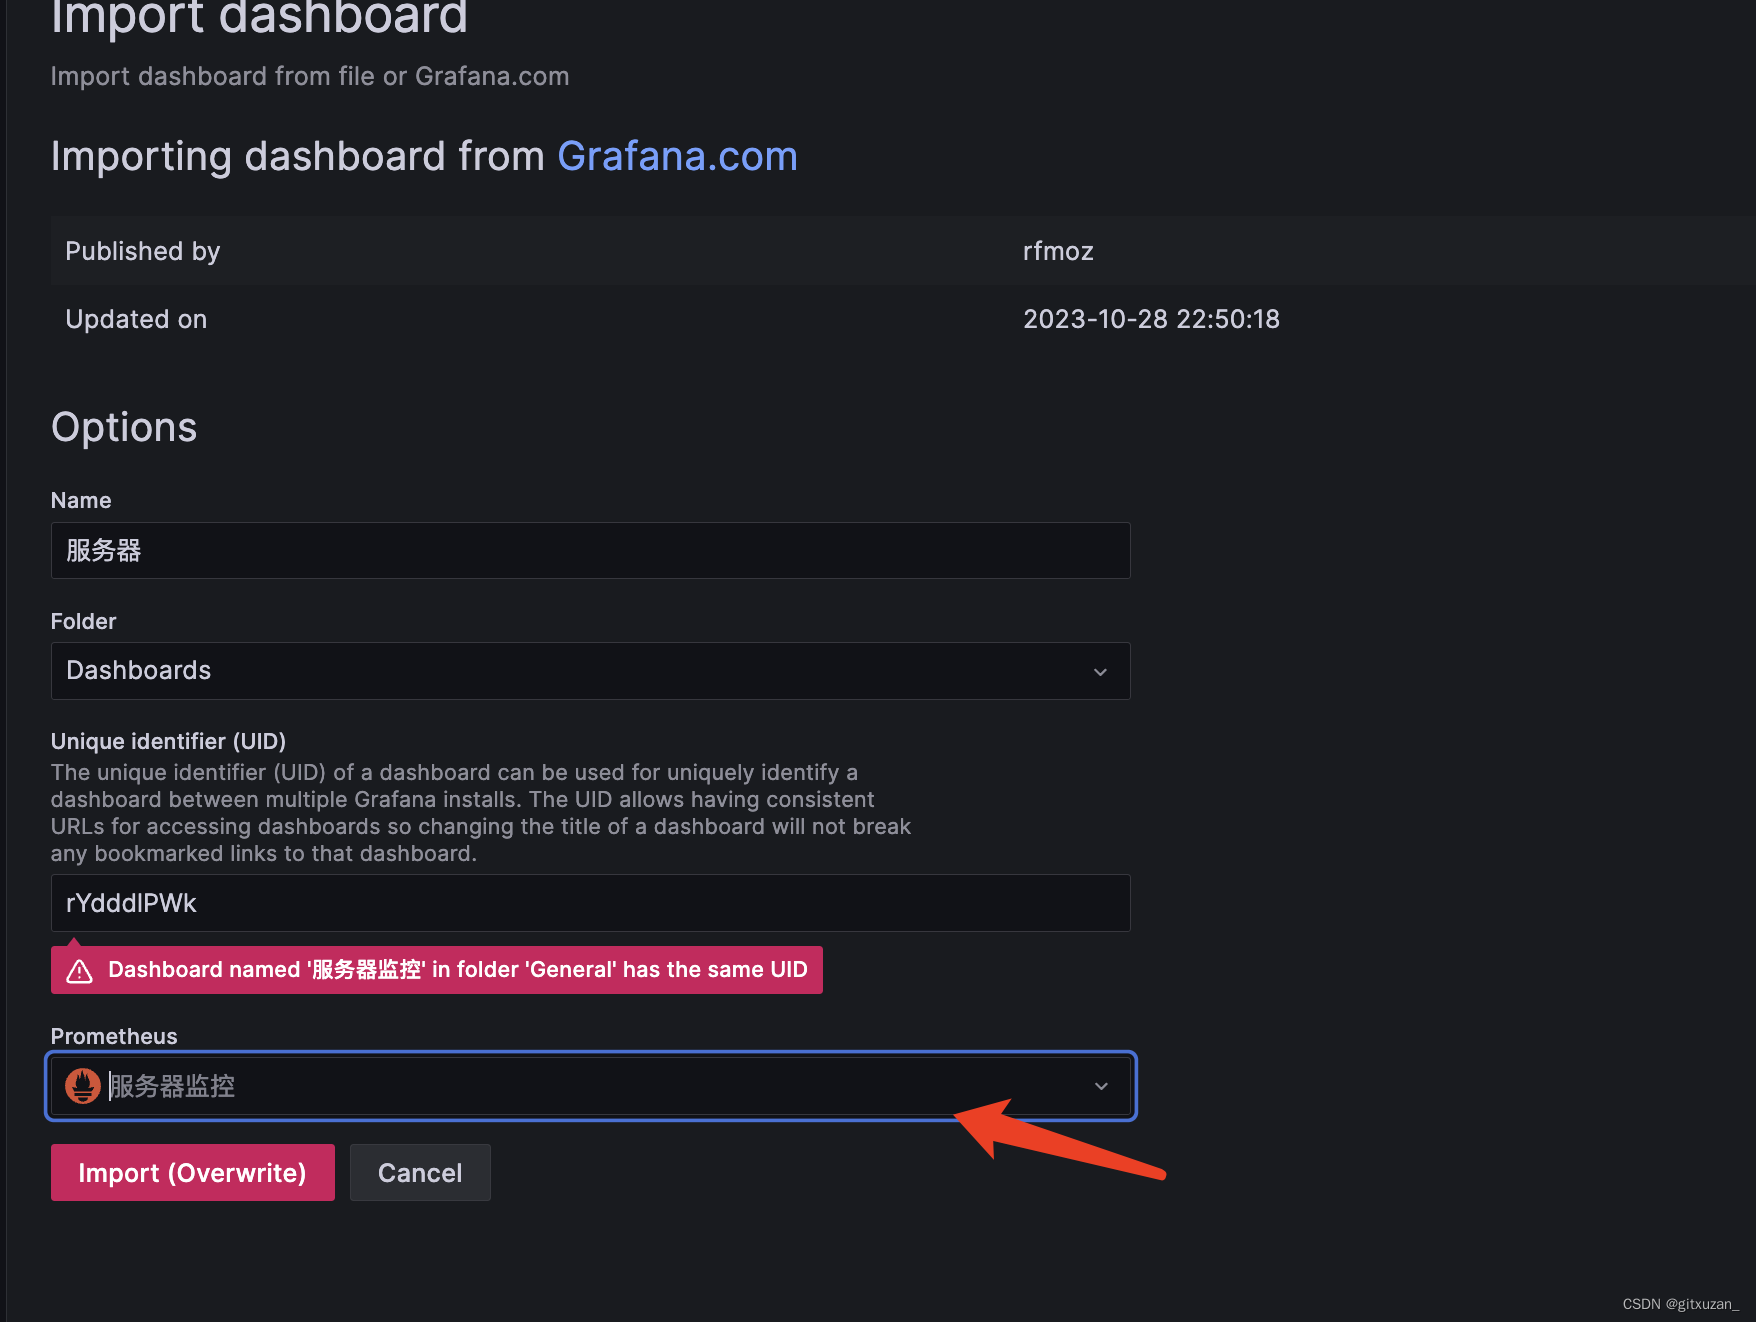
在grafana 界面導入dashborad ,可以通過ID導入
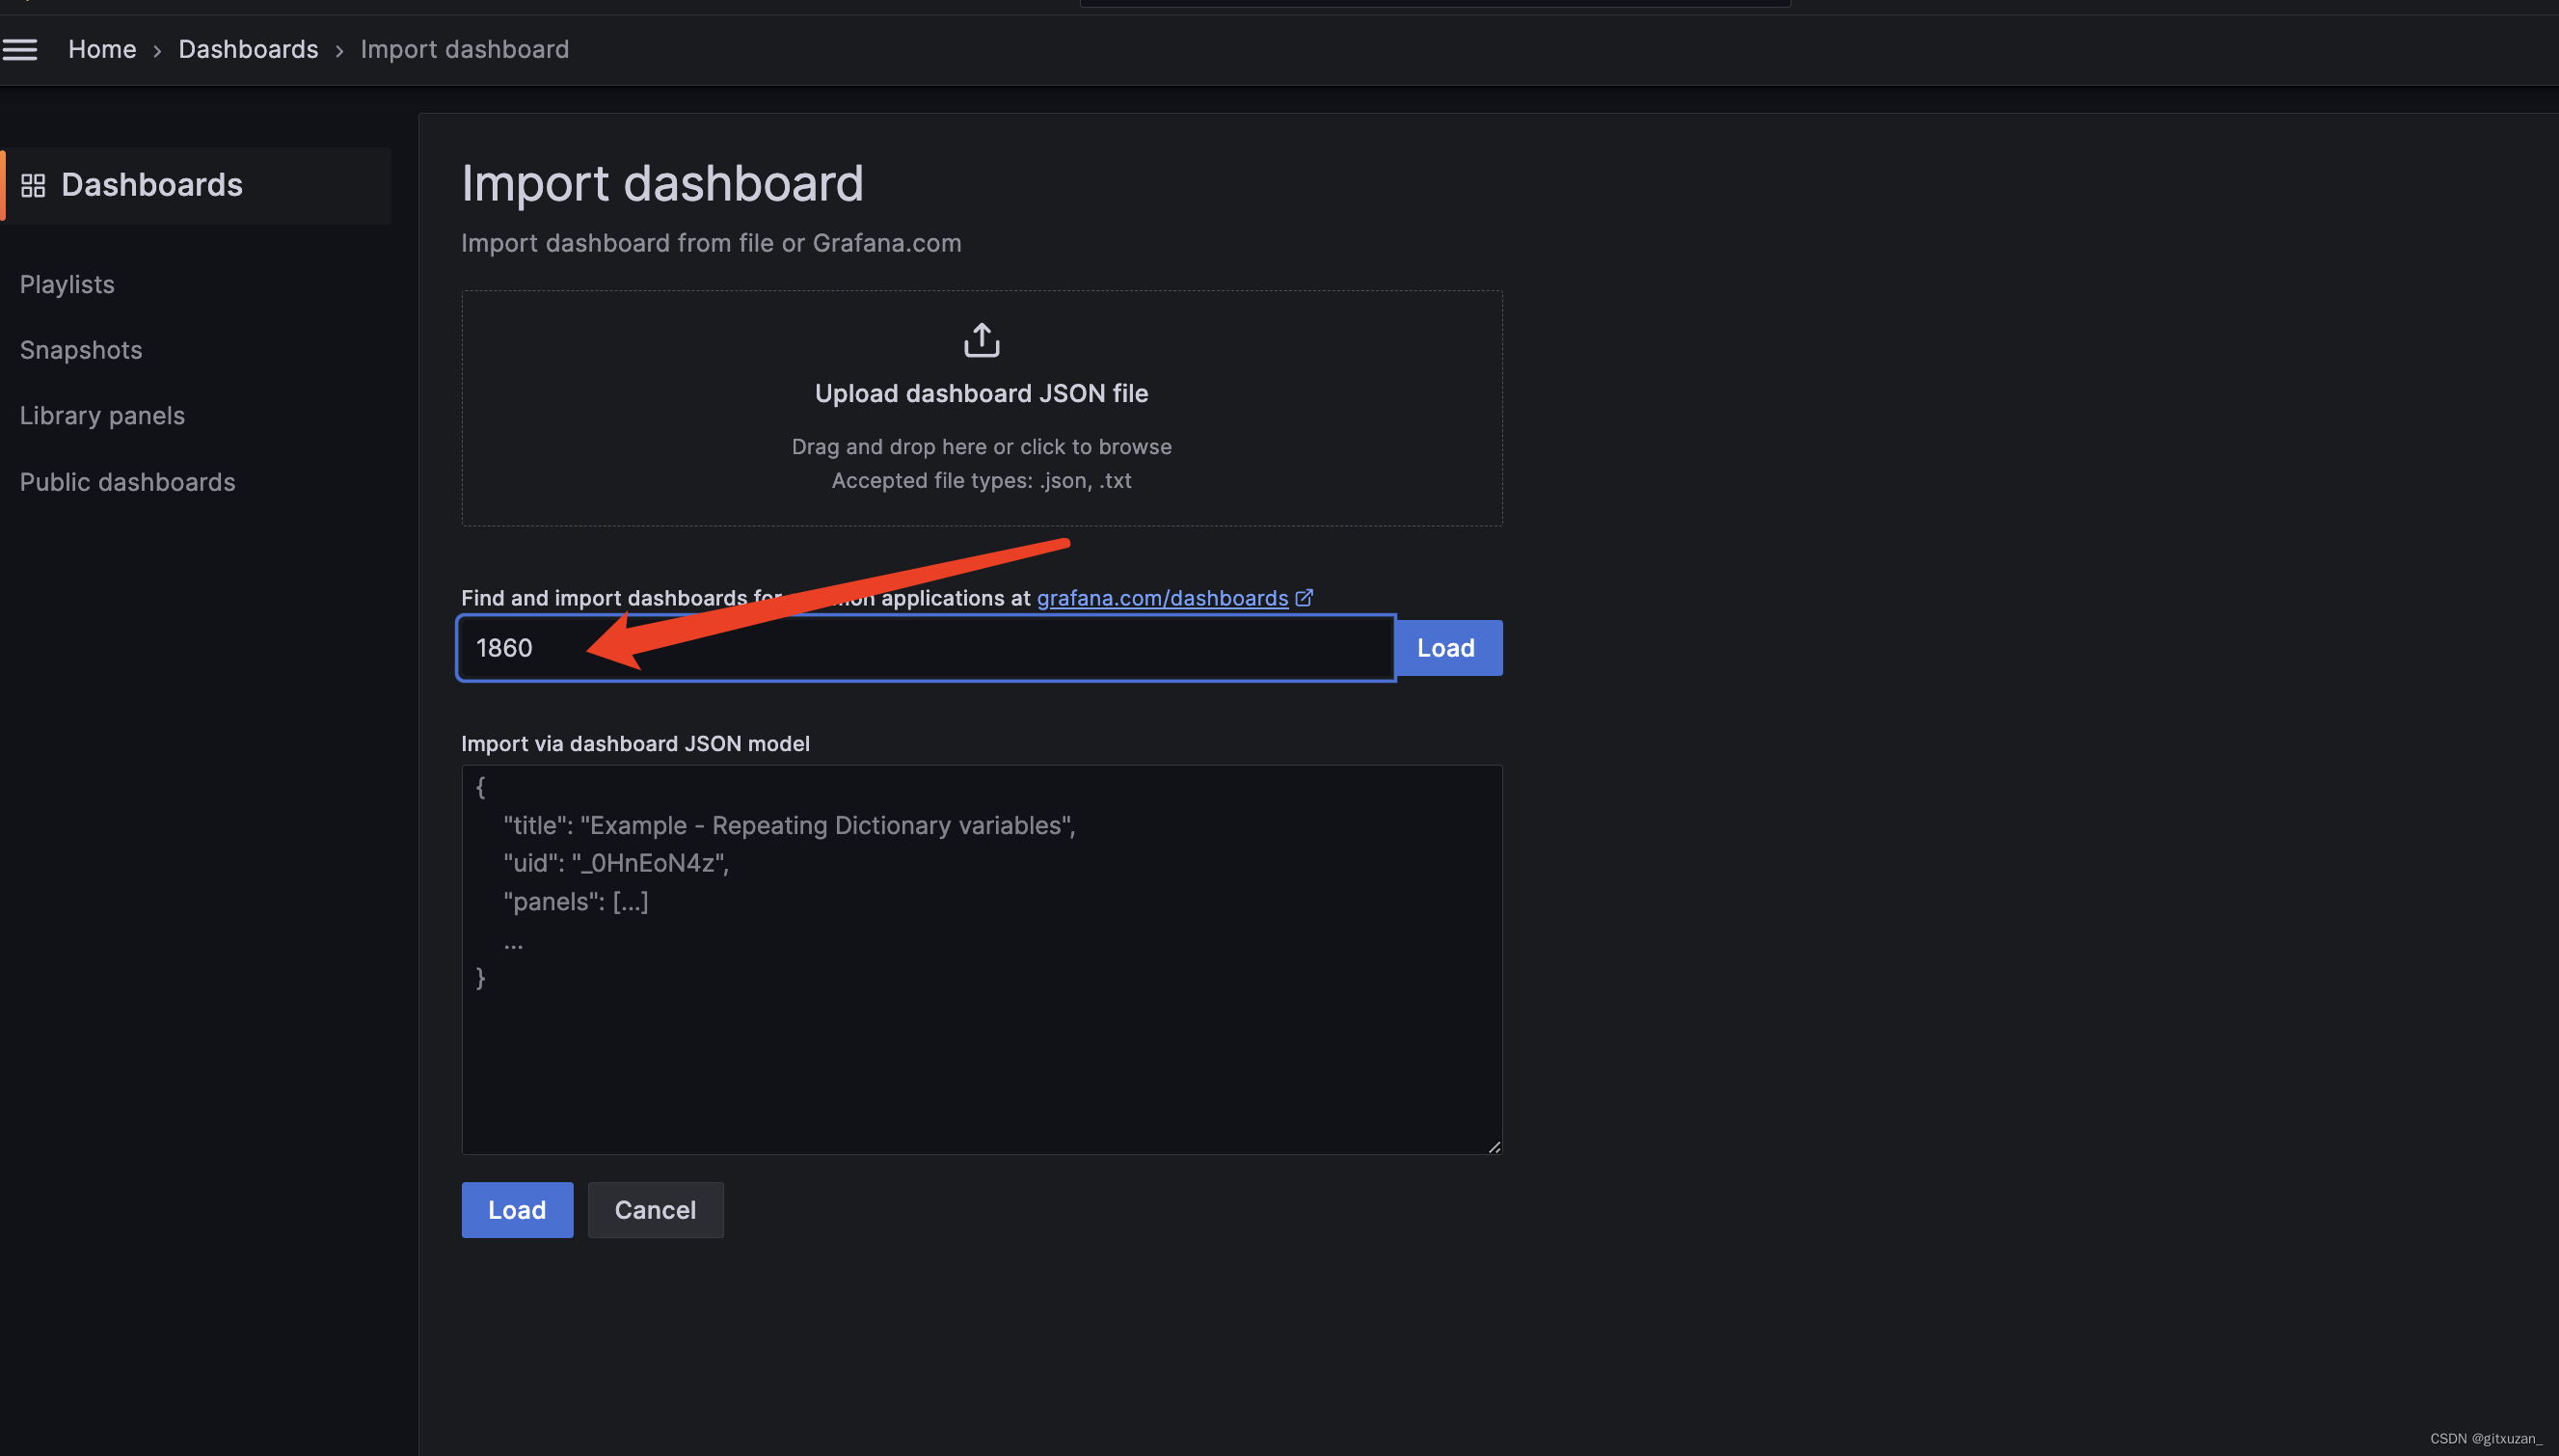
最后選擇剛剛的數據源
最終顯示
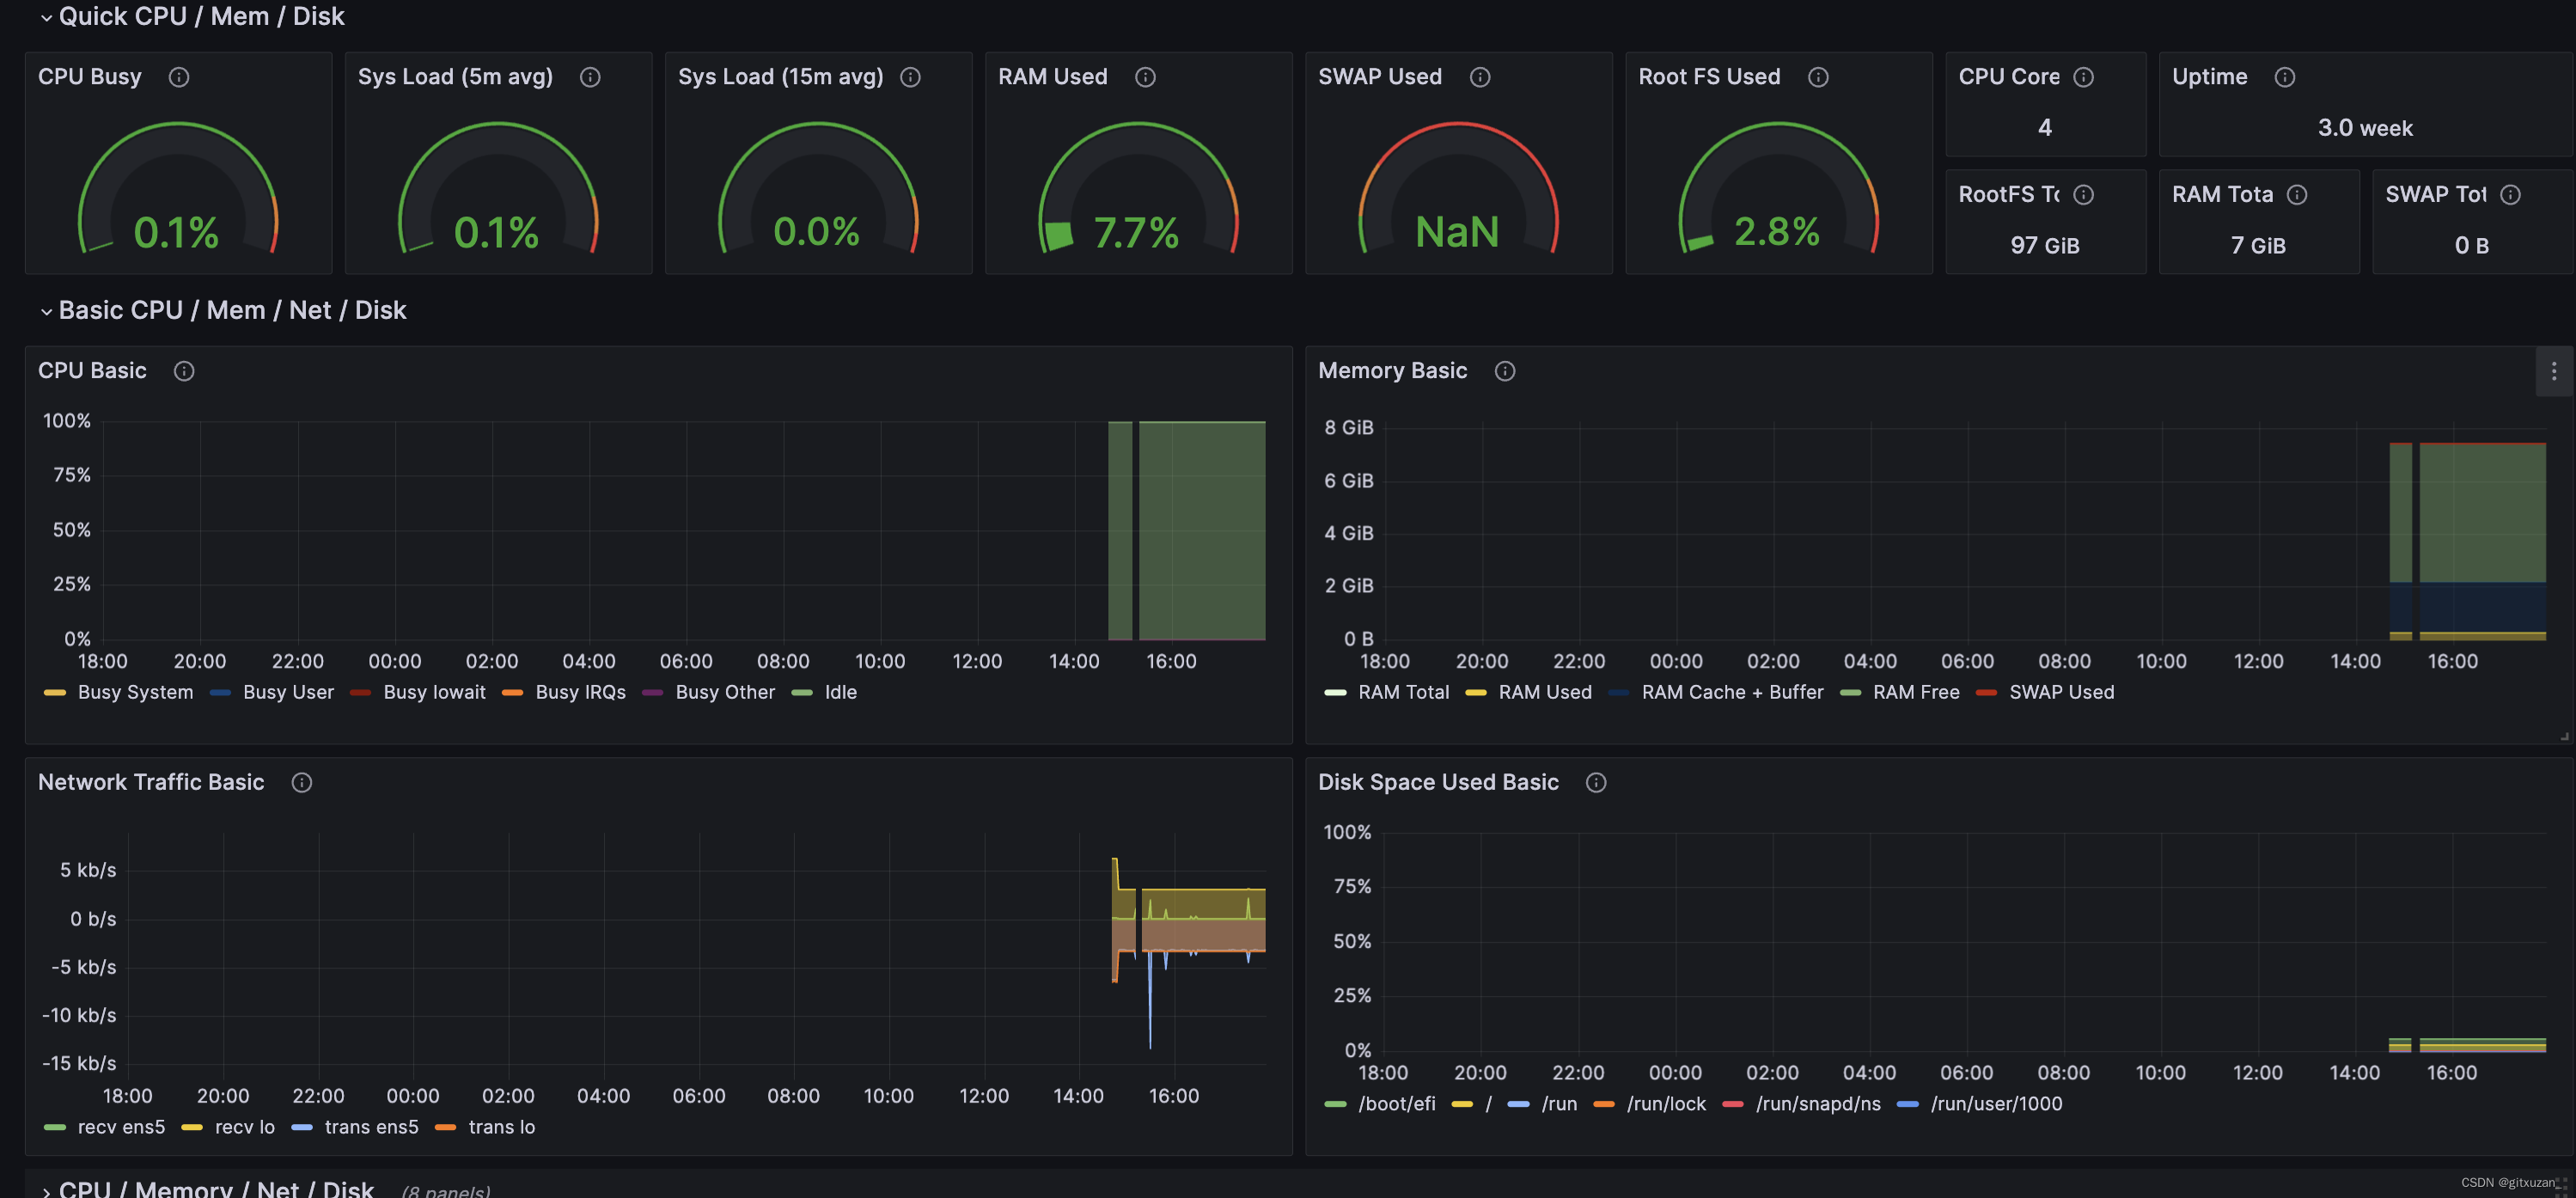


)


)


 on i.MX RT1060 EVK - 3 “編譯 NXP i.MX RT1060”( 完 ))

】解線性代數方程組的迭代法(一):向量、矩陣范數與譜半徑【理論到程序】)

