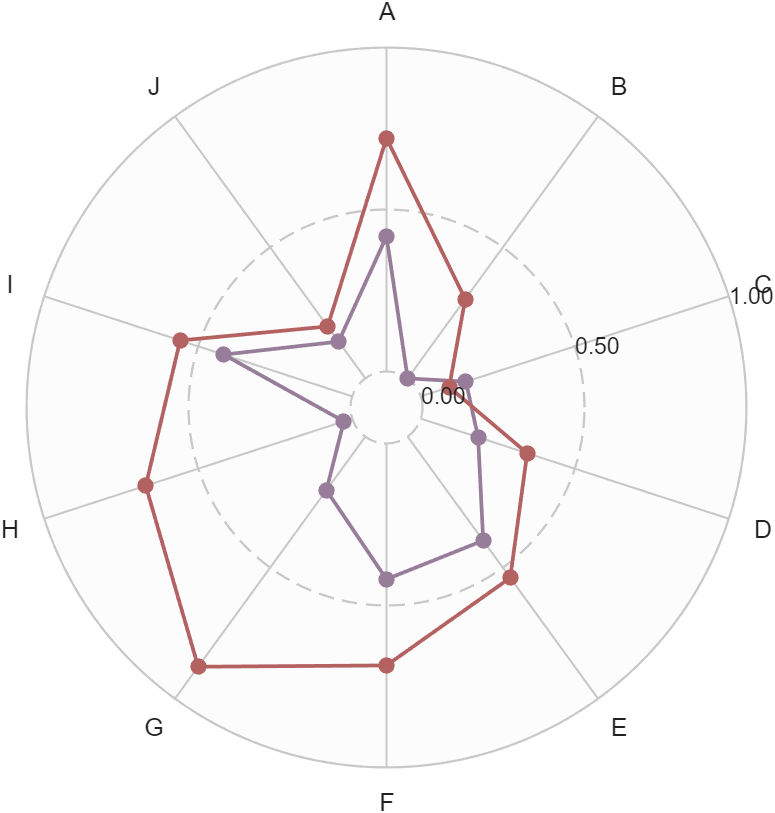
Hello 真的好久不見,這期畫一個Nature同款雷達圖,原圖是下圖中的i圖,長這樣:
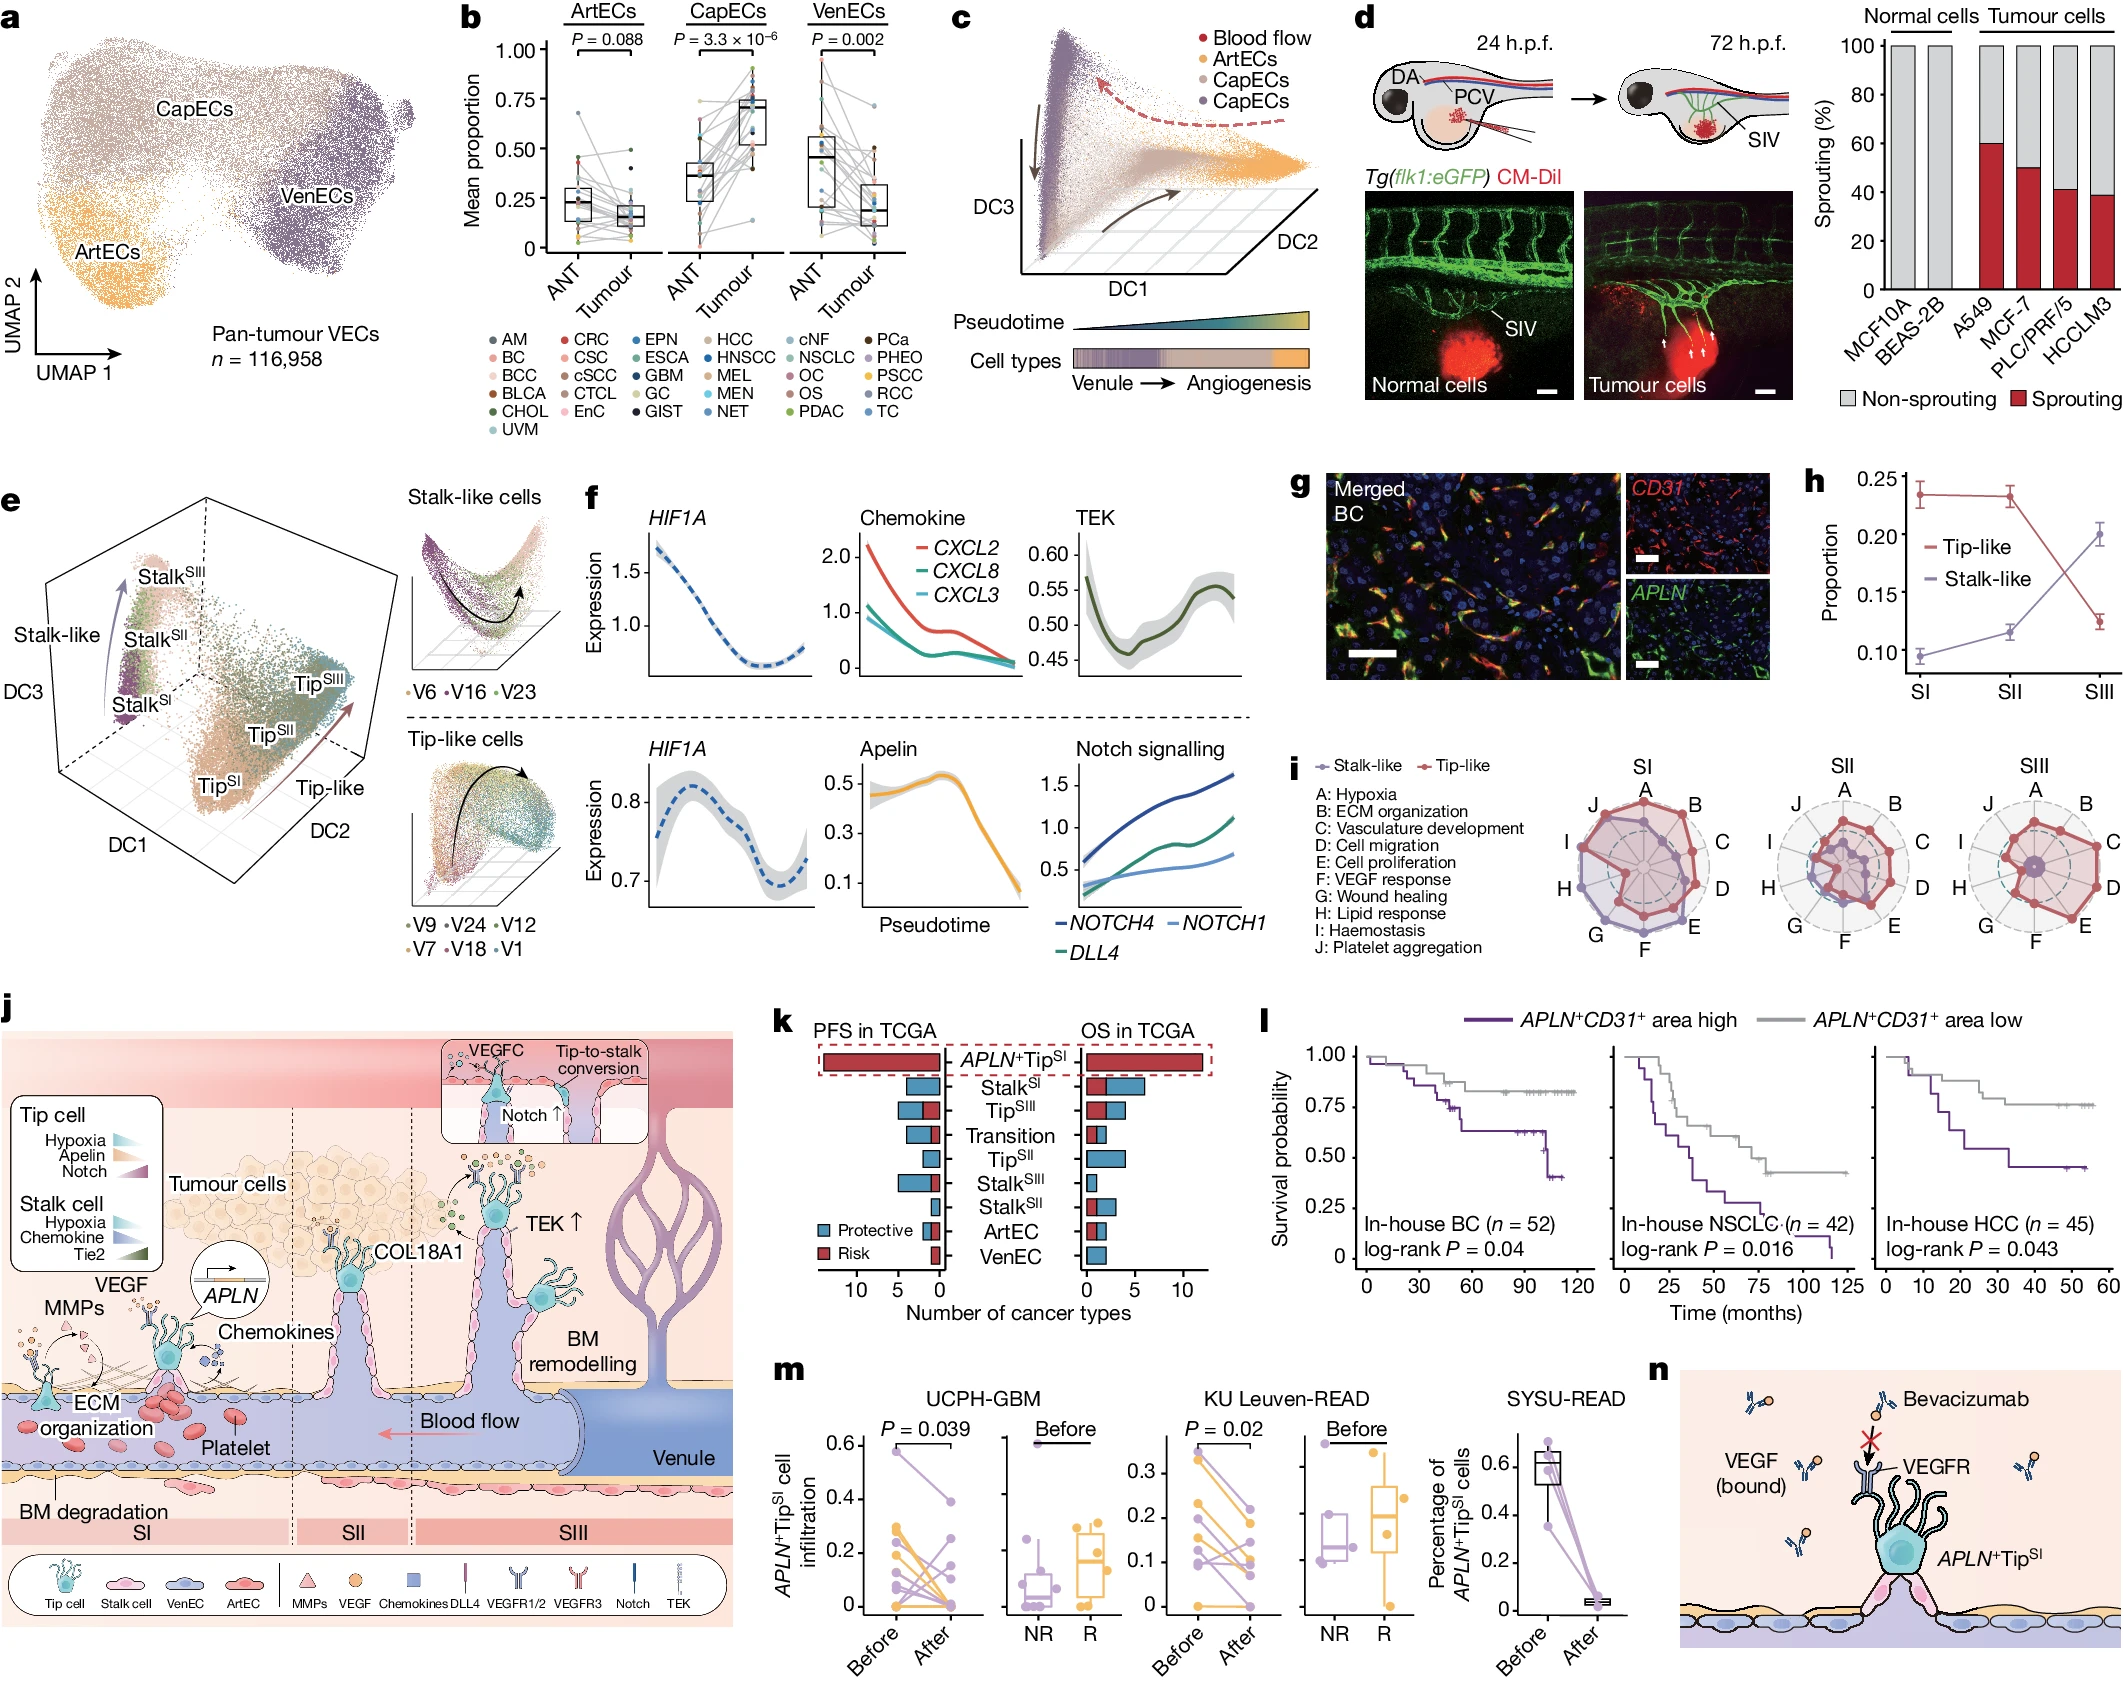
本圖出自:
- Pan, X., Li, X., Dong, L. et al. Tumour vasculature at single-cell resolution. Nature 632, 429–436 (2024). https://doi.org/10.1038/s41586-024-07698-1
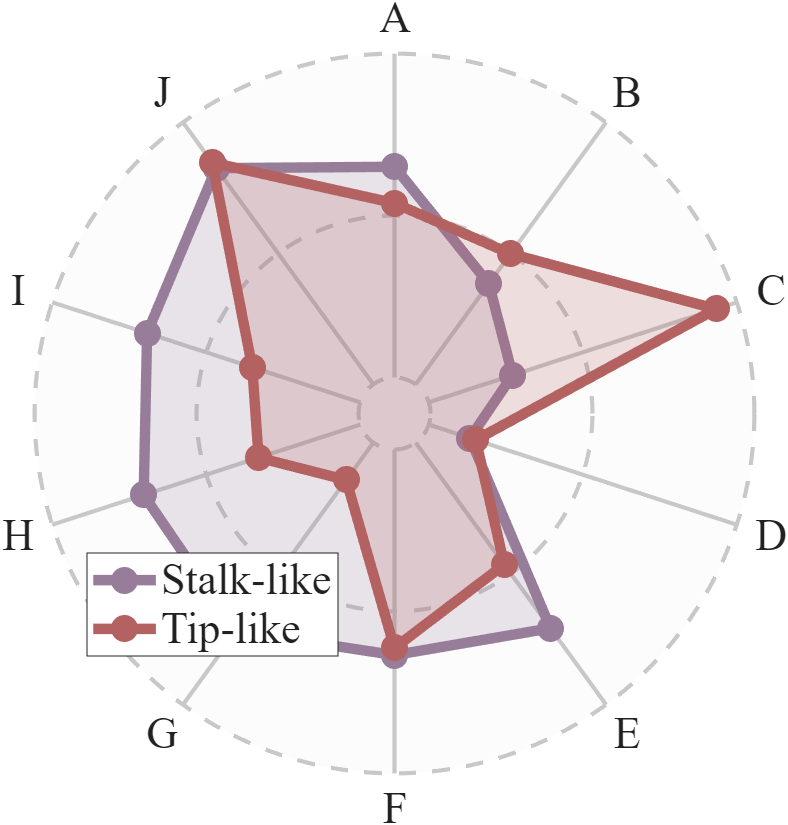
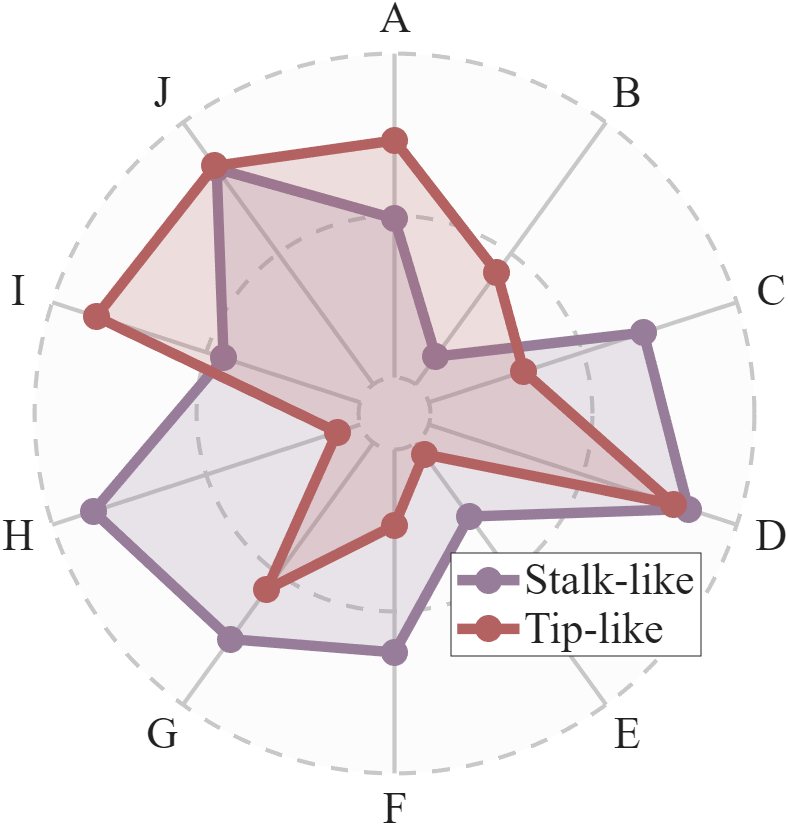
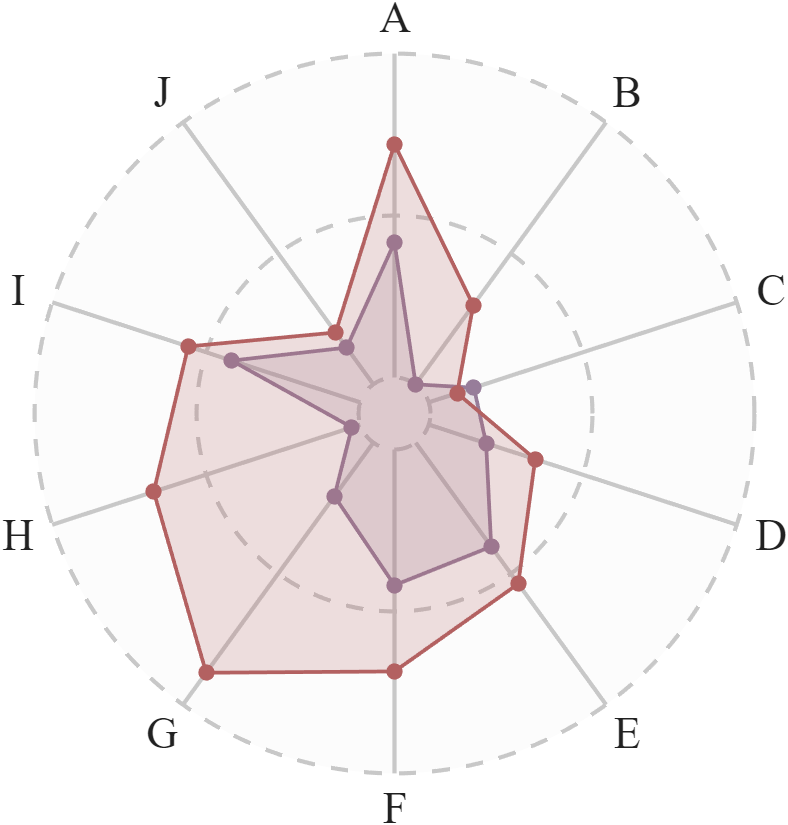
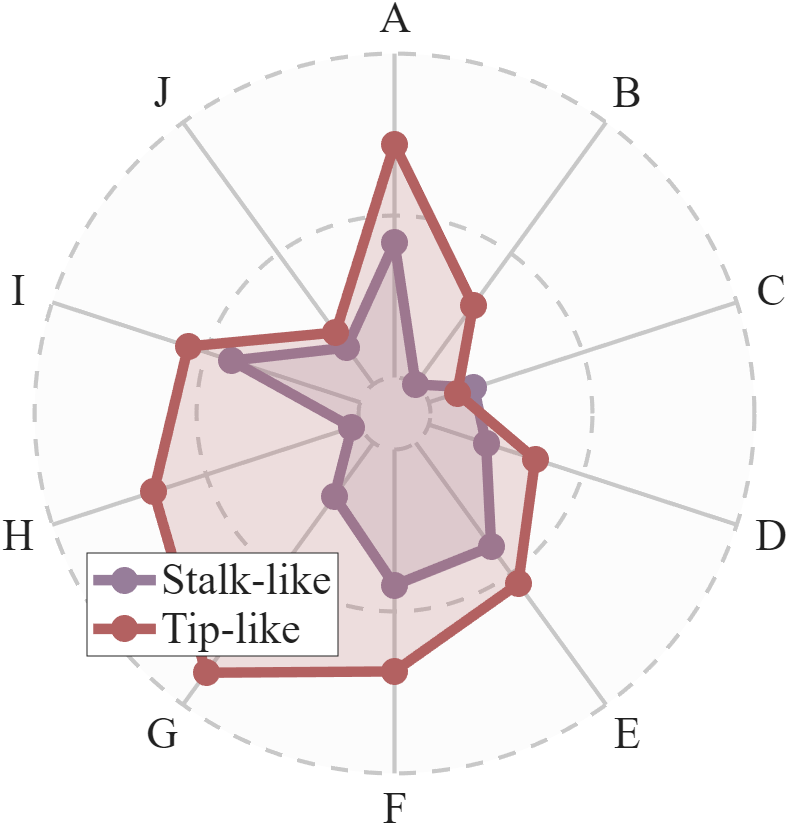
本期復刻效果:
本期說是繪圖復刻其實本質上是對很久之前寫的雷達圖工具的一次功能開發,雷達圖工具可以在 fileexchange 找到:
- https://www.mathworks.com/matlabcentral/fileexchange/126450-radar-chart
當然我會把工具和完整代碼一并放入gitee平臺并把鏈接在文末分享。先開始正文,首先給個該工具的基本用法:
X=randi([2,8],[4,7])+rand([4,7]); % 隨機生成數據
RC=radarChart(X); % 生成雷達圖對象
RC.PropName={'建模','實驗','編程','總結','撰寫','創新','摸魚'};
RC.ClassName={'同門A','同門B','同門C','同門D'};
RC=RC.draw(); % 畫圖
RC=RC.legend(); % 添加圖例
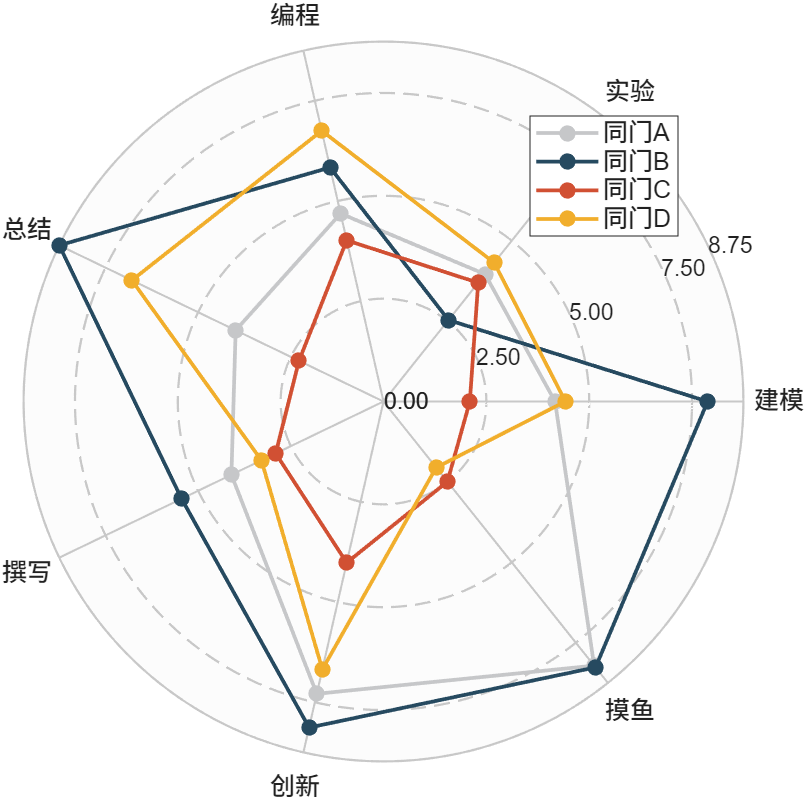
可以看到使用方法非常簡單。
以下開始復刻 Nature繪圖:
正文
0.數據準備和對象創建
figure('Position',[600,200,600,600]);Data1 = rand([2,10]);
RC = radarChart(Data1);
1.基礎設置和繪圖
包括刻度范圍,背景所占范圍,初始角度,標簽是順時針還是逆時針排布等信息,以及變量名和配色。
RC.RLim = [0,1];         % 數據范圍設置為 0,1            Set the data range to be between 0 and 1
RC.RTick = [0,.5,1];     % 半徑刻度 0,.5,1              Set radius ticks at 0, 0.5, and 1
RC.RRange = [.1,1];      % 背景所占的比例范圍            Set the range for the background (0.1 to 1)
RC.Rotation = pi/2;      % 初始角度                     Set the initial angle
RC.ThetaDir = 'reverse'; % 標簽排布方向(逆時針還是順時針) Set the direction of the label arrangement% 設置變量名
RC.ClassName = {'Stalk-like','Tip-like'};
RC.PropName = num2cell('A':'J');
% RC.PropName = {'A','B','C','D','E','F','G','H','I','J'}
RC.CList = [151,125,154; 179,97,97]./255;RC = RC.draw();
2.修改背景和刻度線及標簽
% 設置一下背景線條粗細等屬性
RC.setPropLabel('FontSize',21,'FontName','Times New Roman');
RC.setRTick('LineWidth',2);
RC.setRLabel('Color','none');
RC.setBkg('EdgeColor','none');
RC.setThetaTick('LineWidth',2);
RC.setType('Both')
2.修改圖形并添加圖例
RC.setPatchN(1, 'LineWidth',5, 'MarkerSize',8);
RC.setPatchN(2, 'LineWidth',5, 'MarkerSize',8);RC = RC.legend();
RC.setLegend('FontSize',21, 'FontName','Times New Roman');
完
本文完整代碼還將被放在gitee倉庫:
- https://gitee.com/slandarer/PLTreprint


 先釋放鎖再通知)


)


