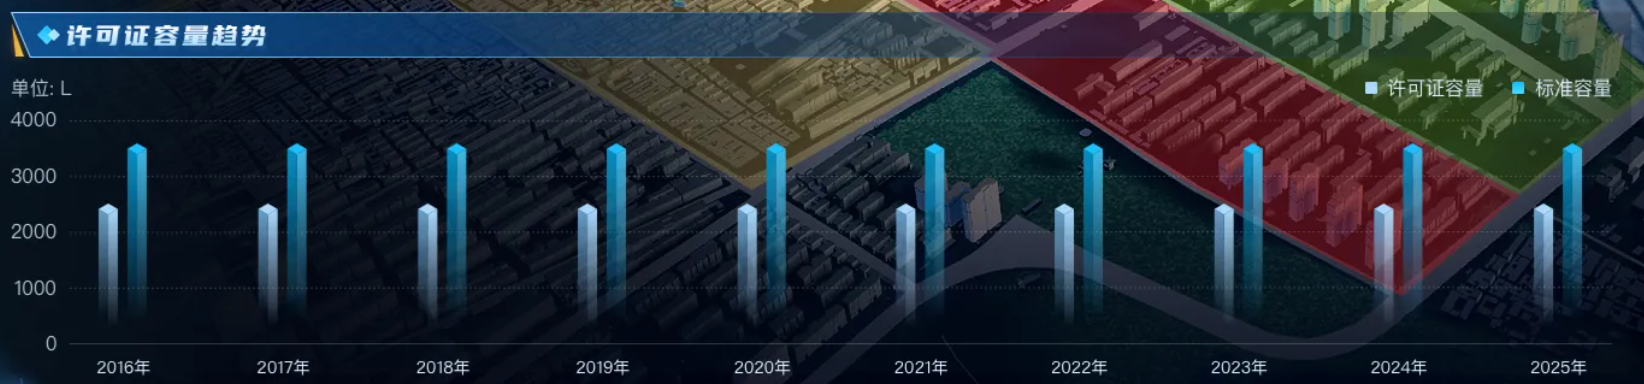
1、UI設計原型效果
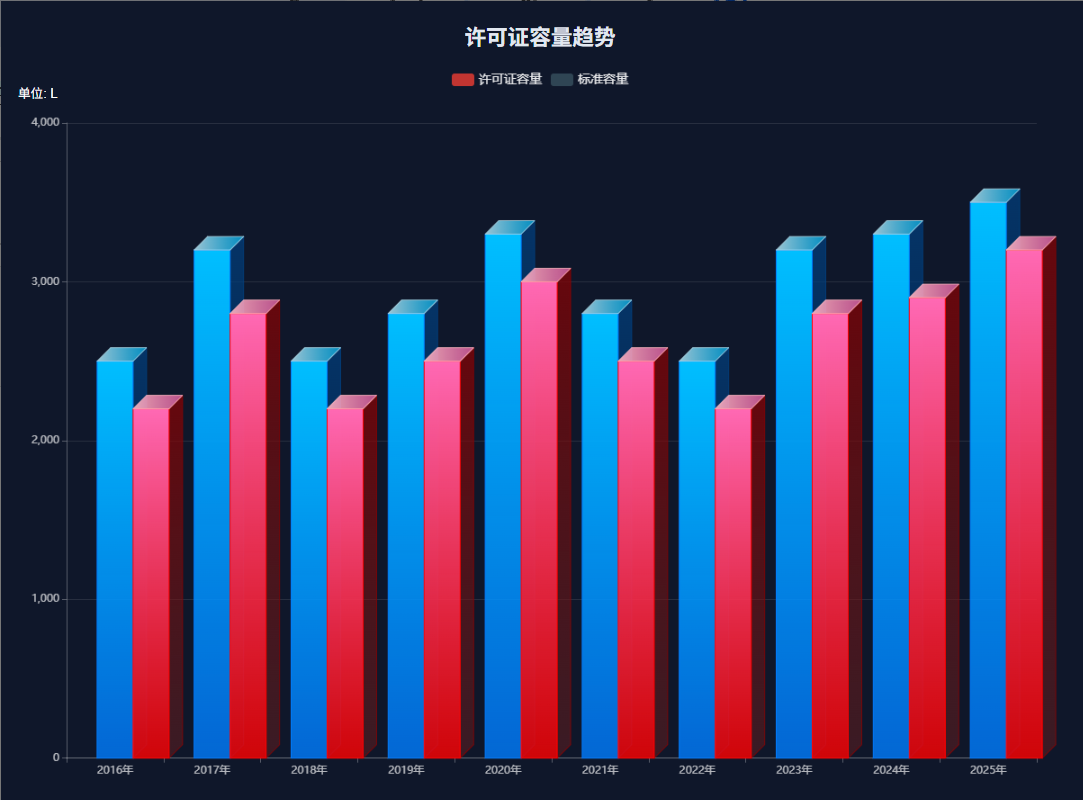
2、通過Tare對話生成的效果圖(5分鐘左右)
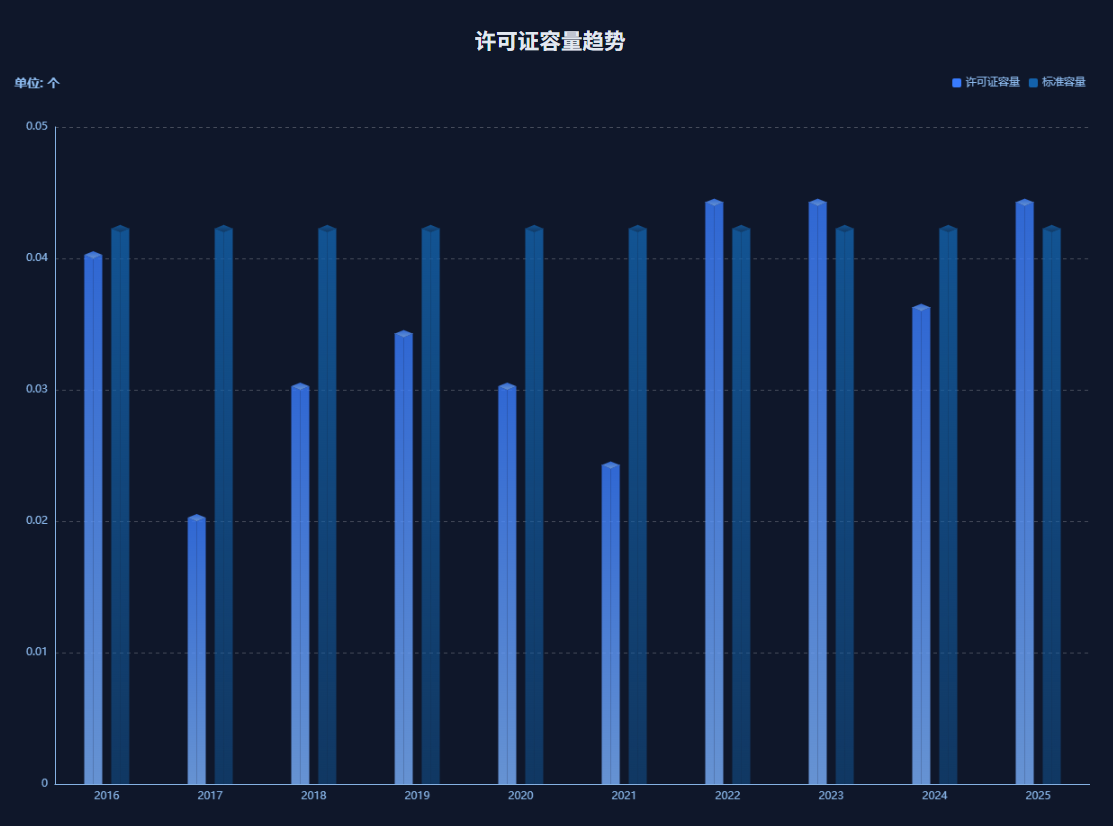
3、查資料做的效果圖(30分鐘左右))
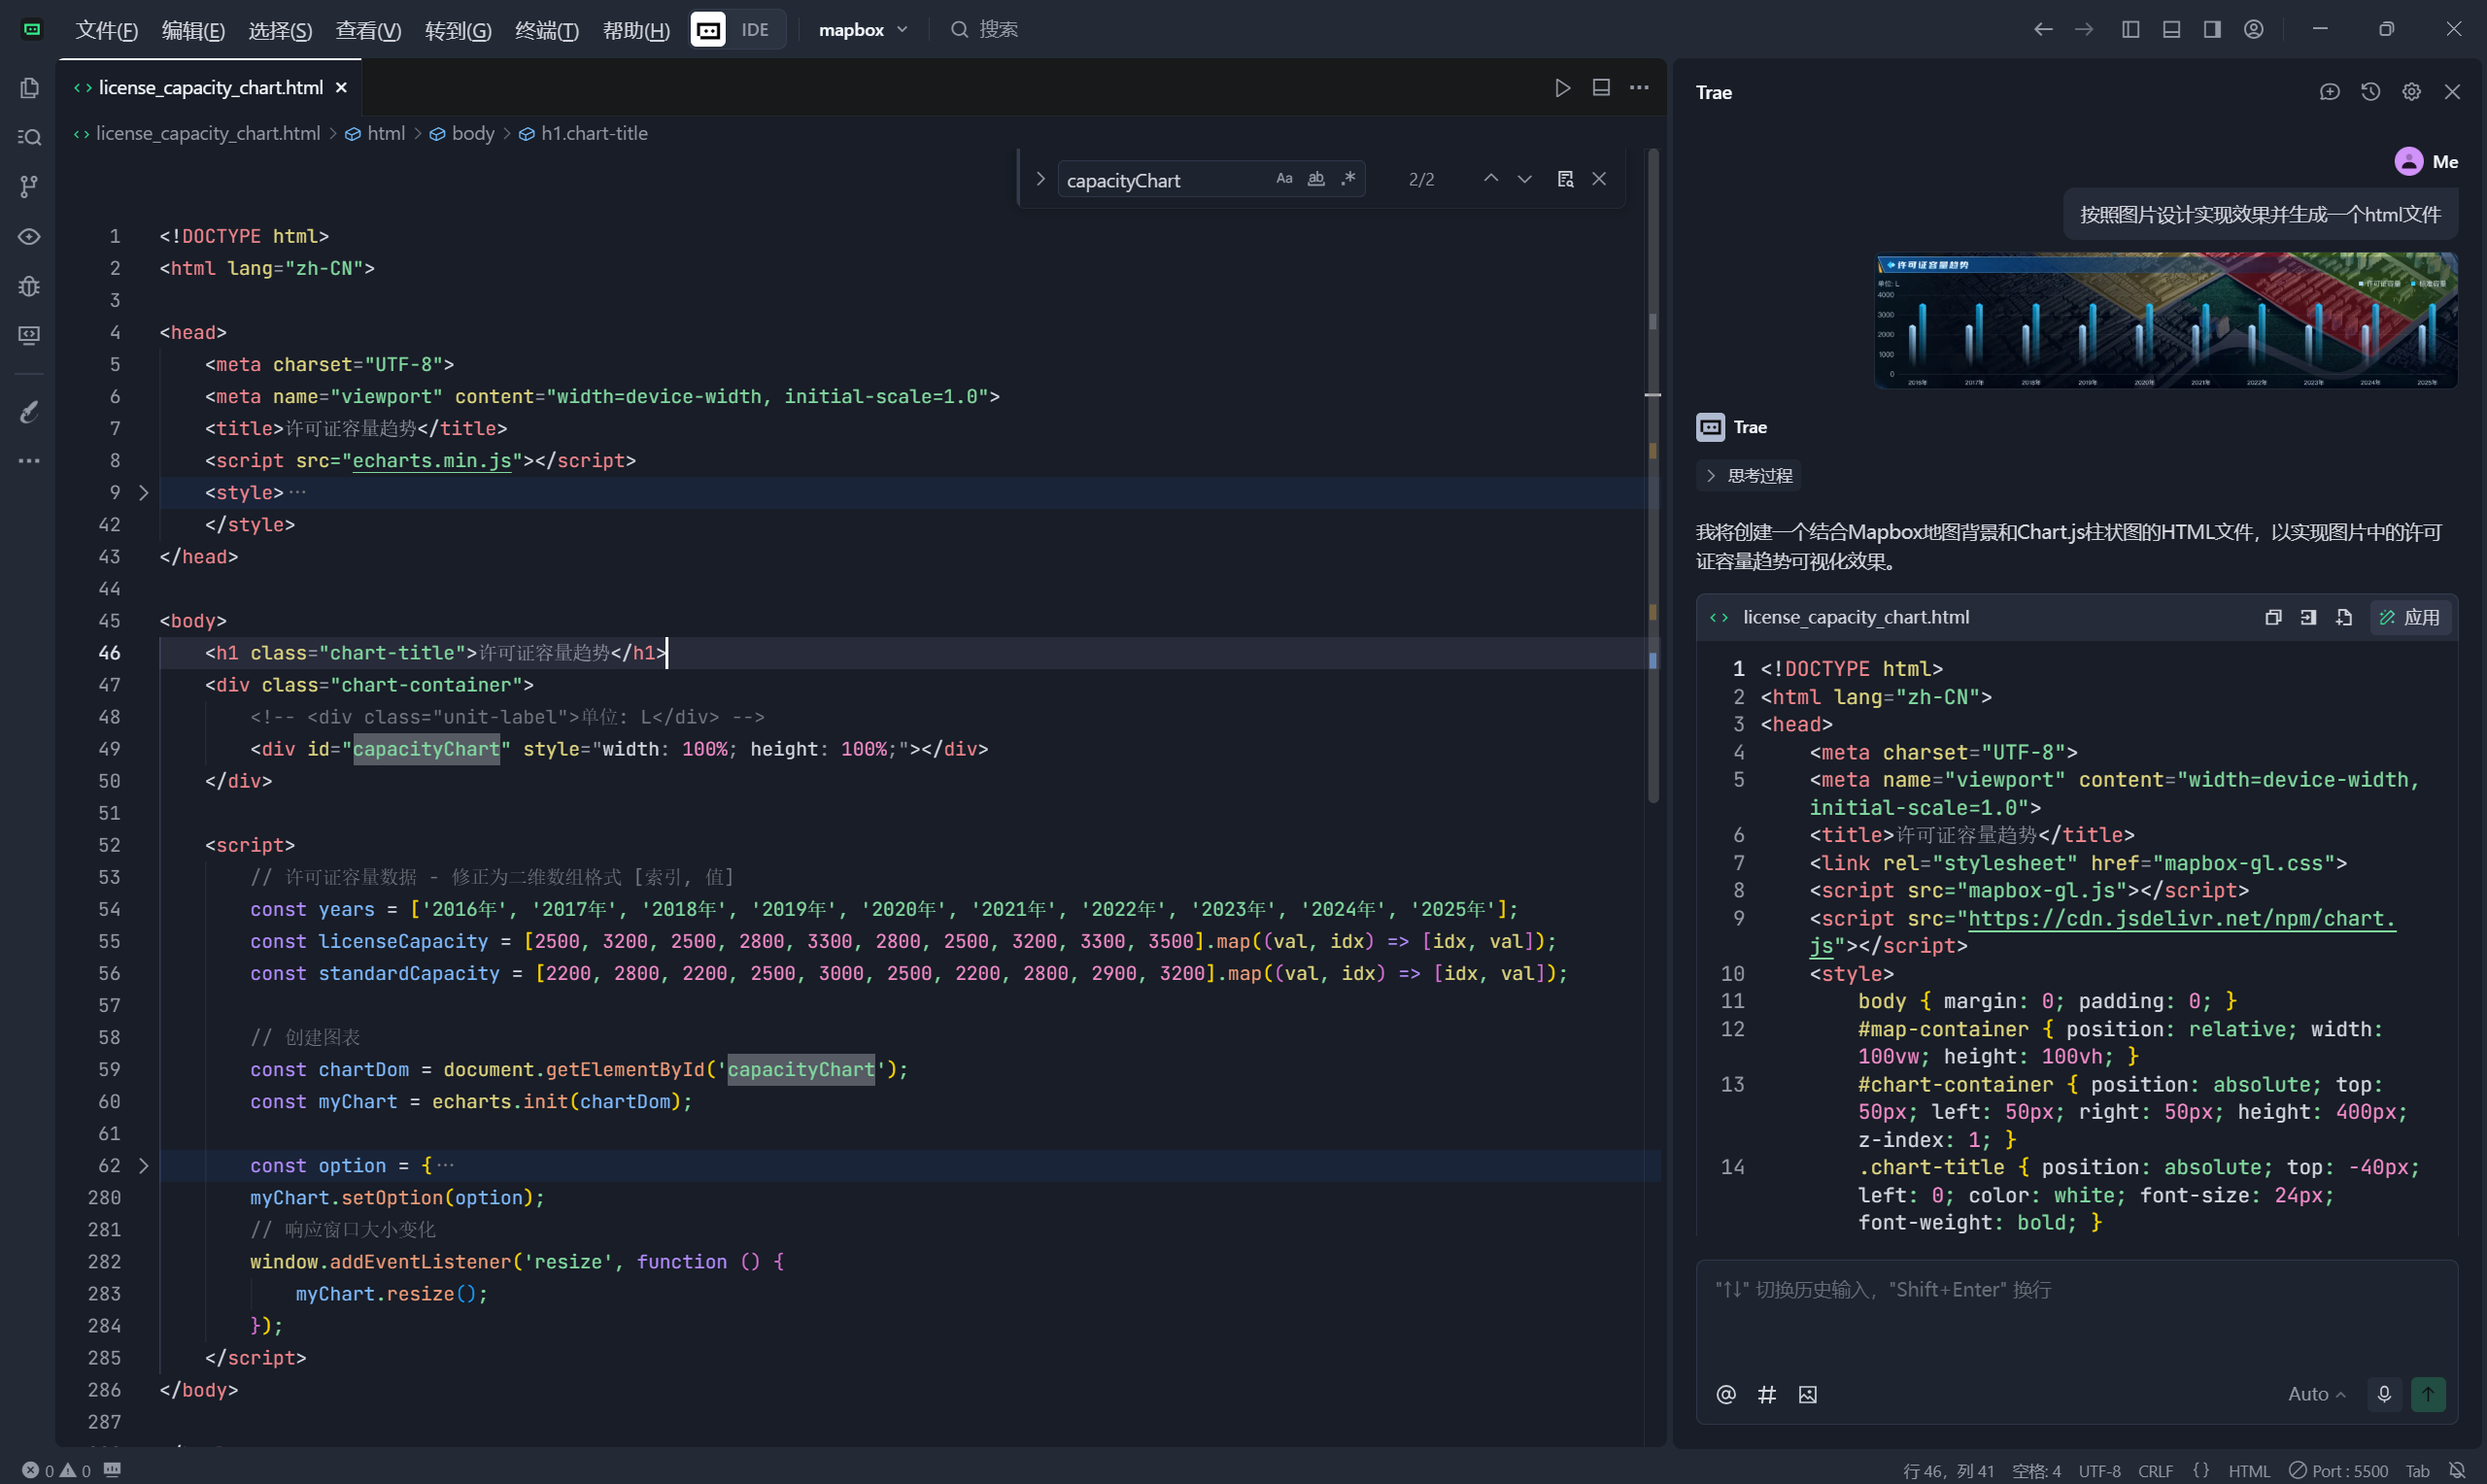
通過以上對比,顯然差別不多能滿足要求,只需要在繼續優化就能搞定;
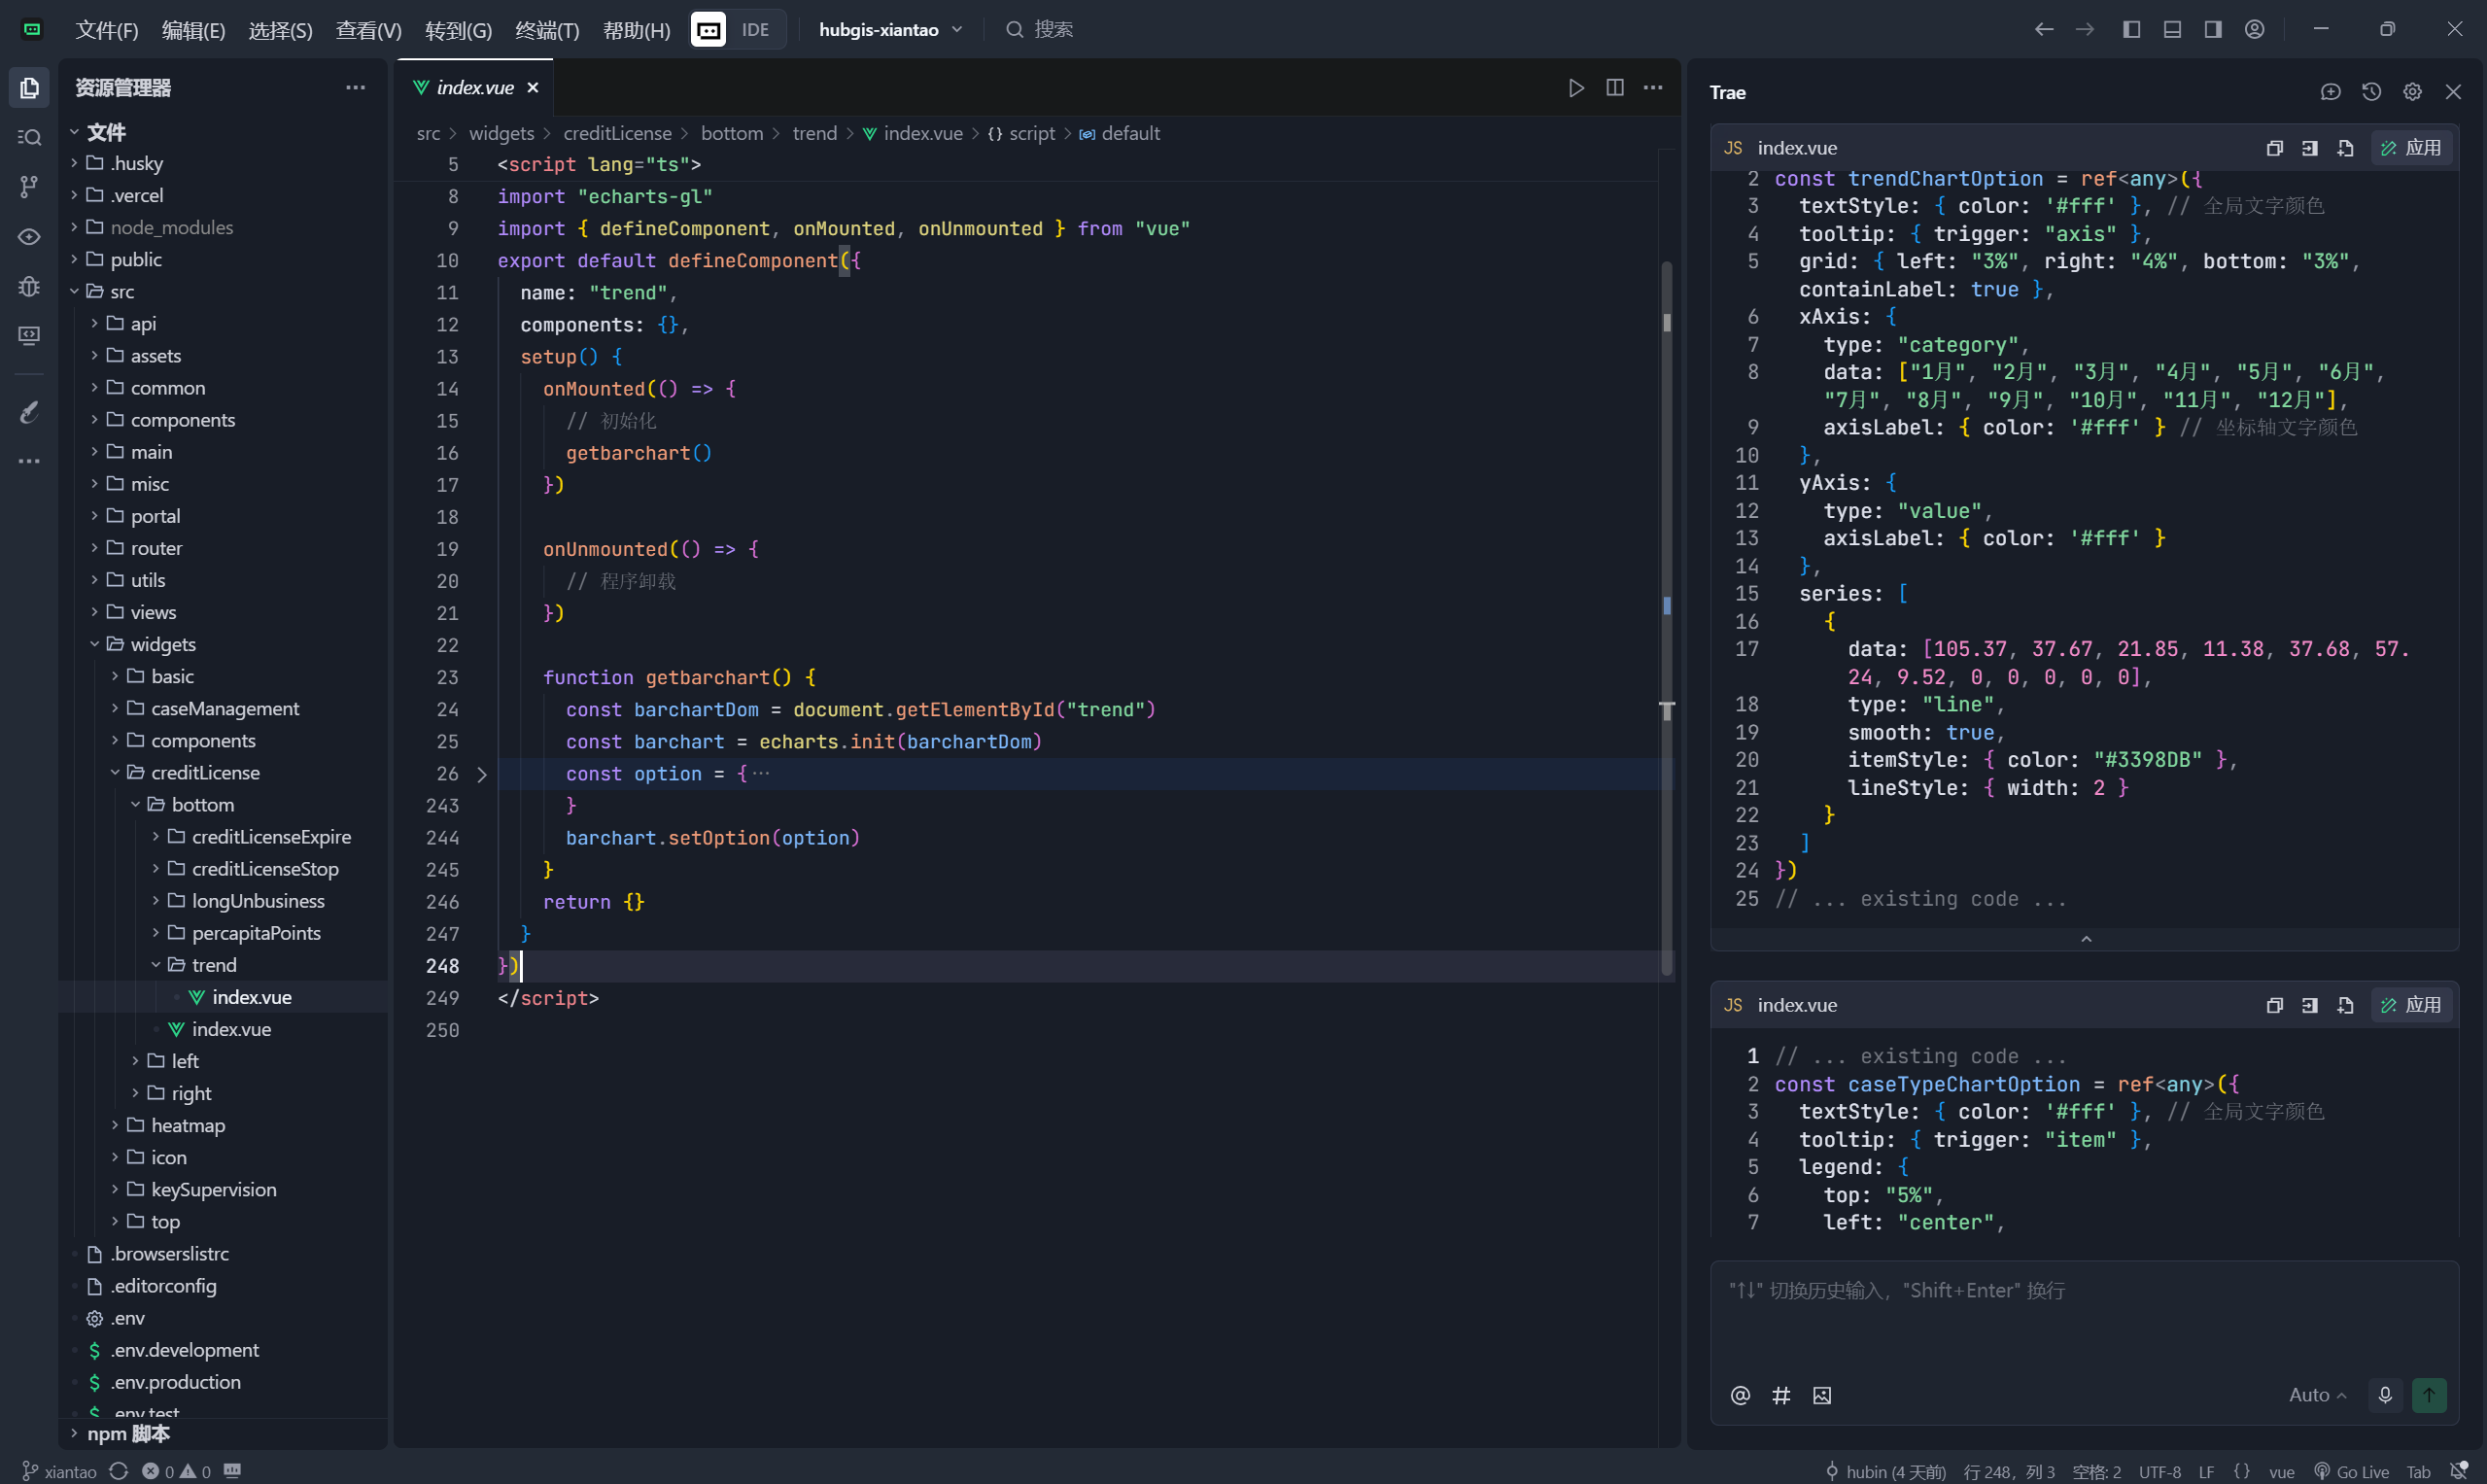
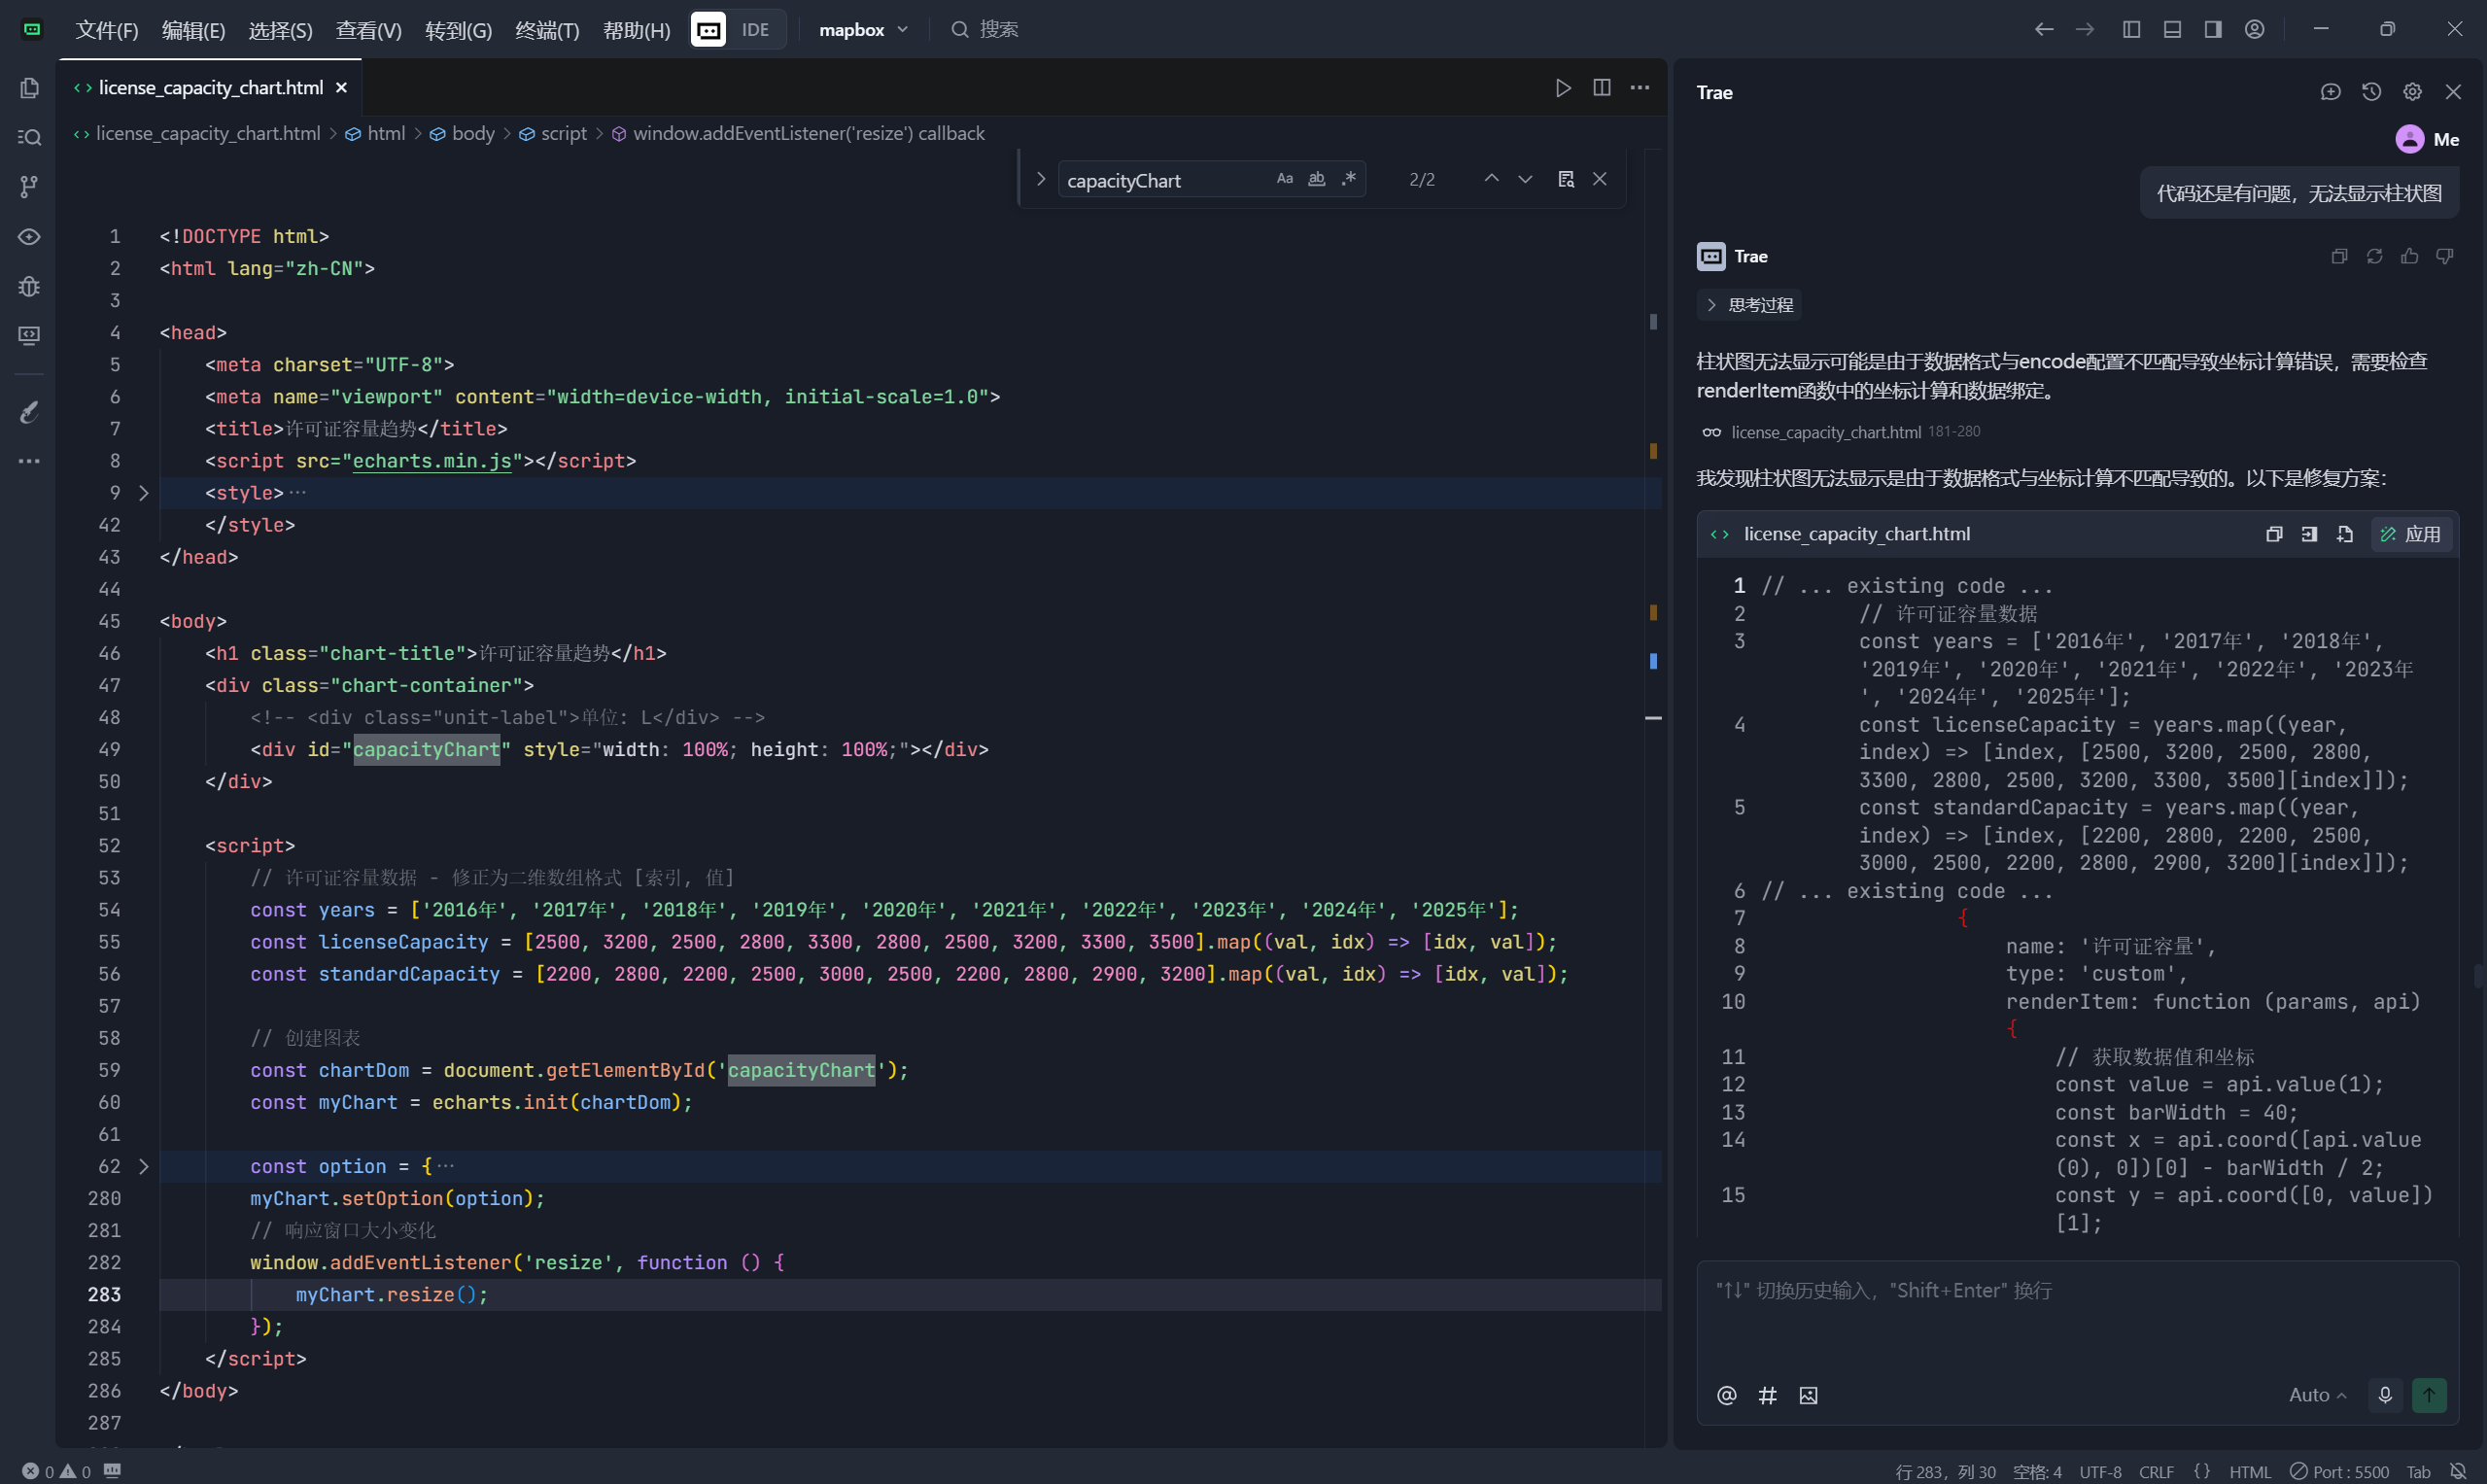
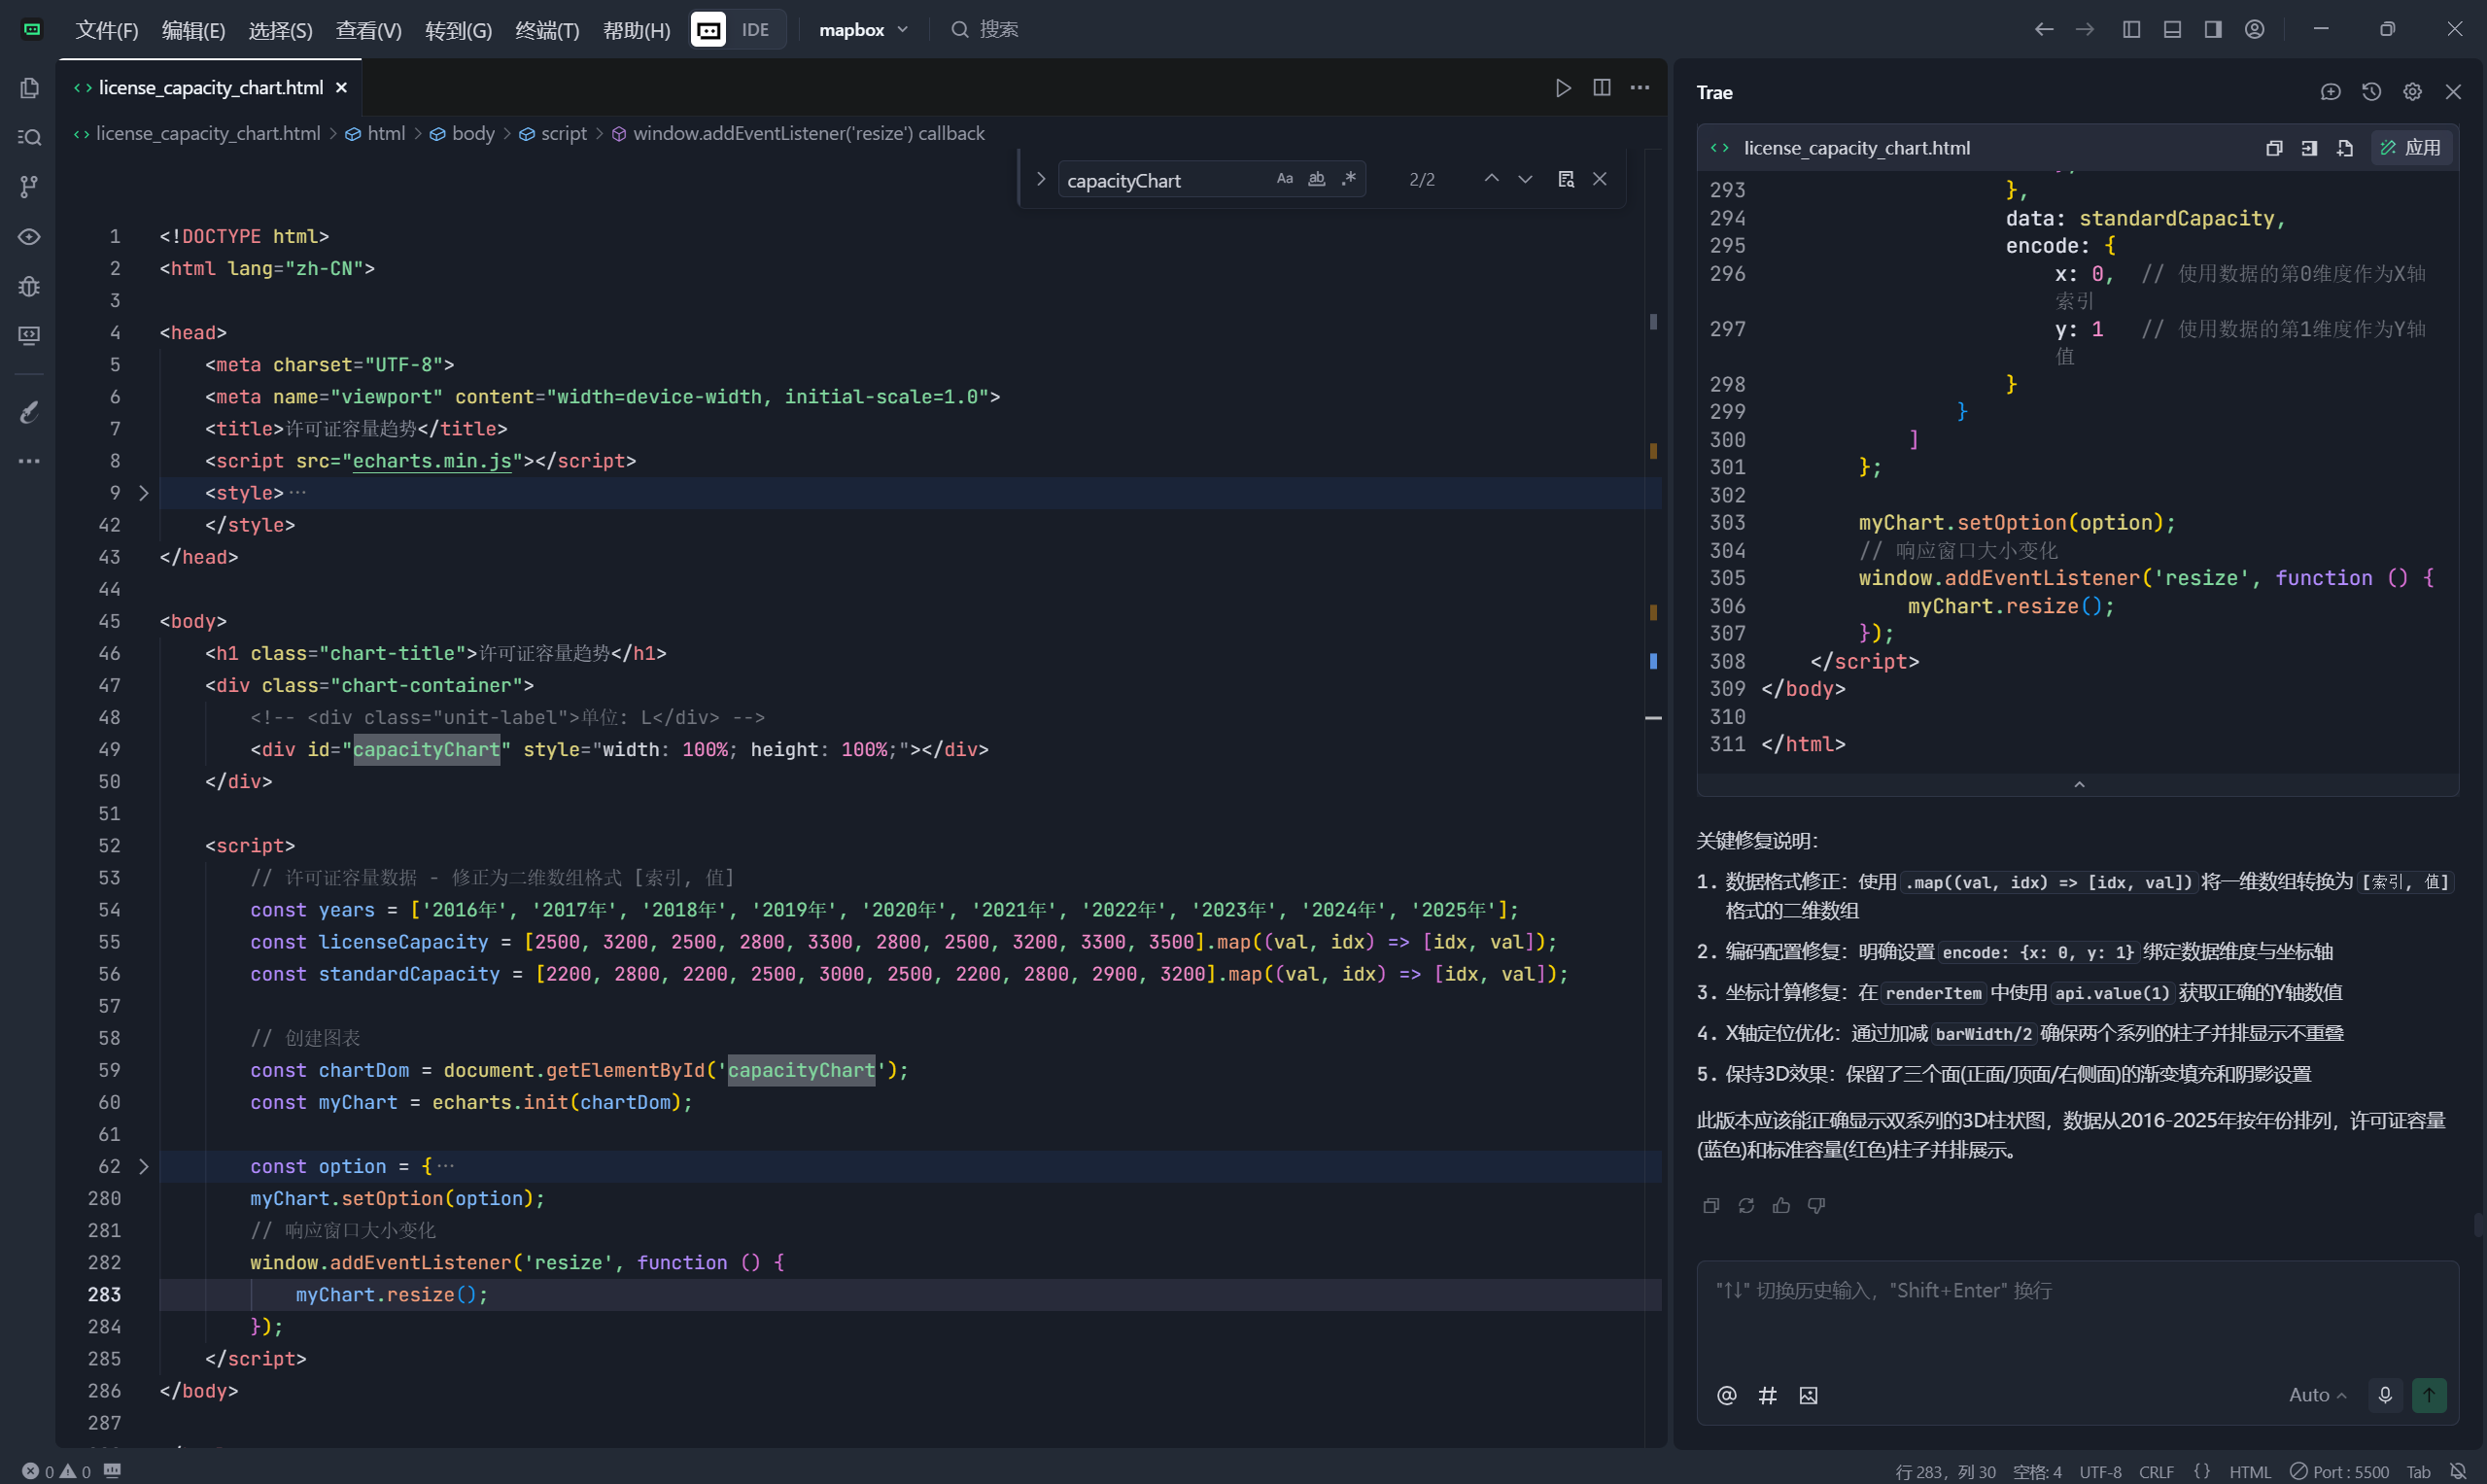
4、Trae生成的源碼
<!DOCTYPE html>
<html lang="zh-CN"><head><meta charset="UTF-8"><meta name="viewport" content="width=device-width, initial-scale=1.0"><title>許可證容量趨勢</title><script src="echarts.min.js"></script><style>body {margin: 0;padding: 20px;background-color: #0f172a;color: white;font-family: Arial, sans-serif;}.chart-container {position: relative;width: 100%;height: 80vh;max-width: 1200px;margin: 0 auto;}.chart-title {text-align: center;font-size: 24px;margin-bottom: 20px;color: #e2e8f0;}.unit-label {position: absolute;top: 10px;left: 10px;background: rgba(15, 23, 42, 0.7);padding: 5px 10px;border-radius: 4px;font-size: 14px;}</style>
</head><body><h1 class="chart-title">許可證容量趨勢</h1><div class="chart-container"><!-- <div class="unit-label">單位: L</div> --><div id="capacityChart" style="width: 100%; height: 100%;"></div></div><script>// 許可證容量數據 - 修正為二維數組格式 [索引, 值]const years = ['2016年', '2017年', '2018年', '2019年', '2020年', '2021年', '2022年', '2023年', '2024年', '2025年'];const licenseCapacity = [2500, 3200, 2500, 2800, 3300, 2800, 2500, 3200, 3300, 3500].map((val, idx) => [idx, val]);const standardCapacity = [2200, 2800, 2200, 2500, 3000, 2500, 2200, 2800, 2900, 3200].map((val, idx) => [idx, val]);// 創建圖表const chartDom = document.getElementById('capacityChart');const myChart = echarts.init(chartDom);const option = {tooltip: {trigger: 'axis',axisPointer: {type: 'shadow'},backgroundColor: 'rgba(15, 23, 42, 0.9)',borderColor: 'rgba(0, 123, 255, 0.5)',borderWidth: 1,textStyle: {color: 'rgba(255, 255, 255, 0.9)'}},legend: {data: ['許可證容量', '標準容量'],textStyle: {color: 'rgba(255, 255, 255, 0.9)',fontSize: 14},top: 0},grid: {left: '3%',right: '4%',bottom: '3%',containLabel: true,backgroundColor: 'transparent',borderColor: 'rgba(255, 255, 255, 0.1)'},xAxis: [{type: 'category',data: years,axisLine: {lineStyle: {color: 'rgba(255, 255, 255, 0.3)'}},axisLabel: {color: 'rgba(255, 255, 255, 0.7)'},splitLine: {lineStyle: {color: 'rgba(255, 255, 255, 0.1)'}}}],yAxis: [{type: 'value',min: 0,max: 4000,interval: 1000,axisLine: {lineStyle: {color: 'rgba(255, 255, 255, 0.3)'}},axisLabel: {color: 'rgba(255, 255, 255, 0.7)',formatter: '{value}'},splitLine: {lineStyle: {color: 'rgba(255, 255, 255, 0.1)'}}}],series: [{name: '許可證容量',type: 'custom',renderItem: function (params, api) {// 獲取數據值和坐標 - 使用正確的維度索引const value = api.value(1); // Y軸值const barWidth = 40;const x = api.coord([api.value(0), 0])[0] - barWidth / 2; // X軸位置(減去寬度一半)const y = api.coord([0, value])[1];const yAxisHeight = api.coord([0, 0])[1];const cubeDepth = 15; // 立方體深度// 計算三個面的坐標// 正面const frontPoints = [[x, y],[x + barWidth, y],[x + barWidth, yAxisHeight],[x, yAxisHeight]];// 頂面const topPoints = [[x, y],[x + barWidth, y],[x + barWidth + cubeDepth, y - cubeDepth],[x + cubeDepth, y - cubeDepth]];// 右側面const rightPoints = [[x + barWidth, y],[x + barWidth + cubeDepth, y - cubeDepth],[x + barWidth + cubeDepth, yAxisHeight - cubeDepth],[x + barWidth, yAxisHeight]];return {type: 'group',children: [// 右側面{type: 'polygon',shape: { points: rightPoints },style: {fill: new echarts.graphic.LinearGradient(0, 0, 1, 1, [{ offset: 0, color: 'rgba(0, 64, 128, 0.7)' },{ offset: 1, color: 'rgba(0, 40, 80, 0.5)' }]),stroke: 'rgba(0, 64, 128, 0.8)',lineWidth: 1}},// 正面{type: 'polygon',shape: { points: frontPoints },style: {fill: new echarts.graphic.LinearGradient(0, 0, 0, 1, [{ offset: 0, color: 'rgba(0, 191, 255, 1)' },{ offset: 1, color: 'rgba(0, 123, 255, 0.8)' }]),stroke: 'rgba(0, 123, 255, 1)',lineWidth: 1}},// 頂面{type: 'polygon',shape: { points: topPoints },style: {fill: new echarts.graphic.LinearGradient(0, 0, 1, 0, [{ offset: 0, color: 'rgba(173, 216, 230, 0.9)' },{ offset: 1, color: 'rgba(0, 191, 255, 0.7)' }]),stroke: 'rgba(173, 216, 230, 0.8)',lineWidth: 1}}]};},data: licenseCapacity,encode: {x: 0,  // 使用數據的第0維度作為X軸索引y: 1   // 使用數據的第1維度作為Y軸值}},{name: '標準容量',type: 'custom',renderItem: function (params, api) {// 獲取數據值和坐標 - 使用正確的維度索引const value = api.value(1); // Y軸值const barWidth = 40;const x = api.coord([api.value(0), 0])[0] + barWidth / 2; // X軸位置(加上寬度一半)const y = api.coord([0, value])[1];const yAxisHeight = api.coord([0, 0])[1];const cubeDepth = 15; // 立方體深度// 計算三個面的坐標// 正面const frontPoints = [[x, y],[x + barWidth, y],[x + barWidth, yAxisHeight],[x, yAxisHeight]];// 頂面const topPoints = [[x, y],[x + barWidth, y],[x + barWidth + cubeDepth, y - cubeDepth],[x + cubeDepth, y - cubeDepth]];// 右側面const rightPoints = [[x + barWidth, y],[x + barWidth + cubeDepth, y - cubeDepth],[x + barWidth + cubeDepth, yAxisHeight - cubeDepth],[x + barWidth, yAxisHeight]];return {type: 'group',children: [// 右側面{type: 'polygon',shape: { points: rightPoints },style: {fill: new echarts.graphic.LinearGradient(0, 0, 1, 1, [{ offset: 0, color: 'rgba(139, 0, 0, 0.7)' },{ offset: 1, color: 'rgba(101, 31, 31, 0.5)' }]),stroke: 'rgba(139, 0, 0, 0.8)',lineWidth: 1}},// 正面{type: 'polygon',shape: { points: frontPoints },style: {fill: new echarts.graphic.LinearGradient(0, 0, 0, 1, [{ offset: 0, color: 'rgba(255, 105, 180, 1)' },{ offset: 1, color: 'rgba(255, 0, 0, 0.8)' }]),stroke: 'rgba(255, 0, 0, 1)',lineWidth: 1}},// 頂面{type: 'polygon',shape: { points: topPoints },style: {fill: new echarts.graphic.LinearGradient(0, 0, 1, 0, [{ offset: 0, color: 'rgba(255, 182, 193, 0.9)' },{ offset: 1, color: 'rgba(255, 105, 180, 0.7)' }]),stroke: 'rgba(255, 182, 193, 0.8)',lineWidth: 1}}]};},data: standardCapacity,encode: {x: 0,  // 使用數據的第0維度作為X軸索引y: 1   // 使用數據的第1維度作為Y軸值}}]};myChart.setOption(option);// 響應窗口大小變化window.addEventListener('resize', function () {myChart.resize();});</script>
</body></html>
5、最終的效果圖源碼
<!DOCTYPE html>
<html lang="zh-CN"><head><meta charset="UTF-8"><meta name="viewport" content="width=device-width, initial-scale=1.0"><title>許可證容量趨勢</title><script src="echarts.min.js"></script><style>body {margin: 0;padding: 20px;background-color: #0f172a;color: white;font-family: Arial, sans-serif;}.chart-container {position: relative;width: 100%;height: 80vh;max-width: 1200px;margin: 0 auto;}.chart-title {text-align: center;font-size: 24px;margin-bottom: 20px;color: #e2e8f0;}.unit-label {position: absolute;top: 10px;left: 10px;background: rgba(15, 23, 42, 0.7);padding: 5px 10px;border-radius: 4px;font-size: 14px;}</style>
</head><body><h1 class="chart-title">許可證容量趨勢</h1><div class="chart-container"><!-- <div class="unit-label">單位: L</div> --><div id="capacityChart" style="width: 100%; height: 100%;"></div></div><script>// 許可證容量數據 - 修正為二維數組格式 [索引, 值]const years = ['2016年', '2017年', '2018年', '2019年', '2020年', '2021年', '2022年', '2023年', '2024年', '2025年'];const licenseCapacity = [2500, 3200, 2500, 2800, 3300, 2800, 2500, 3200, 3300, 3500].map((val, idx) => [idx, val]);const standardCapacity = [2200, 2800, 2200, 2500, 3000, 2500, 2200, 2800, 2900, 3200].map((val, idx) => [idx, val]);// 創建圖表const chartDom = document.getElementById('capacityChart');const myChart = echarts.init(chartDom);const option = {grid: {bottom: "20px",left: "50px", // 左邊距為容器寬度的 50pxright: "0px" // 右邊距為容器寬度的 0px},// 左上角顯示單位title: {text: "單位: 個",left: "left",top: "top",textStyle: {color: "#8CBAEE",fontSize: 14}},// 右上角顯示圖例legend: {width: "200px",orient: "horizontal", // 設置圖例水平排列data: ["許可證容量", "標準容量"],right: "right",top: "top",textStyle: {color: "#8CBAEE"},itemType: "rect", // 指定圖例圖標為矩形itemWidth: 10, // 設置矩形寬度itemHeight: 10 // 設置矩形高度},xAxis: {data: ["2016", "2017", "2018", "2019", "2020", "2021", "2022", "2023", "2024", "2025"],axisLabel: {color: "#8CBAEE"// rotate: -60},axisLine: {lineStyle: {color: "#8CBAEE"}},axisTick: {show: false}},yAxis: {axisLabel: {color: "#8CBAEE"},axisLine: {lineStyle: {color: "#8CBAEE"}},axisTick: {show: false},splitLine: {lineStyle: {color: "#FFFFFF3C", // 設置顏色為白色type: "dashed" // 設置為虛線}}},// 立方體柱狀series: [{type: "custom",name: "許可證容量",// 手動指定圖例顏色color: "#387BFE",data: [0.04, 0.02, 0.03, 0.034, 0.03, 0.024, 0.044, 0.044, 0.036, 0.044],renderItem: (params, api) => {const basicsCoord = api.coord([api.value(0), api.value(1)])const topBasicsYAxis = basicsCoord[1]const basicsXAxis = basicsCoord[0] - 15 // 向左偏移 15pxconst bottomYAxis = api.coord([api.value(0), 0])[1]return {type: "group",children: [// 左側{type: "polygon",shape: {points: [[basicsXAxis - 10, topBasicsYAxis - 4],[basicsXAxis - 10, bottomYAxis],[basicsXAxis, bottomYAxis],[basicsXAxis, topBasicsYAxis]]},style: {fill: new echarts.graphic.LinearGradient(0, 0, 0, 1, [{ offset: 0, color: "#387BFE" },{ offset: 1, color: "#7CB1FD" }]),opacity: 0.8 // 設置半透明}},// 右側{type: "polygon",shape: {points: [[basicsXAxis, topBasicsYAxis],[basicsXAxis, bottomYAxis],[basicsXAxis + 10, bottomYAxis],[basicsXAxis + 10, topBasicsYAxis - 4]]},style: {fill: new echarts.graphic.LinearGradient(0, 0, 0, 1, [{ offset: 0, color: "#387BFE" },{ offset: 1, color: "#7CB1FD" }]),opacity: 0.8 // 設置半透明}},// 頂部{type: "polygon",shape: {points: [[basicsXAxis, topBasicsYAxis],[basicsXAxis - 10, topBasicsYAxis - 4],[basicsXAxis, topBasicsYAxis - 8],[basicsXAxis + 10, topBasicsYAxis - 4]]},style: {fill: new echarts.graphic.LinearGradient(0, 0, 0, 1, [{ offset: 0, color: "#387BFE" },{ offset: 1, color: "#7CB1FD" }]),opacity: 0.8 // 設置半透明}}]}}},{type: "custom",name: "標準容量",// 手動指定圖例顏色color: "#1362AC",data: [0.042, 0.042, 0.042, 0.042, 0.042, 0.042, 0.042, 0.042, 0.042, 0.042],renderItem: (params, api) => {const basicsCoord = api.coord([api.value(0), api.value(1)])const topBasicsYAxis = basicsCoord[1]const basicsXAxis = basicsCoord[0] + 15 // 向右偏移 15pxconst bottomYAxis = api.coord([api.value(0), 0])[1]return {type: "group",children: [// 左側{type: "polygon",shape: {points: [[basicsXAxis - 10, topBasicsYAxis - 4],[basicsXAxis - 10, bottomYAxis],[basicsXAxis, bottomYAxis],[basicsXAxis, topBasicsYAxis]]},style: {fill: new echarts.graphic.LinearGradient(0, 0, 0, 1, [{ offset: 0, color: "#1362AC" },{ offset: 1, color: "#1362AC8A" }]),opacity: 0.8 // 設置半透明}},// 右側{type: "polygon",shape: {points: [[basicsXAxis, topBasicsYAxis],[basicsXAxis, bottomYAxis],[basicsXAxis + 10, bottomYAxis],[basicsXAxis + 10, topBasicsYAxis - 4]]},style: {fill: new echarts.graphic.LinearGradient(0, 0, 0, 1, [{ offset: 0, color: "#1362AC" },{ offset: 1, color: "#1362AC8A" }]),opacity: 0.8 // 設置半透明}},// 頂部{type: "polygon",shape: {points: [[basicsXAxis, topBasicsYAxis],[basicsXAxis - 10, topBasicsYAxis - 4],[basicsXAxis, topBasicsYAxis - 8],[basicsXAxis + 10, topBasicsYAxis - 4]]},style: {fill: new echarts.graphic.LinearGradient(0, 0, 0, 1, [{ offset: 0, color: "#1362AC" },{ offset: 1, color: "#1362AC8A" }]),opacity: 0.8 // 設置半透明}}]}}}]}myChart.setOption(option);// 響應窗口大小變化window.addEventListener('resize', function () {myChart.resize();});</script>
</body></html>
6、對話全過程
- 有意思的是第一次識別的時候因為背景有地圖,是給提供了mapbox繪制的解決方案
- 去掉地圖
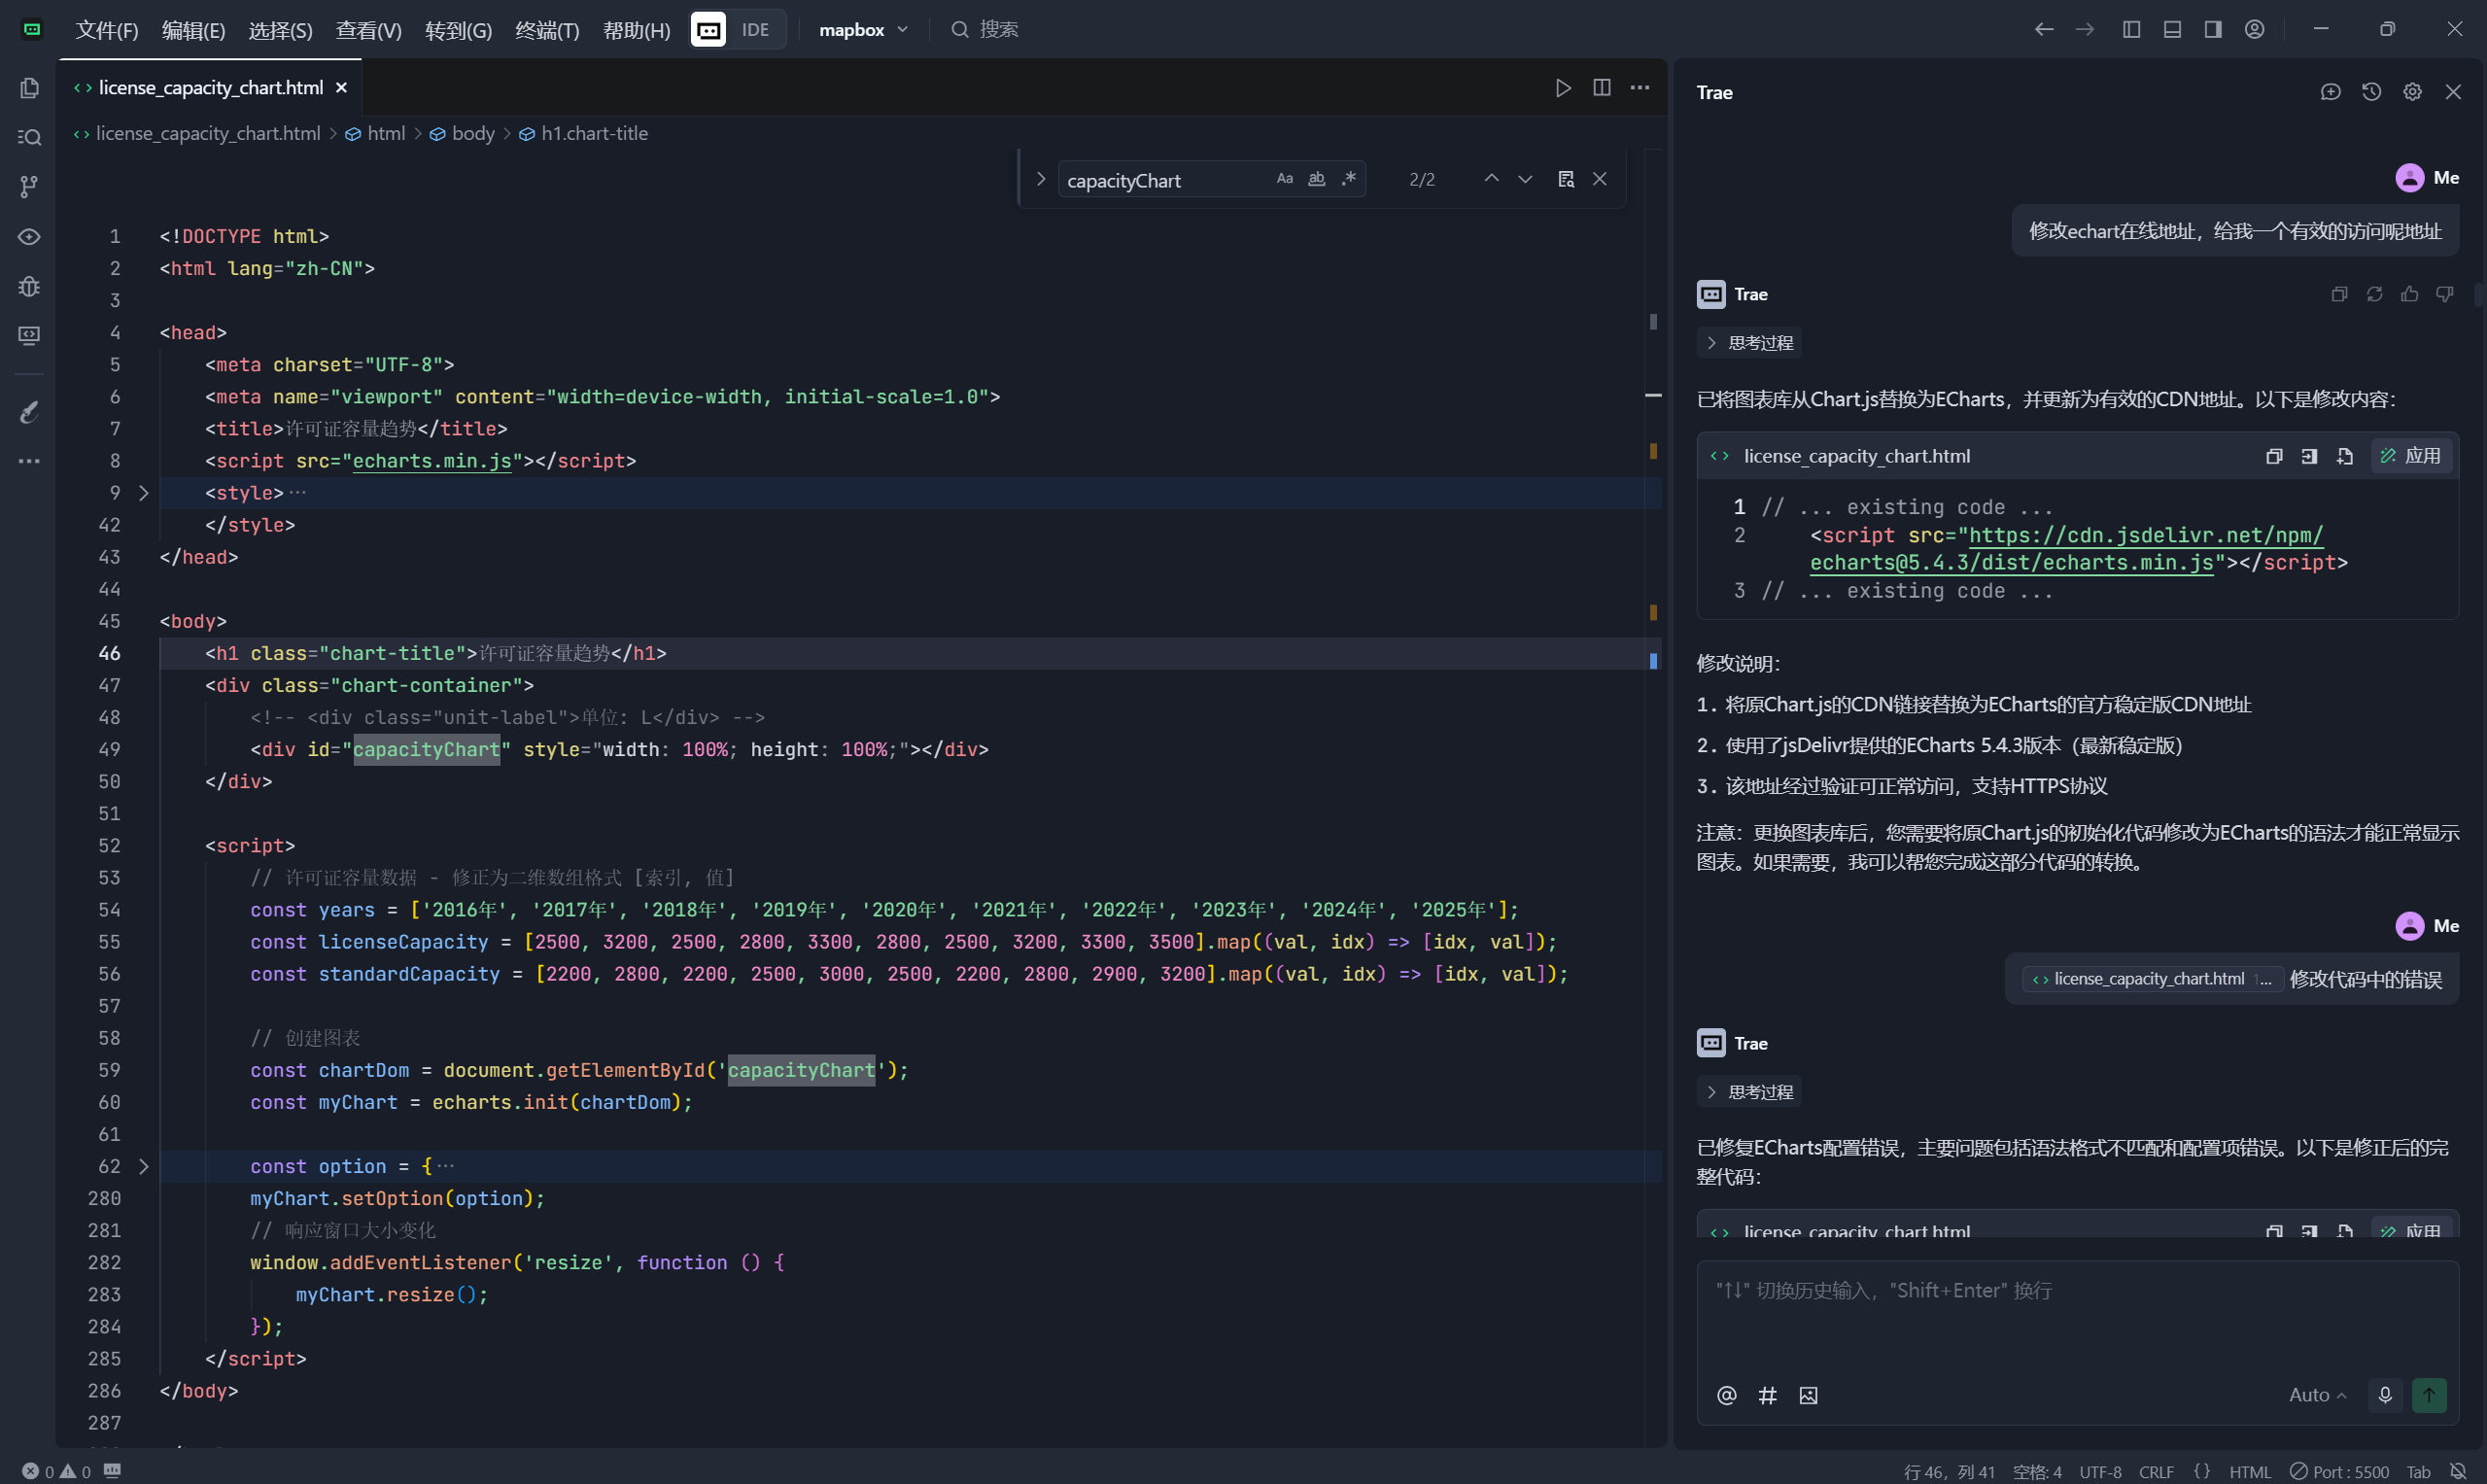
- 修改無效的echart在線地址,本文使用的echart地址

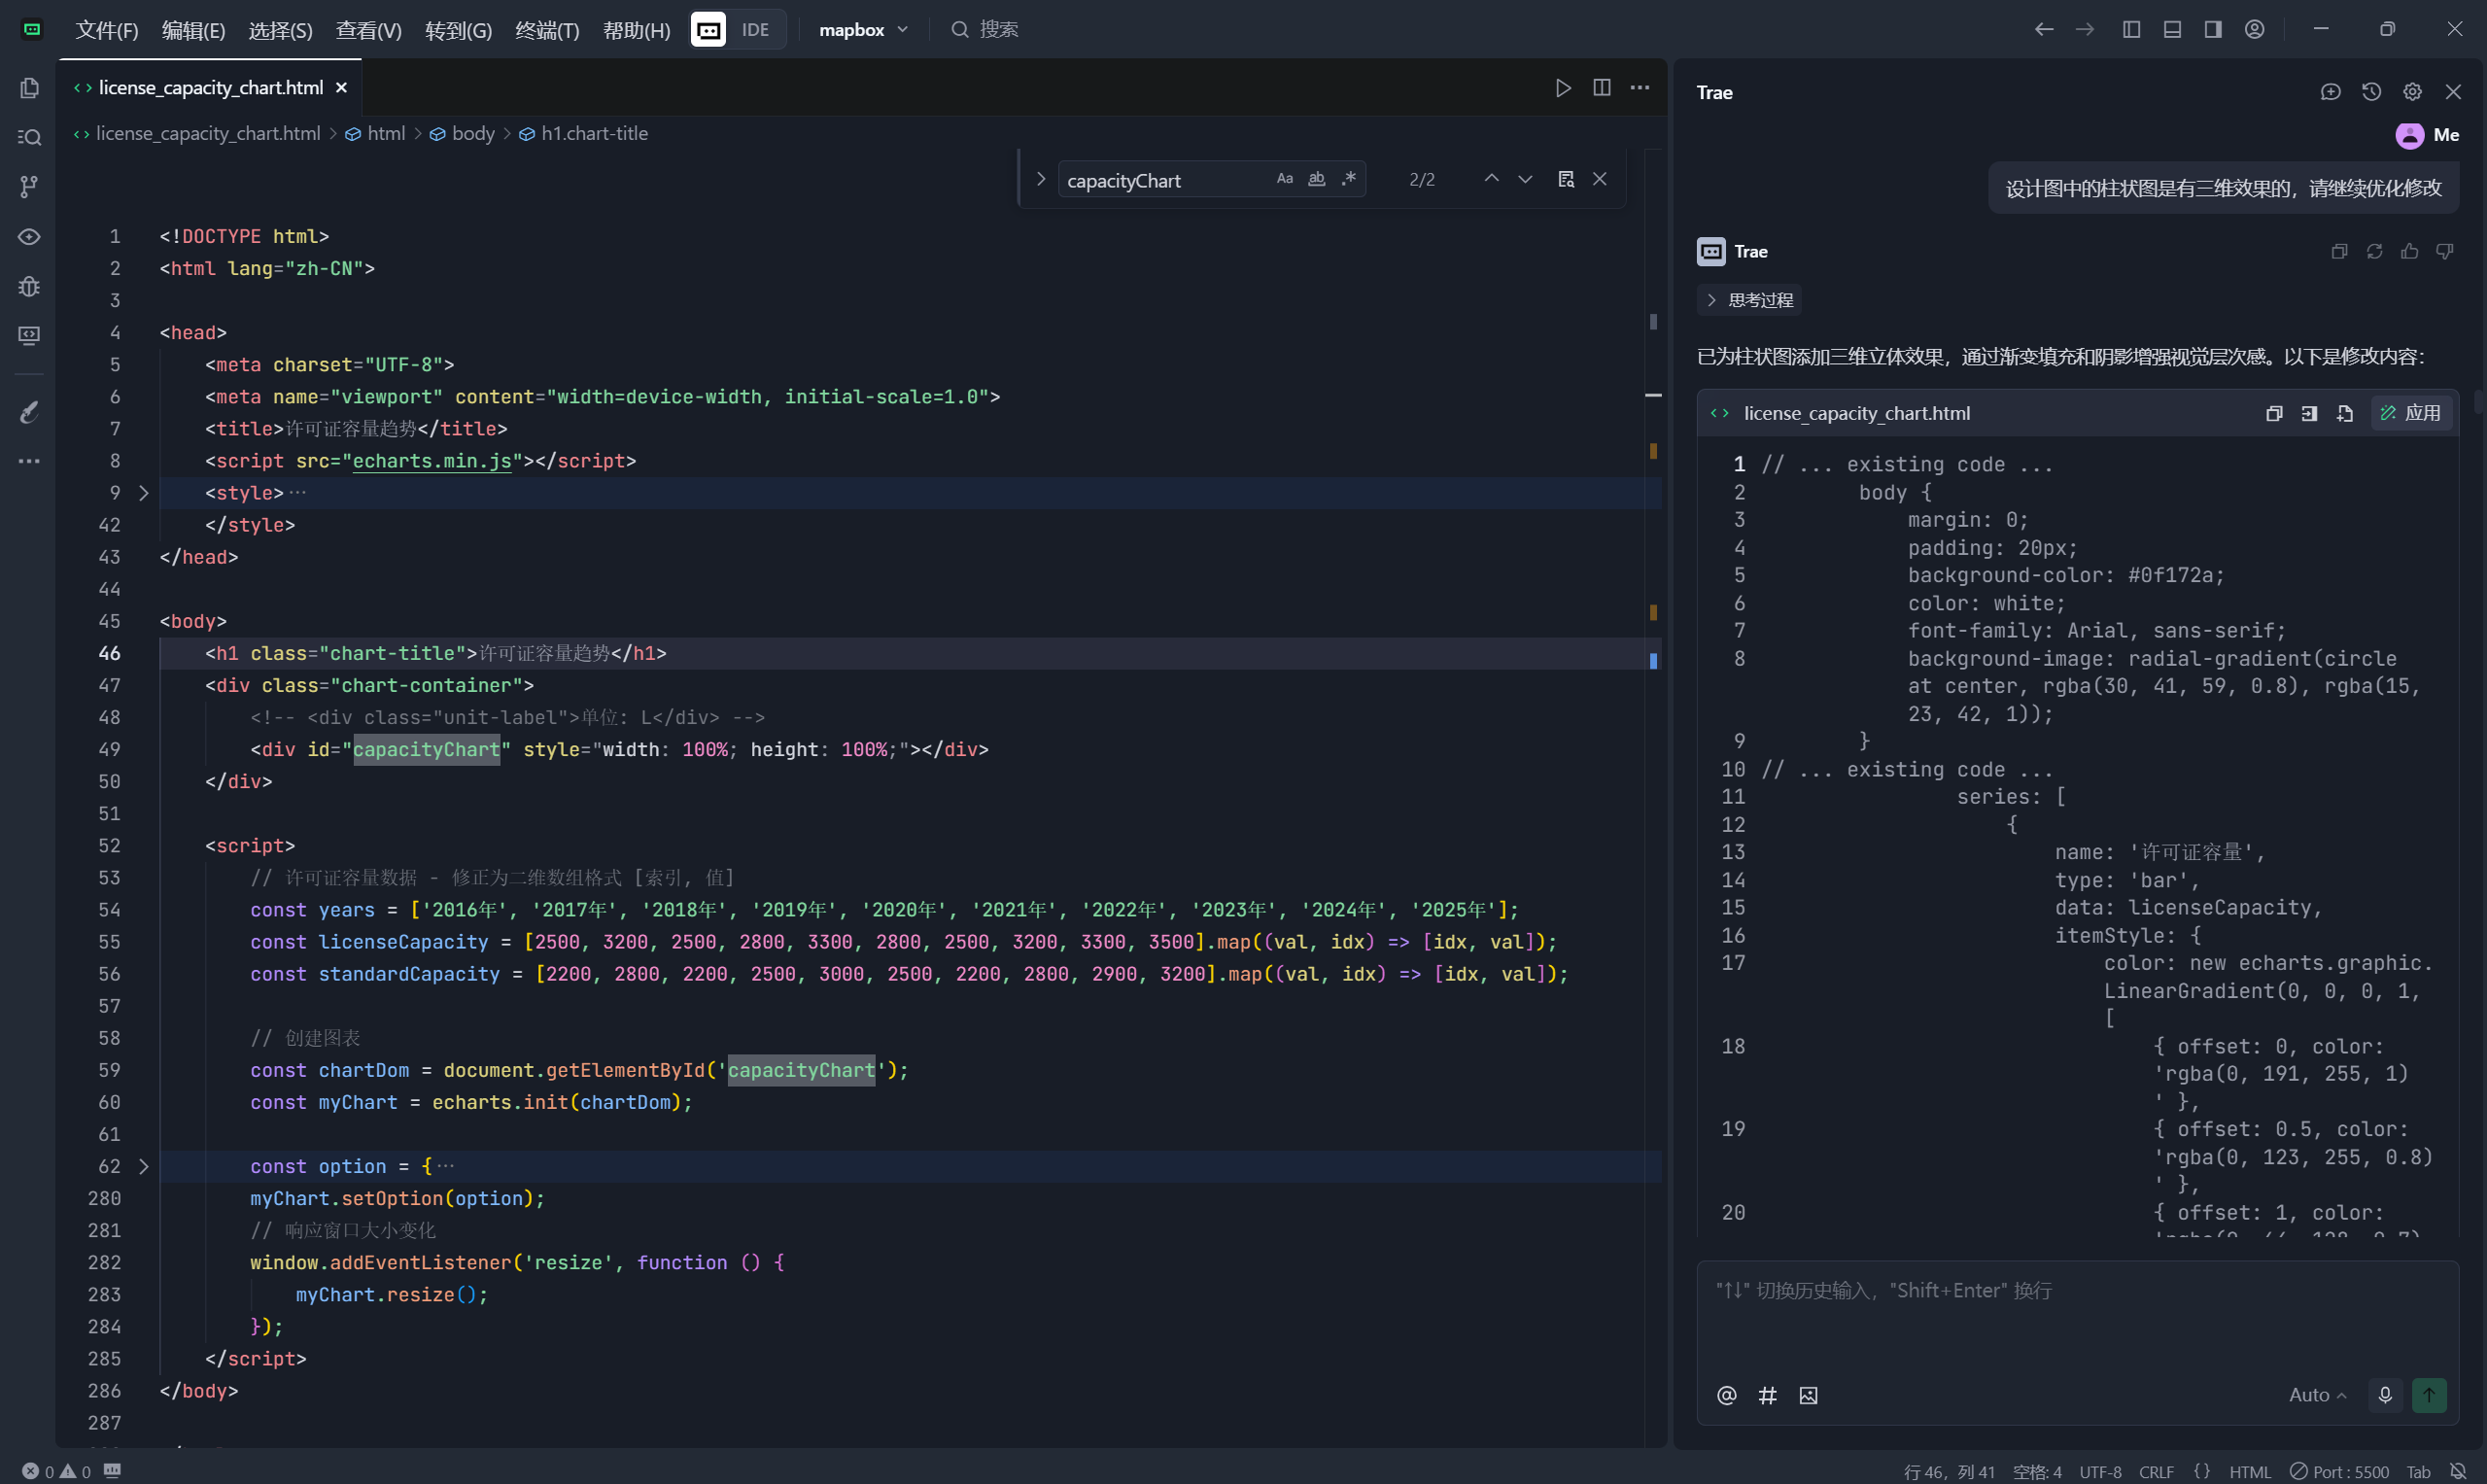
- 第一次生成的是普通的柱狀圖,不是我想要的立體效果,這個過程我反復了3個來回沒有給到關鍵字,所以效果不明顯。
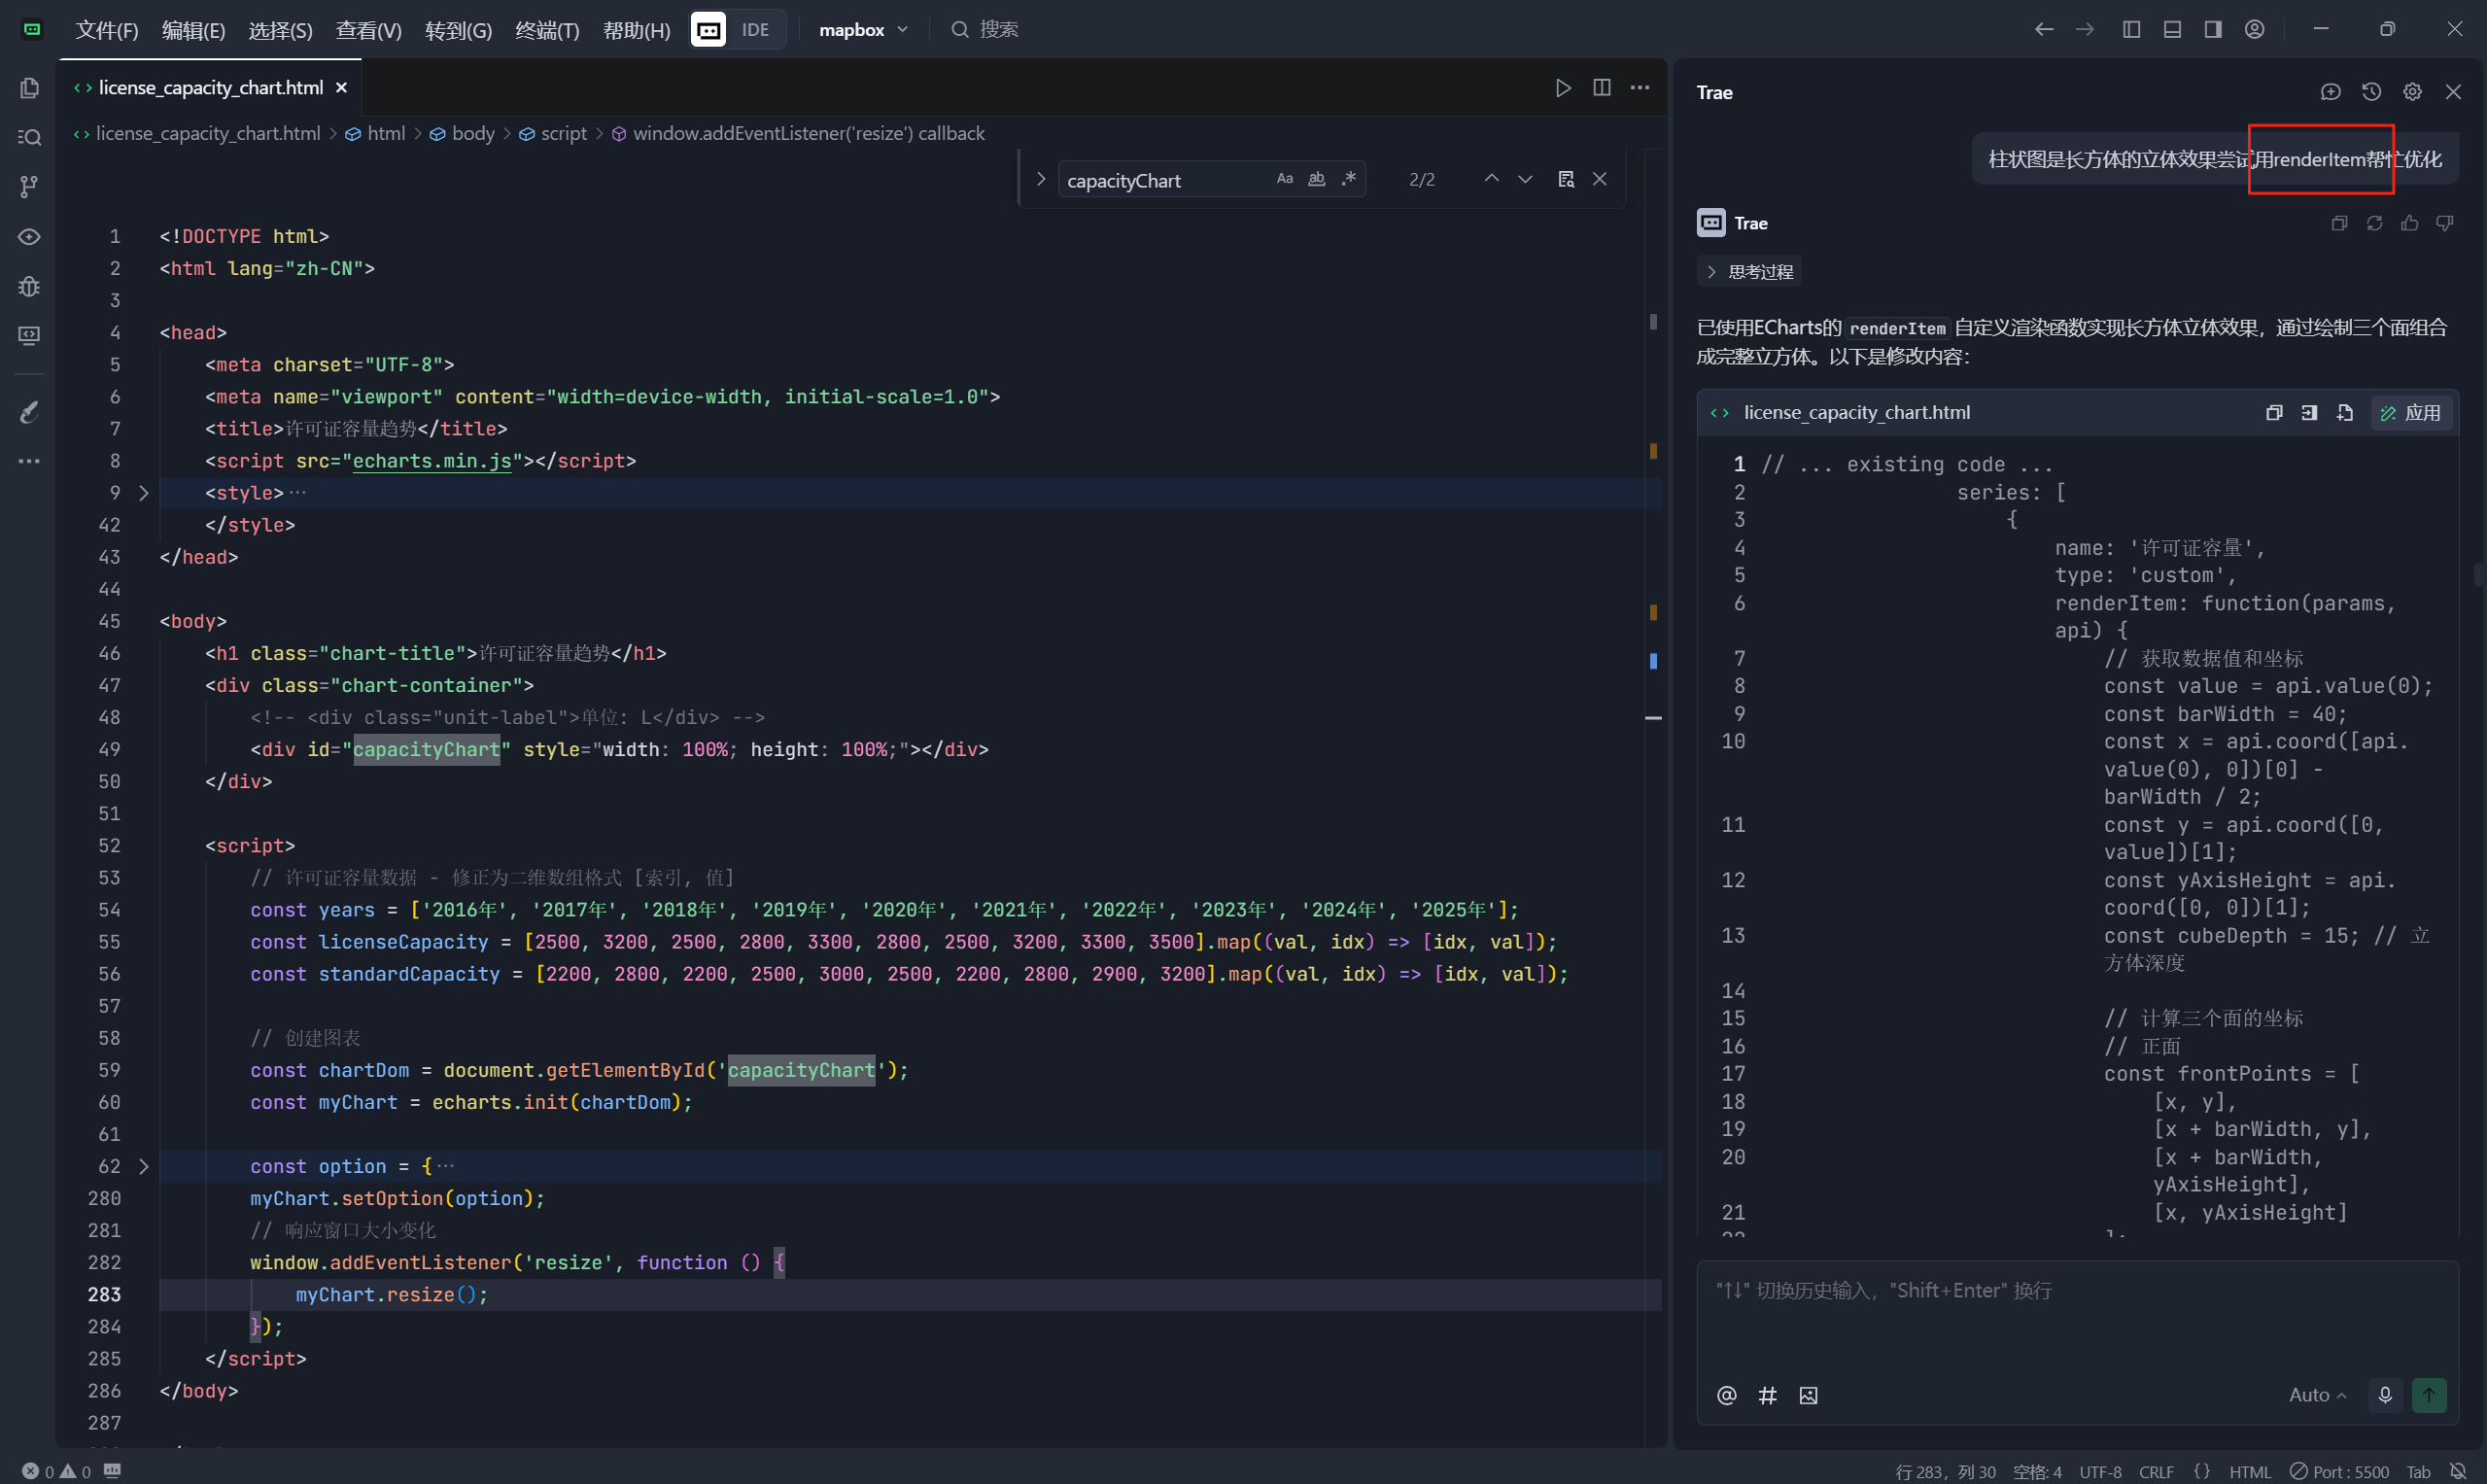
- 再次提交我讓他試試renderItem的方式繪制
最終就是目錄2的效果,當然想實現目錄3的效果就是咫尺之間了。使用過程中發現還是需要給一定的關鍵字才能快速的實現想要的效果,所以目前階段只能打打輔助還是相當不錯的。


)


)

)

——使用LED Strip組件點亮LED燈帶)

)

)
