01前言
在 高并發 + 微服務 中,
傳統 手動埋點(System.currentTimeMillis())就像用體溫計量火箭速度——代碼侵入、重復勞動、維護爆炸。
下文是無侵入、高精度、全鏈路 監控 API 耗時,全程不碰業務代碼的方案!
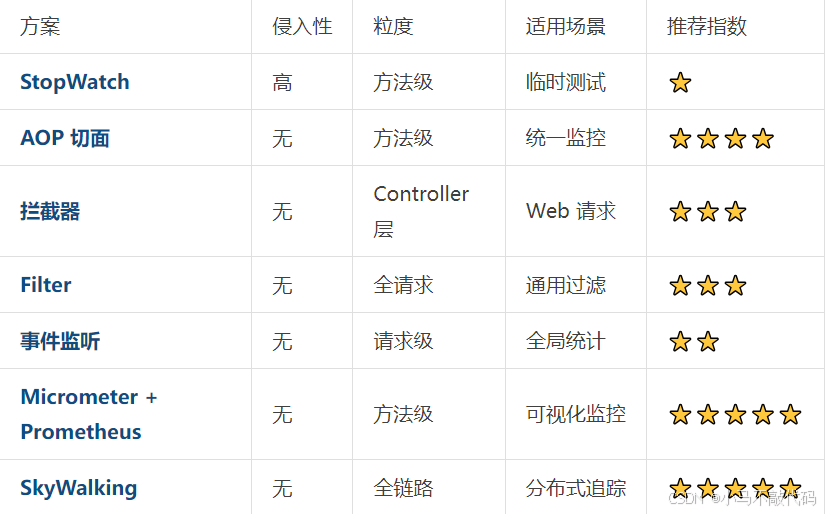
02實戰:6 種方案橫向對比
03方案詳解
方案 1:StopWatch(臨時調試)
代碼:
@GetMapping("/query")
public ResponseEntity<String> query() throws Exception {StopWatch stopWatch = new StopWatch(); // 創建計時器stopWatch.start(); // 開始計時TimeUnit.MILLISECONDS.sleep(new Random().nextLong(2000)); // 模擬業務stopWatch.stop(); // 結束計時System.out.printf("**方法耗時:%dms**%n", stopWatch.getTotalTimeMillis());return ResponseEntity.ok("api query...");
}
注解:
- StopWatch 是 Spring 提供的輕量級計時工具。
- 侵入性強:需手動插入到業務代碼中。
- 適合 臨時調試,生產環境 不推薦。
方案 2:AOP 切面(無侵入)
代碼:
@Aspect // 聲明切面
@Component
public class PerformanceAspect {private static final Logger logger = LoggerFactory.getLogger("api.timed");@Around("@annotation(org.springframework.web.bind.annotation.GetMapping)") // 攔截所有 Get 請求public Object recordExecutionTime(ProceedingJoinPoint pjp) throws Throwable {StopWatch sw = new StopWatch();sw.start();Object result = pjp.proceed(); // 執行原方法sw.stop();logger.info("**方法【{}】耗時: {}ms**", pjp.getSignature(), sw.getTotalTimeMillis());return result;}
}
注解:
- @Around 注解攔截所有 GetMapping 方法,零侵入。
- 通過 ProceedingJoinPoint 獲取方法簽名,精準定位慢接口。
- 缺點:無法監控非 Spring 管理的類(如手動 new 的對象)。
方案 3:攔截器(Controller 層統一監控)
代碼:
public class TimedInterceptor implements HandlerInterceptor {@Overridepublic boolean preHandle(HttpServletRequest request, HttpServletResponse response, Object handler) {request.setAttribute("startTime", System.currentTimeMillis()); // 記錄開始時間return true;}@Overridepublic void afterCompletion(HttpServletRequest request, HttpServletResponse response, Object handler, Exception ex) {long startTime = (long) request.getAttribute("startTime");long cost = System.currentTimeMillis() - startTime;System.out.printf("**請求【%s】耗時: %dms**%n", request.getRequestURI(), cost);}
}@Configuration
public class InterceptorConfig implements WebMvcConfigurer {@Overridepublic void addInterceptors(InterceptorRegistry registry) {registry.addInterceptor(new TimedInterceptor()).addPathPatterns("/api/**"); // 攔截所有 /api 下的請求}
}
注解:
- preHandle 在請求前記錄時間,afterCompletion 在請求后計算耗時。
- 只適用于 Controller 層,無法監控 Service/DAO 層方法。
- 配置簡單,適合 Web 項目快速接入。
方案 4:Filter(Servlet 級通用監控)
代碼:
@Component
public class RequestTimingFilter implements Filter {private static final Logger logger = LoggerFactory.getLogger(RequestTimingFilter.class);@Overridepublic void doFilter(ServletRequest request, ServletResponse response, FilterChain chain)throws IOException, ServletException {HttpServletRequest httpRequest = (HttpServletRequest) request;long startTime = System.nanoTime(); // 高精度計時try {chain.doFilter(request, response); // 繼續處理請求} finally {long duration = TimeUnit.NANOSECONDS.toMillis(System.nanoTime() - startTime);logger.info("**[{}] {} - {}ms (Status: {})**",httpRequest.getMethod(),httpRequest.getRequestURI(),duration,((HttpServletResponse) response).getStatus());}}
}
注解:
- 全局生效,所有請求(包括靜態資源)都會被監控。
- 粒度較粗,無法定位具體方法耗時。
- 可通過 excludePaths 過濾不需要監控的 URI。
方案 5:事件監聽(零侵入全局統計)
代碼:
@Component
public class TimedListener {@EventListener(ServletRequestHandledEvent.class)public void recordTimed(ServletRequestHandledEvent event) {System.err.println("**請求監控事件: " + event + "**");}
}
注解:
- Spring 內部事件機制,無需任何配置。
- 只能獲取 總耗時,無法拆分各階段耗時。
- 適合 快速接入,不適合精細化監控。
方案 6:Micrometer + Prometheus(可視化監控)
代碼:
@RestController
public class ApiController {@Timed(value = "api.query", description = "查詢業務接口") // 關鍵注解@GetMapping("/query")public ResponseEntity<String> query() throws Exception {TimeUnit.MILLISECONDS.sleep(new Random().nextLong(2000));return ResponseEntity.ok("api query...");}
}
配置:
# application.yml
management:endpoints:web:exposure:include: prometheus # 暴露 Prometheus 端點metrics:export:prometheus:enabled: true
Prometheus 配置:- job_name: "spring-boot-app"metrics_path: "/actuator/prometheus"static_configs:- targets: ["localhost:8080"]
注解:
- @Timed 注解 零侵入,自動記錄耗時指標。
- Prometheus + Grafana 可視化展示,支持 報警規則。
- 缺點:需引入額外依賴,適合生產環境。
方案 7:SkyWalking(分布式全鏈路追蹤)
啟動命令:
java -javaagent:/path/skywalking-agent.jar \-Dskywalking.agent.service_name=your-app \-jar your-app.jar
注解:
- 無代碼侵入,通過 Java Agent 自動注入。
- 支持 分布式鏈路追蹤,跨服務追蹤耗時。
- 適合微服務架構,強烈推薦!
如何選?
? 單體應用:Micrometer + Prometheus(可視化 + 報警)。
? 微服務架構:SkyWalking(全鏈路追蹤)。
? 臨時調試:Arthas(在線診斷神器)。


))


)


