一. 簡介:?
? ?關于redis的簡介和部署,可以參考單獨的文章redis-sentinel基礎概念及部署-CSDN博客,這里就不細說了。這里只講講如何在k8s中部署export并基于prometheus做redis的指標采集。
二. 實現方式:
? ? 首先我們需要先部署exporter采集器,提供給prometheus調用 ,這里我們選擇在k8s中部署,好處是: k8s有健康檢測機制,不需要獨立維護exporter的故障問題。這里采用deployment的方式:
# Source: prometheus-redis-exporter/templates/deployment.yaml
apiVersion: apps/v1
kind: Deployment
metadata:name: redis-exporternamespace: monitoringlabels:app.kubernetes.io/name: redis-exporter
spec:replicas: 1selector:matchLabels:app.kubernetes.io/name: redis-exportertemplate:metadata:labels:app.kubernetes.io/name: redis-exporterspec:serviceAccountName: defaultsecurityContext:{}containers:- name: redisn-exportersecurityContext:{}image: "oliver006/redis_exporter:latest"imagePullPolicy: IfNotPresentargs:- "-redis.password=xxxxx"  #這里配置了密碼,如沒有配置,忽略env:ports:- containerPort: 9121livenessProbe:httpGet:path: /port: 9121readinessProbe:httpGet:path: /port: 9121
配置svc:
---
apiVersion: v1
kind: Service
metadata:name: redis-exporternamespace: monitoringlabels:app.kubernetes.io/name: redis-exporter
spec:type: ClusterIPports:- port: 9121targetPort: 9121protocol: TCPname: redis-exporterselector:app.kubernetes.io/name: redis-exporter
配置prometheus的指標采集:
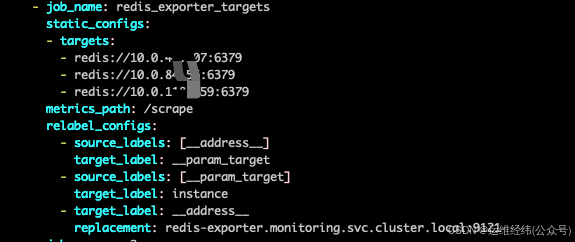
?這里采用了,單exporter采集多redis實例的方式,具體可以根據實際情況,定制:可參考:https://github.com/oliver006/redis_exporter
接下來,就可以驗證指標了:
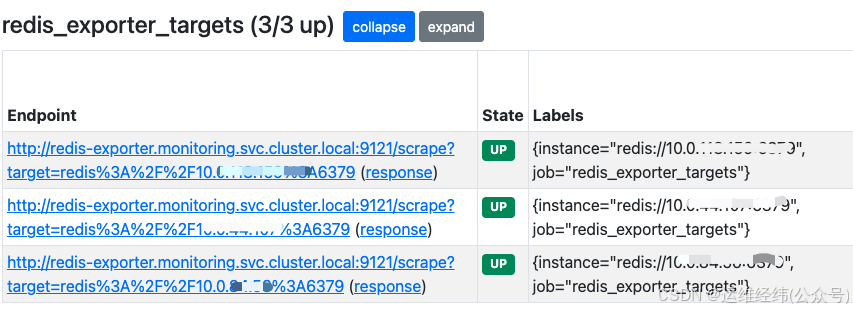
可發現,狀態OK
三. grafana中繪制dashboard看板:
? ? 也可以通過網絡上的開源模版,直接導入:
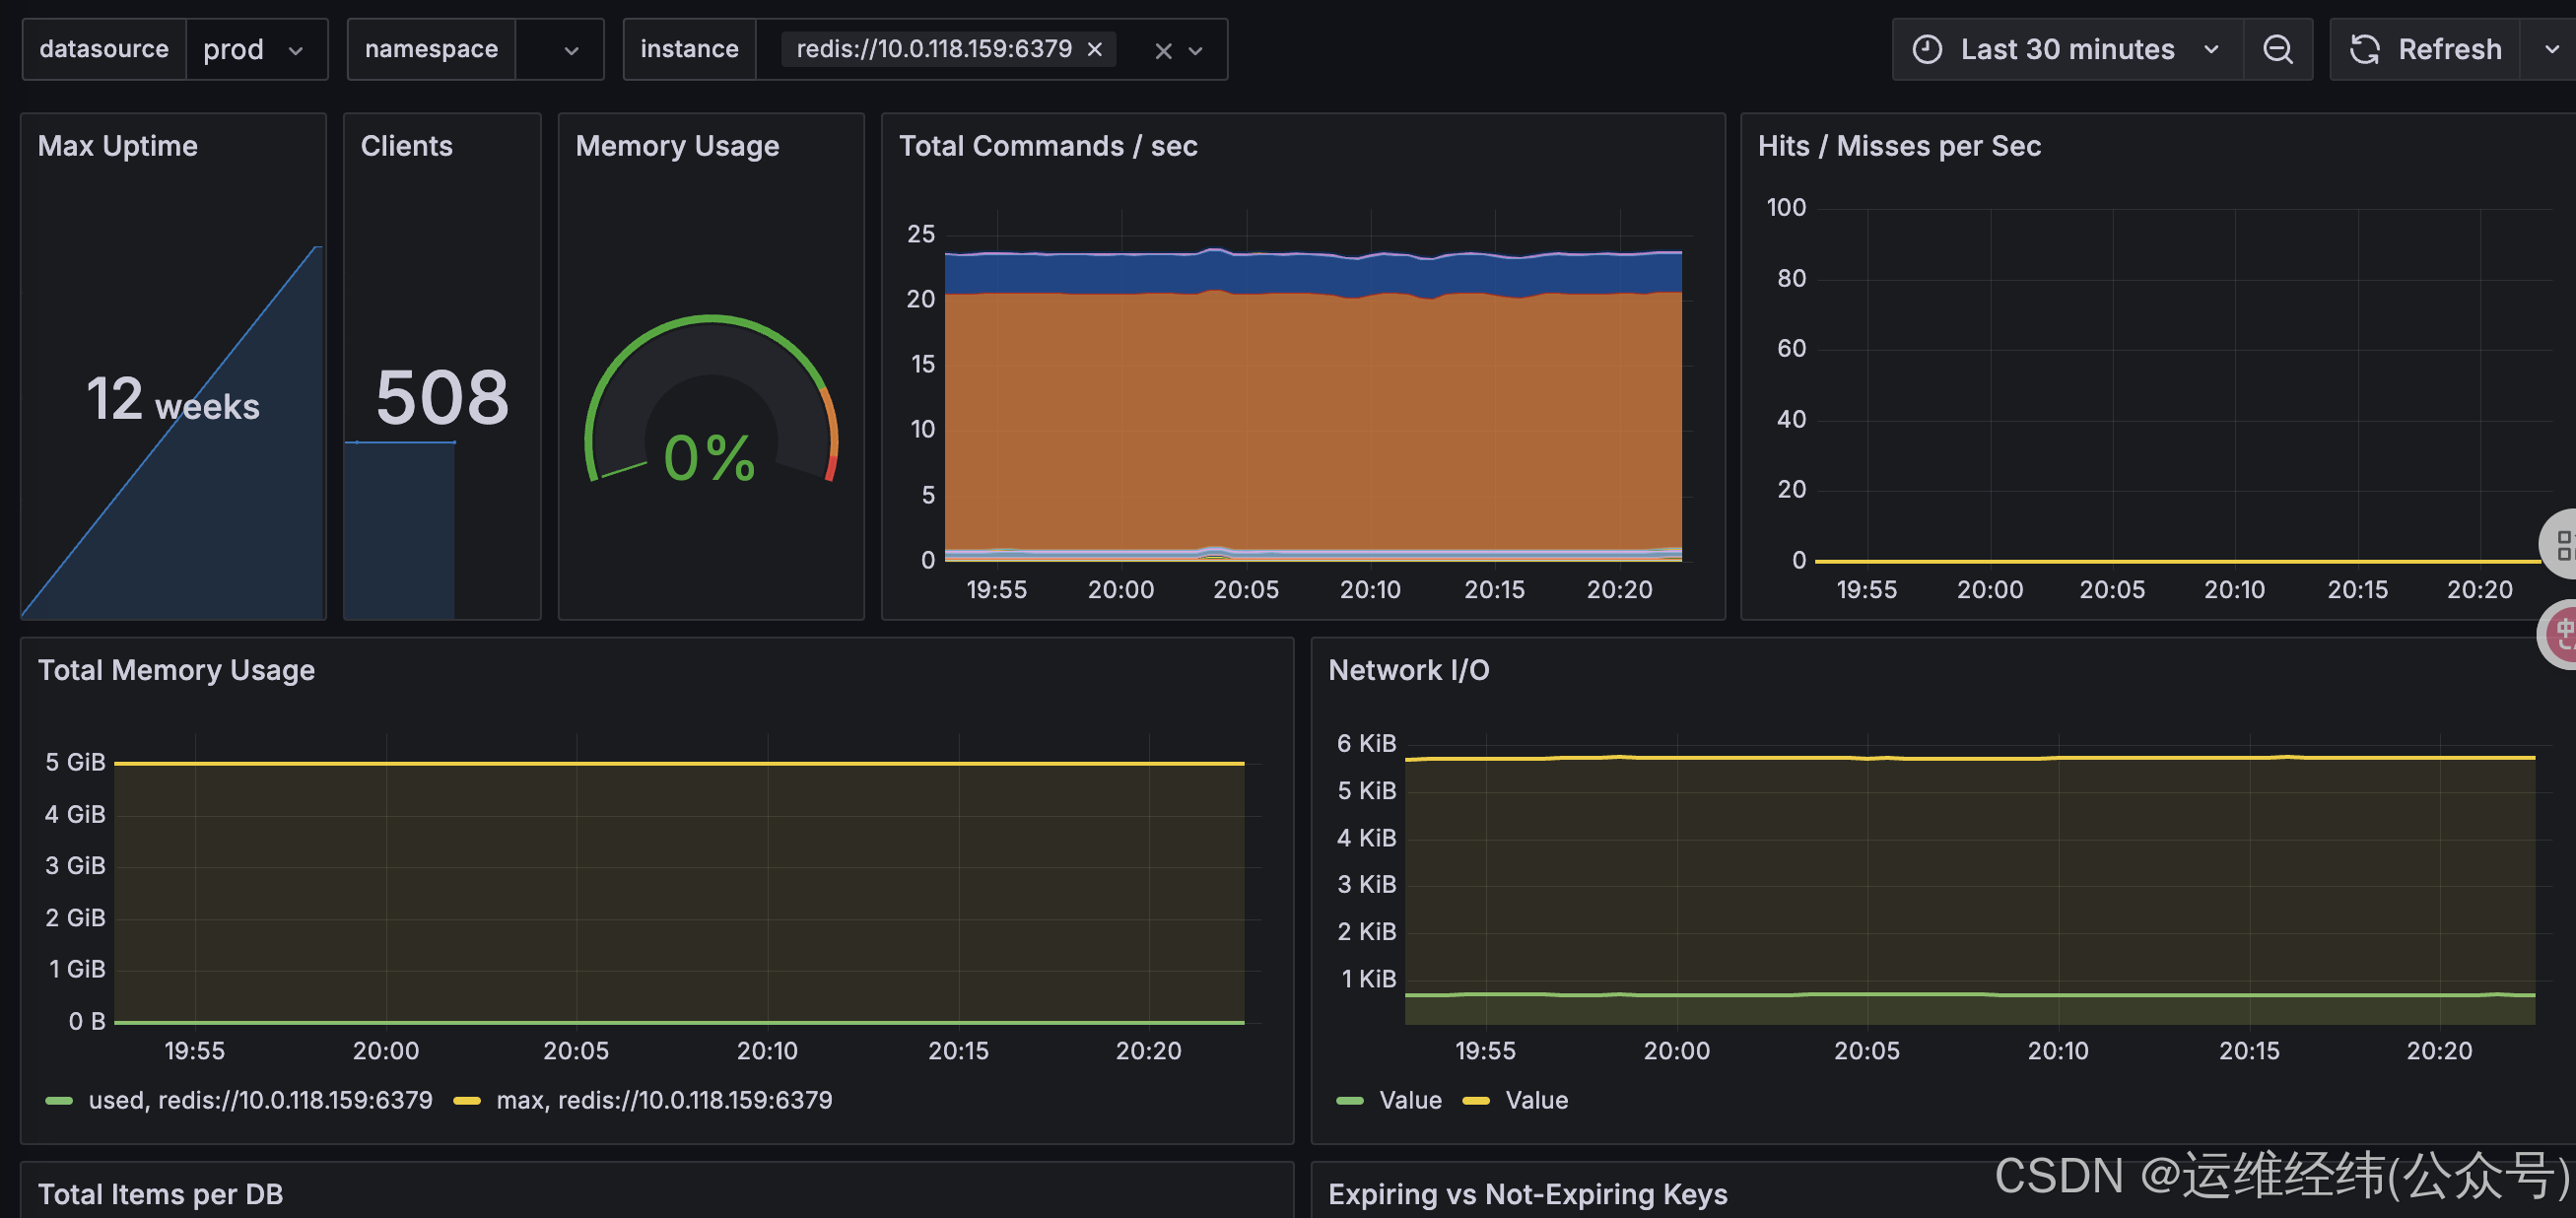
配置完成!
? ---------------------------------------------------------------------------------------
? ? ? ? ? ? ? ? ? ? ? ? ?深耕運維行業多年,擅長運維體系建設,方案落地。歡迎交流!
? ? ? ? ? ? ? ? ? ? ? ? ? ? ? ? ? ? ? ? ? ? ? ? ? ? ?“V-x”: ywjw996
? ? ? ? ? ? ? ? ? ? ? ? ? ? ? ? ? ? ? ? ? ? ? ? ? ? ?《 運維經緯 》


)

)


)