Title
題目
Brain Latent Progression: Individual-based spatiotemporal diseaseprogression on 3D Brain MRIs via latent diffusion
腦潛在進展:基于潛擴散模型的三維腦磁共振成像個體時空疾病進展研究
01
文獻速遞介紹
神經退行性疾病是現代醫療保健領域最緊迫的挑戰之一,這類疾病會導致大腦功能和生活質量不可逆轉地下降。迄今為止,由于尚無有效的治愈方法,患者和護理人員面臨著長期的痛苦,而醫療系統也在不斷攀升的成本和資源需求中艱難應對。解決這一危機需要范式轉變,轉向以早期干預、精準醫療和綜合護理為重點的積極策略。這些疾病極其復雜,表現出與不同分子亞型相關的廣泛神經病理學變異(Tijms 等,2024)。此外,它們在大腦各區域的表現不均衡,通過多種機制以不同速度進展,反映出其病理生理學的復雜本質(Young 等,2018)。解決這一問題需要開發先進工具,以加深我們對疾病機制的理解,最終推動定制化且更有效的治療策略的制定。 早期的疾病進展建模方法側重于捕捉標量生物標志物的動態變化(Young 等,2024;Oxtoby 和 Alexander,2017)。例如,在 Firth 等(2019)的研究中,通過對特定腦區的體積變化進行建模,研究了在后部皮質萎縮患者中觀察到的特征性萎縮模式。盡管標量生物標志物提供了簡化的表征,但它們極大地促進了我們對各種神經退行性疾病的理解,如阿爾茨海默病(AD)(Vogel 等,2021)和多發性硬化癥(Eshaghi 等,2021)。然而,這些方法的一個顯著局限性是它們無法捕捉可能更準確反映疾病潛在病理生理學的時空特征。例如,額顳葉癡呆患者在出現任何可檢測到的體積減少之前,丘腦就已出現形態改變(Cury 等,2019)。 對時空模式的日益認可推動了傳統疾病進展模型向時空方法的演變。時空模型(Young 等,2024)通常利用高維數據,如 3D 形狀或完整的醫學掃描,以更詳細和全面的方式表征疾病動態,能夠可視化并精確定位隨時間推移發生的復雜結構變化。 具體而言,本文將重點關注應用于 3D T1 加權腦磁共振成像(T1w brain MRIs)的時空模型,旨在在個體水平上估計大腦在病理狀態(如神經退行性變)和非病理狀態(即衰老)下發生的結構變化。我們確定并聚焦于與該任務相關的四個主要挑戰: 1. 個體化:疾病進展受各種個體因素影響,包括人口統計學和臨床變量。為提高預測準確性,模型必須整合并利用受試者特異性元數據。 2. 縱向數據利用:縱向數據提供了有關個體疾病軌跡的寶貴見解,例如每位患者的進展速度。在可獲得縱向數據時,模型應將其整合到推理過程中。 3. 時空一致性:多個時間點的疾病進展預測應呈現平滑、一致的演變,與潛在的生物學過程相符。 4. 內存需求:處理 3D 醫學圖像需要大量內存資源,這可能會限制模型在資源匱乏環境中的適用性(Blumberg 等,2018)。使此類模型能夠在消費級硬件上運行將有助于更廣泛的采用。 為解決這些挑戰,我們引入了腦潛在進展模型(Brain Latent Progression, BrLP),這是一種新型的基于個體的時空模型,能夠在個體水平上預測 3D 腦磁共振成像中的疾病進展。BrLP 在應對上述挑戰方面有幾項關鍵貢獻。首先,我們提出將潛在擴散模型(LDM)(Rombach 等,2022)與 ControlNet(Zhang 等,2023)相結合,以在可用受試者數據的條件下生成個體化腦磁共振成像,從而解決挑戰 1。其次,我們通過采用輔助模型來整合疾病進展的先驗知識,該輔助模型可推斷不同腦區的體積變化,在可獲得縱向數據時能夠利用這些數據,進而解決挑戰 2。第三,我們引入了潛在平均穩定化(Latent Average Stabilization, LAS) 技術,以提高預測進展的時空一致性,解決挑戰 3。第四,我們利用腦磁共振成像的潛在表征來減少處理 3D 掃描的內存需求,解決挑戰 4。最后,我們展示了如何利用 LAS 在全局和體素水平上推導預測的不確定性度量,這可作為臨床應用中的可靠性指標。 我們訓練 BrLP 以了解具有不同認知狀態的受試者大腦中發生的結構變化:認知正常(CN)、輕度認知障礙(MCI)和阿爾茨海默病(AD)。為此,我們使用了來自 2805 名受試者的 11,730 幅 T1 加權磁共振成像組成的大型數據集,這些數據來源于三項關于阿爾茨海默病的公開縱向研究。此外,我們采用了來自 962 名受試者的 2257 幅 T1 加權磁共振成像的外部縱向數據集,以評估我們的方法對樣本外數據的泛化能力。據我們所知,我們是首個提出將疾病進展先驗知識整合到圖像生成過程中的 3D 條件生成腦磁共振成像模型的團隊。 這項工作在多個方面擴展了我們在 MICCAI 2024 會議上發表的文章(Puglisi 等,2024):(1)通過分析 LAS 算法的超參數豐富了消融研究;(2)在外部數據集上測試 BrLP 以評估其泛化能力;(3)評估認知狀態作為條件變量的影響;(4)在 BrLP 框架內引入一種機制來量化全局和體素水平上的預測不確定性,并提供統計分析以支持我們的發現;(5)展示了 BrLP 在臨床試驗患者選擇中的潛在臨床應用示例。
Aastract
摘要
The growing availability of longitudinal Magnetic Resonance Imaging (MRI) datasets has facilitated ArtificialIntelligence (AI)-driven modeling of disease progression, making it possible to predict future medical scansfor individual patients. However, despite significant advancements in AI, current methods continue toface challenges including achieving patient-specific individualization, ensuring spatiotemporal consistency,efficiently utilizing longitudinal data, and managing the substantial memory demands of 3D scans. To addressthese challenges, we propose Brain Latent Progression (BrLP), a novel spatiotemporal model designed topredict individual-level disease progression in 3D brain MRIs. The key contributions in BrLP are fourfold:(i) it operates in a small latent space, mitigating the computational challenges posed by high-dimensionalimaging data; (ii) it explicitly integrates subject metadata to enhance the individualization of predictions; (iii)it incorporates prior knowledge of disease dynamics through an auxiliary model, facilitating the integration oflongitudinal data; and (iv) it introduces the Latent Average Stabilization (LAS) algorithm, which (a) enforcesspatiotemporal consistency in the predicted progression at inference time and (b) allows us to derive a measureof the uncertainty for the prediction at the global and voxel level. We train and evaluate BrLP on 11,730T1-weighted (T1w) brain MRIs from 2,805 subjects and validate its generalizability on an external test setcomprising 2,257 MRIs from 962 subjects. Our experiments compare BrLP-generated MRI scans with realfollow-up MRIs, demonstrating state-of-the-art accuracy compared to existing methods.
縱向磁共振成像(MRI)數據集的日益豐富,為人工智能(AI)驅動的疾病進展建模提供了便利,使得預測個體患者未來的醫學影像成為可能。然而,盡管AI領域已取得顯著進展,當前方法仍面臨諸多挑戰,包括實現患者特異性個體化、確保時空一致性、高效利用縱向數據,以及處理三維影像龐大的內存需求。為解決這些挑戰,我們提出了腦潛在進展模型(Brain Latent Progression, BrLP)——一種新型時空模型,旨在預測三維腦MRI中的個體水平疾病進展。BrLP的核心貢獻體現在四個方面: ? (i)它在低維潛在空間中運行,減輕了高維影像數據帶來的計算挑戰; ? (ii)通過明確整合受試者元數據,提升預測的個體化程度; ? (iii)借助輔助模型融入疾病動態的先驗知識,促進縱向數據的有效整合; ? (iv)提出潛在平均穩定化(Latent Average Stabilization, LAS)算法,該算法(a)在推理階段確保預測進展的時空一致性,(b)支持在全局和體素水平推導預測的不確定性度量。 ? 我們基于11,730幅來自2,805名受試者的T1加權(T1w)腦MRI對BrLP進行訓練和評估,并在包含962名受試者的2,257幅MRI的外部測試集上驗證其泛化能力。實驗將BrLP生成的MRI影像與真實隨訪MRI對比,結果表明該模型的準確性優于現有方法,達到當前最優水平。
Method
方法
We now introduce the architecture of BrLP, comprising four keycomponents: an LDM, a ControlNet, an auxiliary model, and a LASblock, each described in successive paragraphs. These four components,summarized in Fig. 1, collectively address the challenges outlined in theintroduction. In particular, the LDM is designed to generate random3D brain MRIs that conform to specific covariates, while ControlNetaims to specialize these MRI scans to specific anatomical structures ofa subject. Additionally, the auxiliary model leverages prior knowledgeof disease progression to improve the precision in predicting the volumetric changes of specific brain regions. Finally, the LAS block is usedduring inference to improve spatiotemporal consistency, as well as toderive a measure of uncertainty for the predictions both at the globalvoxel level.
?我們現將介紹 BrLP 的架構,該架構包含四個關鍵組件:潛在擴散模型(LDM)、控制網絡(ControlNet)、輔助模型和潛在平均穩定化(LAS)模塊,各組件將在后續段落中依次描述。這四個組件的匯總如圖 1 所示,共同應對引言中提出的各項挑戰。具體而言,潛在擴散模型(LDM)用于生成符合特定協變量的隨機 3D 腦磁共振成像(MRIs),而控制網絡(ControlNet)旨在將這些 MRI 掃描結果特化為特定受試者的解剖結構。此外,輔助模型借助疾病進展的先驗知識,提高對特定腦區體積變化預測的精度。最后,潛在平均穩定化(LAS)模塊在推理階段用于提升時空一致性,并在全局和體素水平上推導預測的不確定性度量。
Conclusion
結論
This work introduces BrLP, a 3D spatiotemporal model that accurately captures neurodegenerative disease progression patterns by predicting individual 3D brain MRI evolution. While we focused on brainMRI applications, BrLP’s potential extends to other imaging modalities and progressive diseases. Moreover, the model can potentiallyincorporate additional covariates, such as genetic data, for enhancedindividualization. Our experiments demonstrate how BrLP can be usedfor patient selection in clinical trials to reduce the risk of type IIerrors. We believe that its application also extends to post-trial analysis,where, by generating digital twins of participants, BrLP could simulate untreated disease trajectories, enabling individualized treatmenteffect assessment. This approach could reduce the reliance on controlgroups and mitigate ethical concerns related to withholding potentialtherapeutic benefits.
本研究提出了腦潛在進展模型(BrLP),這是一種三維時空模型,通過預測個體三維腦磁共振成像(MRI)的演變,精準捕捉神經退行性疾病的進展模式。盡管我們的研究聚焦于腦MRI應用,但BrLP的潛力可擴展至其他成像模態和進行性疾病。此外,該模型還有望整合額外的協變量(如遺傳數據),以進一步增強個體化預測能力。 ? 我們的實驗表明,BrLP可用于臨床試驗中的患者篩選,以降低Ⅱ類錯誤風險。我們認為,其應用范圍還可擴展至試驗后分析:通過生成受試者的數字孿生體,BrLP能夠模擬未接受治療的疾病軌跡,從而實現個體化治療效果評估。這種方法可減少對對照組的依賴,并減輕因延遲潛在治療獲益而引發的倫理擔憂。
Results
結果
In this section, we first describe the datasets and evaluation metricsused in our study. We then present an extensive evaluation of BrLPthrough five distinct experiments: an ablation study examining BrLP’scomponents and hyperparameters, a comparative analysis against established baseline methods, an investigation of the impact of cognitivestatus conditioning, an assessment of our proposed uncertainty metricsat the global and voxel level, and an exploration of BrLP’s potential toreduce Type II errors in clinical trials.
在本節中,我們首先描述本研究中使用的數據集和評估指標。隨后,通過五項獨立實驗對BrLP進行全面評估:一項針對BrLP組件及超參數的消融研究,一項與現有基準方法的對比分析,一項關于認知狀態條件變量影響的探究,一項對我們提出的全局和體素水平不確定性度量的評估,以及一項關于BrLP在減少臨床試驗中Ⅱ類錯誤方面潛力的探索。
Figure
圖
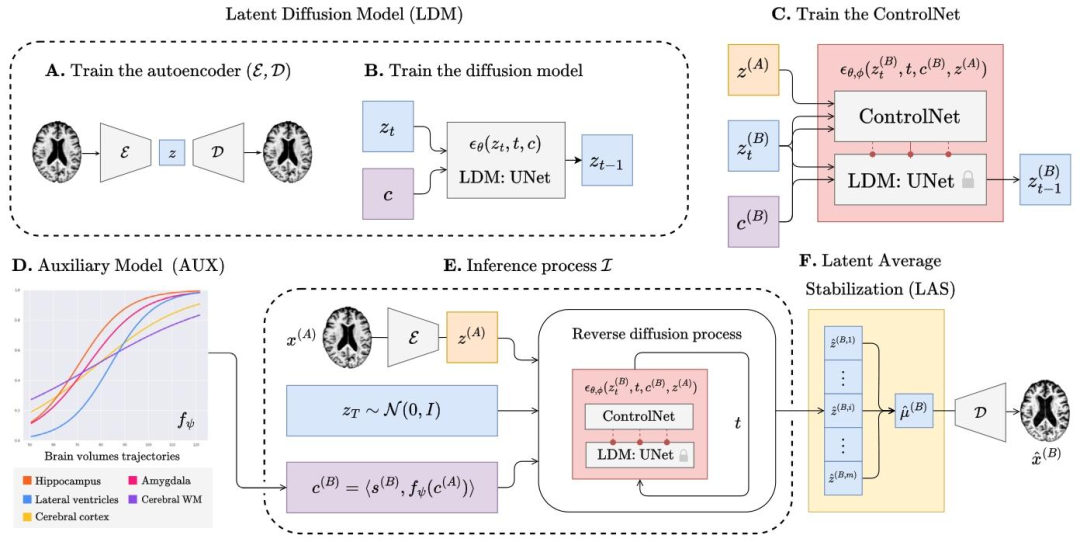
Fig. 1. The overview of BrLP training and inference process. The training process outputs an autoencoder (A) that maps 3D brain MRIs into small latent representations; an LDM(B) able to generate latent representations according to subject-specific and progression-related covariates; a ControlNet (C), able to constrain the LDM’s generation process to asubject’s brain. During inference (E), progression-related variables at the target age are first predicted by an auxiliary model (D). These predictions, combined with subject-specificvariables and the baseline MRI, condition the generation of the latent representations corresponding to the predicted brain at the target age. Finally, the LAS algorithm (F) repeatsthis process 𝑚 times and averages the obtained latent representations before decoding the result into the 3D MRI space.
圖1 BrLP訓練與推理過程概述。訓練過程輸出:一個自編碼器(A),用于將3D腦磁共振成像(MRIs)映射到低維潛在表征中;一個潛在擴散模型(LDM,B),能夠根據受試者特異性協變量和進展相關協變量生成潛在表征;一個控制網絡(ControlNet,C),能夠將LDM的生成過程約束于特定受試者的腦部結構。在推理階段(E),目標年齡下的進展相關變量首先由輔助模型(D)預測。這些預測結果與受試者特異性變量及基線MRI相結合,為目標年齡下預測腦結構對應的潛在表征生成提供條件約束。最后,潛在平均穩定化(LAS)算法(F)重復此過程𝑚次,并對得到的潛在表征取平均值,再將結果解碼至3D MRI空間。
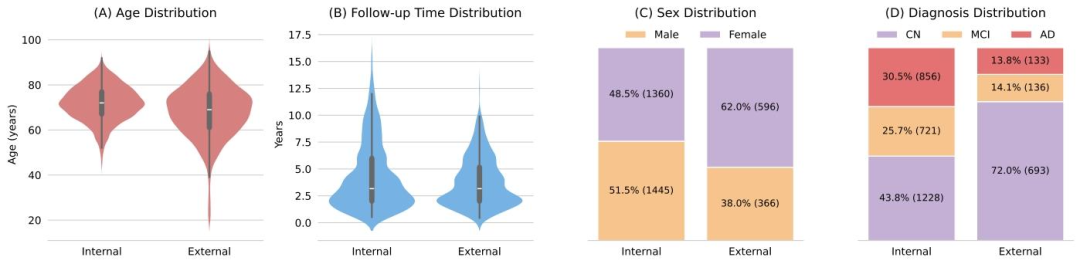
Fig. 2.Demographic and diagnostic statistics of the internal and external datasets. Distributions include (A) age at baseline, (B) average time interval between the initial andfollow-up visits, (C) sex distribution, and (D) diagnosis (CN, MCI, AD) at final visit.
圖2 內部數據集與外部數據集的人口統計學及診斷統計結果。分布圖包括:(A)基線年齡分布,(B)首次就診與隨訪就診之間的平均時間間隔分布,(C)性別分布,以及(D)末次就診時的診斷結果分布(認知正常(CN)、輕度認知障礙(MCI)、阿爾茨海默病(AD))。?
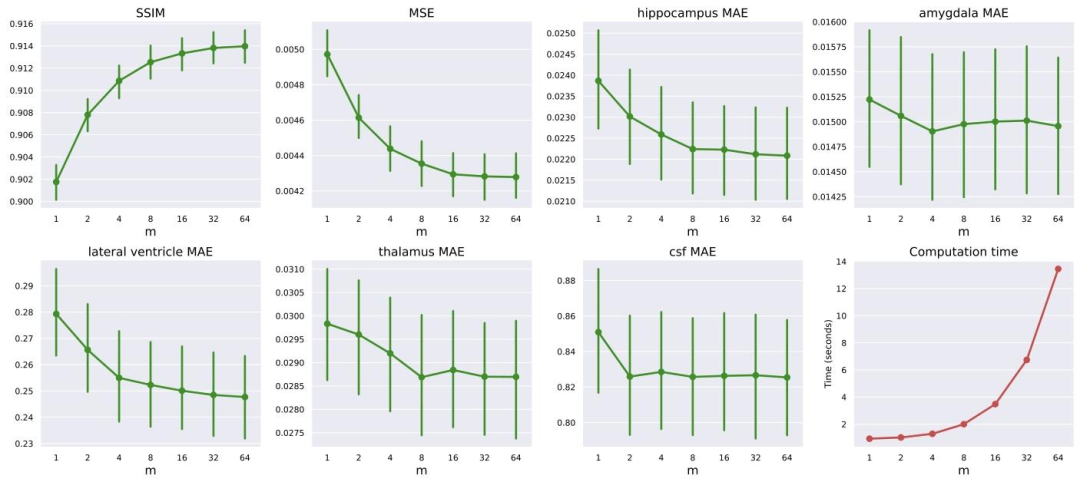
Fig. 3. Effect of varying the LAS parameter 𝑚 on different performance metrics and computation time. The plots show the trends for SSIM, MSE, MAE for different brain regions(hippocampus, amygdala, lateral ventricle, thalamus, and CSF) and computation time as 𝑚 increases from 1 to 64. Error bars indicate the 95% confidence intervals of the metric.Most metrics show improvements (higher SSIM, lower MSE and MAE) with increasing 𝑚.
圖3 LAS參數𝑚的變化對不同性能指標和計算時間的影響。圖表展示了隨著𝑚從1增加到64,結構相似性指數(SSIM)、均方誤差(MSE)、不同腦區(海馬體、杏仁核、側腦室、丘腦和腦脊液)的平均絕對誤差(MAE)以及計算時間的變化趨勢。誤差線表示指標的95%置信區間。大多數指標隨𝑚增大呈現改善趨勢(SSIM升高,MSE和MAE降低)。
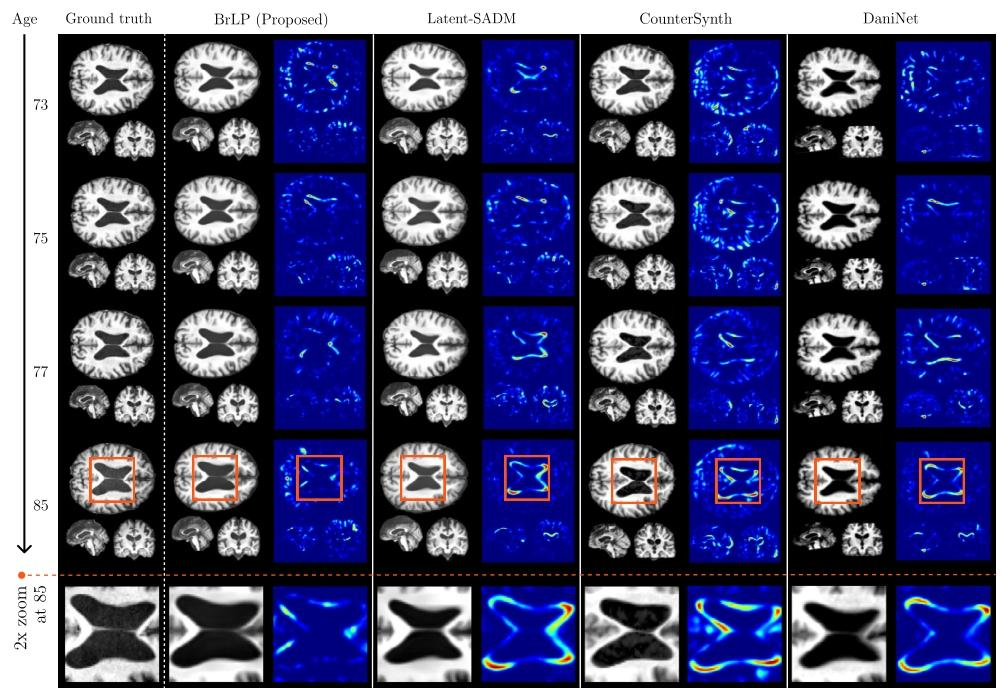
Fig. 4. A comparison between the real progression of a 70 y.o. subject with MCI (from the internal test set) over 15 years and the predictions obtained by BrLP and the baselinemethods. Each method shows a predicted MRI (left) and its deviation from the subject’s real brain MRI (right)
圖4 一名70歲輕度認知障礙(MCI)受試者(來自內部測試集)15年間的真實病情進展與BrLP及基準方法預測結果的對比。每種方法均展示了預測的MRI(左側)及其與該受試者真實腦MRI的偏差(右側)。
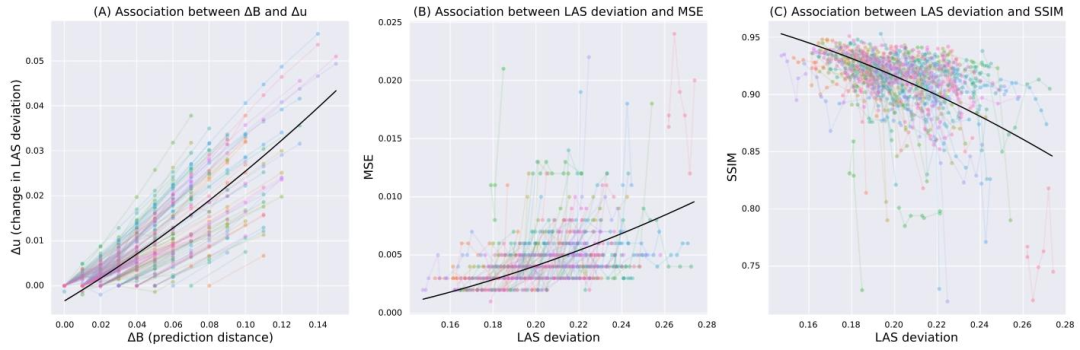
Fig. 5. (A) Difference in uncertainty (𝑦-axis) as a function of prediction distance (𝑥-axis) in years (divided by 100). (B) MSE (𝑦-axis) as a function of uncertainty (𝑥-axis). (C)SSIM (𝑦-axis) as a function of uncertainty (𝑥-axis). In all plots, colored lines represent trends for individual subjects, and the black line shows the overall fixed effect from a linearmixed-effects model.
圖5 (A)不確定性差異(𝑦軸)與預測時間距離(𝑥軸,單位:年,已除以100)的關系。(B)均方誤差(MSE,𝑦軸)與不確定性(𝑥軸)的關系。(C)結構相似性指數(SSIM,𝑦軸)與不確定性(𝑥軸)的關系。所有圖表中,彩色線條代表個體受試者的趨勢,黑色線條表示線性混合效應模型的整體固定效應。
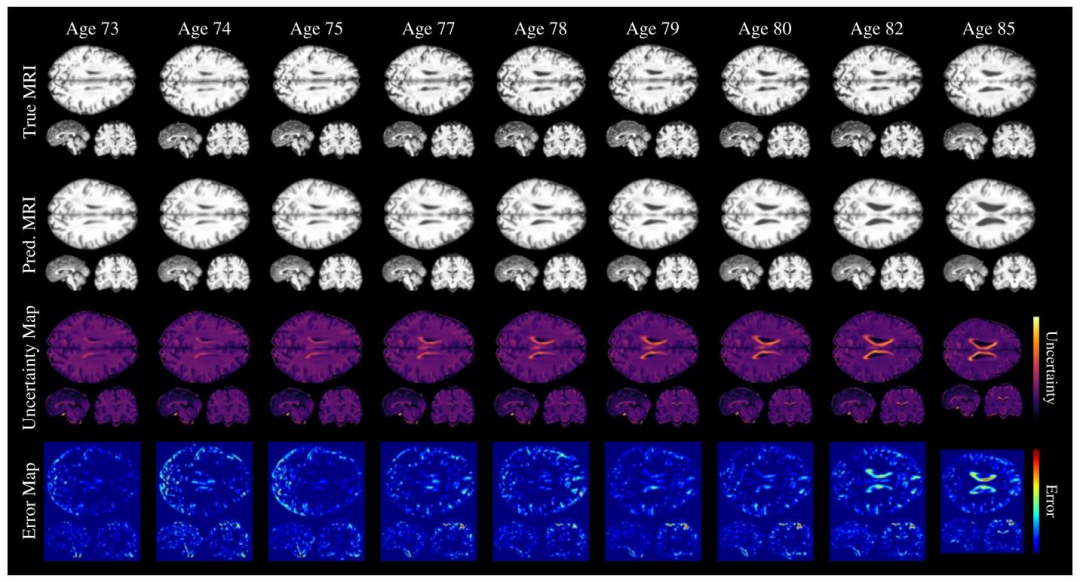
Fig. 6. Voxel-level uncertainty evaluated for predictions at different timesteps for a single subject. The first and second rows show the ground truth and predicted MRIs, respectively,at each timestep. The third row presents the uncertainty maps, with lighter colors indicating higher uncertainty. The fourth row displays the voxel-level squared?error betweenthe ground truth and predicted MRIs.
圖6 單名受試者不同時間步預測結果的體素水平不確定性評估。第一行和第二行分別顯示每個時間步的真實MRI和預測MRI。第三行呈現不確定性圖,顏色越淺表示不確定性越高。第四行顯示真實MRI與預測MRI之間的體素水平平方誤差。
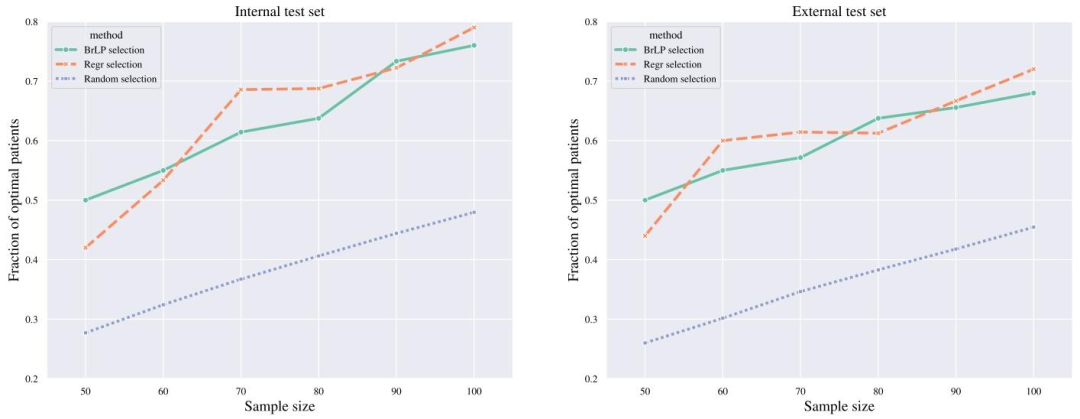
Fig. 7. Comparison of patient selection methods for identifying fast progressors in clinical trials. The plot shows the efficacy (𝑦-axis) of three selection methods (Random, BrLP, andRegression) across various sample sizes (𝑥-axis) in both internal and external test sets. Efficacy is measured as the proportion of fast progressors (based on hippocampal atrophy)correctly identified by each method compared to the optimal selection.
圖7臨床試驗中快速進展者識別的患者篩選方法對比。圖表展示了在內部和外部測試集中,三種篩選方法(隨機篩選法、BrLP法、回歸法)在不同樣本量(𝑥軸)下的效能(𝑦軸)。效能定義為每種方法相對最優篩選結果而言,正確識別的快速進展者(基于海馬體萎縮判定)所占比例。?
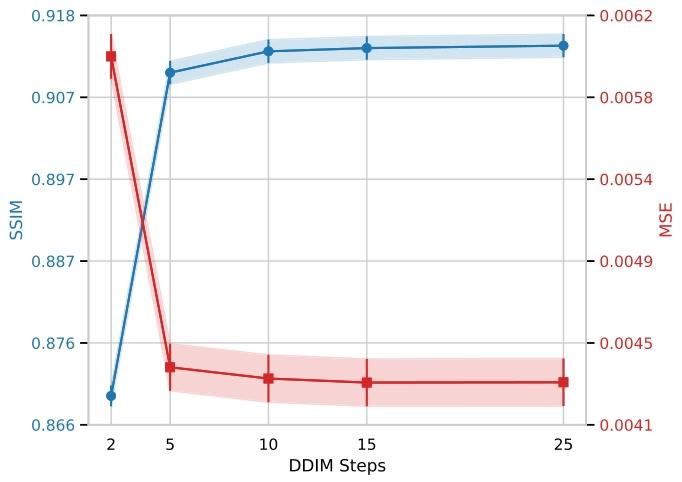
Fig. 8. Effect of the number of DDIM inference steps on BrLP performance. SSIM (leftaxis, blue) and MSE (right axis, red) are reported for different numbers of denoisingsteps. Shaded areas indicate 95% confidence intervals.
圖8 DDIM推理步數對BrLP性能的影響。圖表中報告了不同去噪步數下的結構相似性指數(SSIM,左軸,藍色)和均方誤差(MSE,右軸,紅色)。陰影區域表示指標的95%置信區間。
Table
表
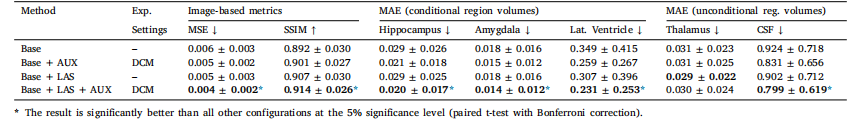
Table 1Results from the ablation study. MAE (±SD) in predicted volumes is expressed as a percentage of total brain volume.
表1消融研究結果。預測體積的平均絕對誤差(MAE ± 標準差)以占全腦體積的百分比表示。?
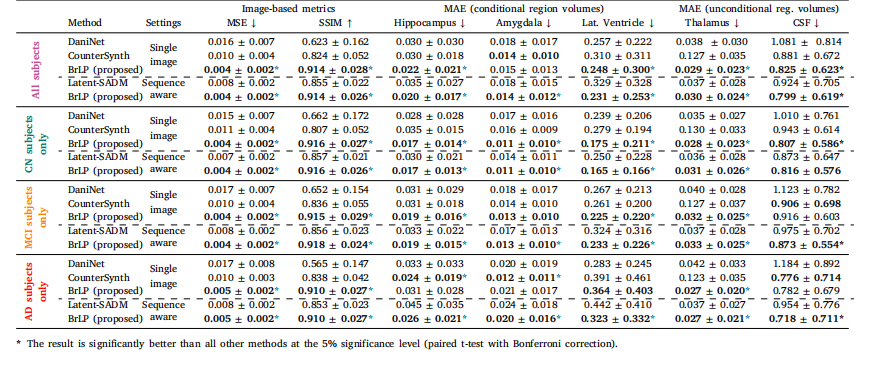
Table 2Results from the comparison with baseline methods on the internal test set. MAE (±SD) in predicted volumes is expressed as a percentage of total brain volume.
表2內部測試集上與基準方法的對比結果。預測體積的平均絕對誤差(MAE ± 標準差)以占全腦體積的百分比表示。?
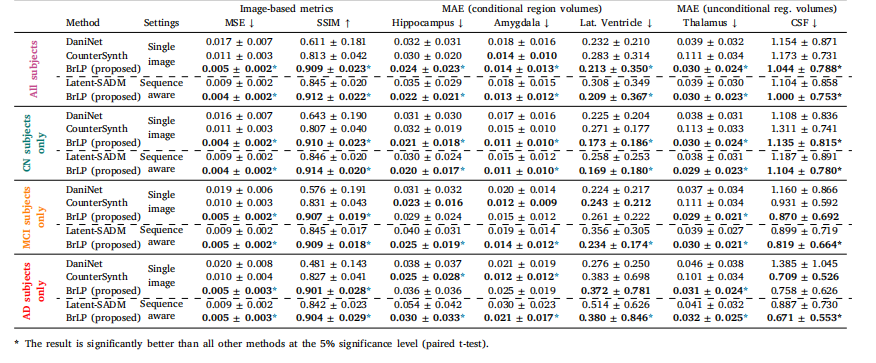
Table 3Results from the comparison with baseline methods on the external test set. MAE (±SD) in predicted volumes is expressed as a percentage of total brain volume
表3 外部測試集上與基準方法的對比結果。預測體積的平均絕對誤差(MAE ± 標準差)以占全腦體積的百分比表示。
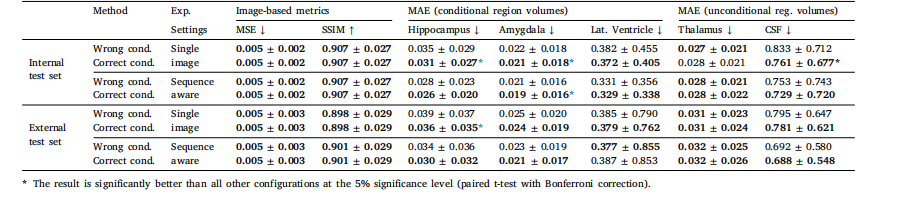
Table 4Evaluating the impact of incorrect conditioning on cognitive status in BrLP predictions. MAE (±SD) in predicted volumes is expressed as a percentage of total brain volume.
表4 認知狀態條件變量錯誤設定對BrLP預測結果的影響評估。預測體積的平均絕對誤差(MAE ± 標準差)以占全腦體積的百分比表示。
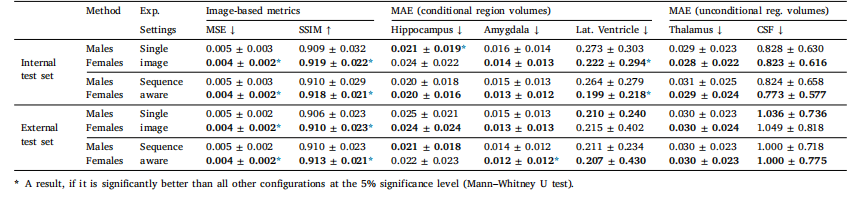
Table 5Evaluation of BrLP performance differences between male and female subjects. MSE and regional MAE values (±SD) are reported, with the best result for each metric between thetwo groups highlighted in bold
表5 男性與女性受試者的BrLP性能差異評估。表中報告了均方誤差(MSE)和各區域平均絕對誤差(MAE)值(±標準差),兩組間每項指標的最佳結果以粗體突出顯示。

:Stable Diffusion XL 理論與實現)

)


![[vibe coding-lovable]lovable是不是ai界的復制忍者卡卡西?](http://pic.xiahunao.cn/[vibe coding-lovable]lovable是不是ai界的復制忍者卡卡西?)

)


