vscode使用斷點
1.安裝并激活擴展
- Debugger for Chrome (棄用 --> JavaScript Debugger)
- Debugger for Firefox
2. 配置config文件
打開 config/index.js 并找到 devtool property。將其更新為:
如果你使用的是 Vue CLI 2,請設置并更新 config/index.js 內的 devtool property
devtool: 'source-map'
如果你使用的是 Vue CLI 3,請設置并更新 vue.config.js 內的 devtool property:
module.exports = {configureWebpack: {devtool: 'source-map'}
}
3. 配置launch.json文件
點擊在 Activity Bar 里的 Debugger 圖標來到 Debug 視圖,然后點擊那個齒輪圖標來配置一個 launch.json 的文件,選擇 Chrome/Firefox:Launch 環境。然后將生成的 launch.json 的內容替換成為相應的配置:
0808 項目對應的端口
{"version": "0.2.0","configurations": [{"type": "chrome","request": "launch","name": "vuejs: chrome","url": "http://localhost:8080","webRoot": "${workspaceFolder}/src","breakOnLoad": true,"sourceMapPathOverrides": {"webpack:///src/*": "${webRoot}/*"}},{"type": "firefox","request": "launch","name": "vuejs: firefox","url": "http://localhost:8080","webRoot": "${workspaceFolder}/src","pathMappings": [{ "url": "webpack:///src/", "path": "${webRoot}/" }]}]
}
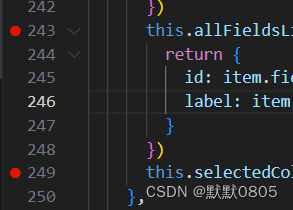
4.設置斷點
5.F5運行調試
運行調試后,出現新的工具欄以及鼠標懸浮在斷點數據上,可以看到當前的數據內容.

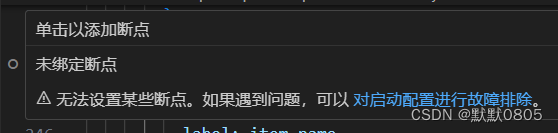
問題
1.如果斷點顯示以下錯誤,可能是 映射sourcemap路徑 錯誤
2.設置允許任何文件中設置斷點
vscode工具中 文件 -> 首選項 -> 設置 -> 功能 -> 調試


紋理貼圖)


)


