
注明:一下的軟件需要自己準備
一、準備環境:
1.兩臺elasticsearch主機4G內存
2.兩臺elasticsearch配置主機名node1和node2(可以省略)
#vim? /etc/hostname
#reboot
3. 兩臺elasticsearch配置hosts文件
#vim? /etc/hosts
192.168.1.1? node1
192.168.1.2? node2
4.檢查java環境
#java? -version
5.關閉防火墻和selinux
6.利用ping測試,分別ping兩個主機的名,看是否可以通
二、部署elasticsearch
以下前五步,在兩個es上都要做,只是節點名不一樣,es1位node1,es2為node2
1.安裝elasticsearch(在兩臺主機上都要安裝)
#rpm? -ivh? /mnt/elasticsearch-5.5.0.rpm
#systemctl? daemon-reload
#systemctl? enable elasticsearch
2.更改elasticsearch主配置文件(配置都有修改即可 )
#vim /etc/elasticsearch/elasticsearch.yml
cluster.name: my-application?? //群集名字
node.name: node1? //節點名字
path.data: /data/elk_data? //數據存放路徑
path.logs: /var/log/elasticsearch? //日志存放路徑
bootstrap.memory_lock: false? //在啟動時不鎖定內存,可以提高性能
network.host: 0.0.0.0?? //監聽地址0.0.0.0代表所有
http.port: 9200?????? //監聽端口
discovery.zen.ping.unicast.hosts: ["node1", "node2"]? //群集發現通過單播實現
3.創建數據存放路徑并授權
#mkdir? -p? /data/elk_data?
#chown? elasticsearch:elasticsearch?? /data/elk_data? 將/data/elk_data目錄的歸屬更改為elasticsearch
4.啟動elasticsearch并查看是否啟動成功(可能需要重啟系統)
#systemctl? start? elasticsearch
# netstat -anpt|grep 9200
tcp6?????? 0???? ?0 :::9200???????? :::*?????? LISTEN????? 1018/java
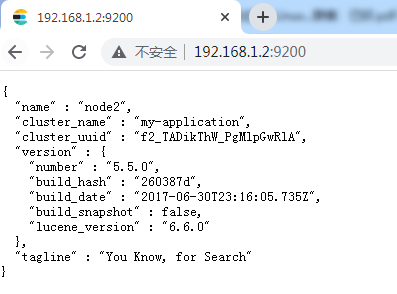
5.在客戶機上查看節點信息
Node1節點1的信息

Node2節點1的信息
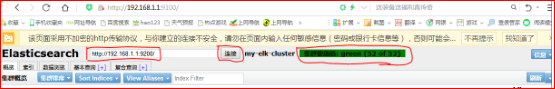
查看群集是否健康

查看群集的狀態

三、在es1上安裝elasticsearch-head插件
注:es-head是es的web前端工具,可以更直觀方便的管理es集群,在es5.0后需要做為獨立服務進行安裝,需要npm命令,安裝es-head需要提前安裝node和phantomjs,node是一個基于chrome v8引擎的javascript運行環境,而phantomjs是一個基于webkit的javascriptAPI,可以理解為一個隱形的瀏覽器
(1)安裝node 大約需要40分鐘時間
#tar zxf? /mnt/node-v8.2.1.tar.gz -C /usr/src?? //解壓的目錄不能有中文路徑
# cd? /usr/src/node-v8.2.1/
#./configure&&make&&make install
(2)安裝phantomjs
#tar? xvjf? /mnt/phantomjs-2.1.1-linux-x86-64.tar.bz2 -C? /usr/src
#cd? /usr/src/phantomjs-2.1.1-linux-x86_64/bin
#cp? phantomjs? /usr/local/bin
(3)安裝elasticsearch-head
# tar zxf? /mnt/elasticsearch-head.tar.gz? -C? /usr/src
#cd? /usr/src/elasticsearch-head/
#npm? install? //安裝依賴包
(4)修改elasticsearch主配置文件
#vim? /etc/elasticsearch/elasticsearch.yml
http.cors.enabled: ?true?? //增加? 開啟跨域訪問支持,默認為false
http.cors.allow-origin: ?"*"? //增加? 跨域訪問允許的域名地址 即在es head中訪問es
# systemctl restart? elasticsearch.service
(5)啟動es-head服務(必須在elasticsearch-head目錄下啟動):監聽端口為tcp 9100
[root@node4 elasticsearch-head]# npm run start & //前臺啟動,一旦關閉中斷,服務也將隨之關閉
(6)通過elasticsearch-head查看elasticsearch信息,發現索引為空
(7)插入索引。通過命令插入一個測試索引,通過輸出信息可以看到索引為index-demo,類型為test(此步完全是為了驗證可以省略)
# curl? -XPUT? 'localhost:9200/index-demo/test/1?pretty&pretty' -H 'Content-Type: application/json' -d '{"user":"zhangsan","mesg":"hello world"}'
{
? "_index" : "index-demo",
? "_type" : "test",
? "_id" : "1",
? "_version" : 1,
? "result" : "created",
? "_shards" : {
??? "total" : 2,
??? "successful" : 2,
??? "failed" : 0
? },
? "created" : true
}
四、在node1上安裝kibana
1.安裝kibana
# rpm? -ivh? /mnt/kibana-5.5.1-x86_64.rpm
# systemctl enable? kibana
2.設置kibana的主配置文件/etc/kibana/kibana.yml(默認存在配置,去掉注釋)
server.port: 5601??????????????????????????? ?? //kibana打開的監聽端口
server.host: "0.0.0.0"???????? //kibana監聽的地址
elasticsearch.url: http://192.168.1.1:9200? ?與elasticsearch建立連接
kibana.index: ".kibana"?? //在es中添加.kibana索引
3.啟動kibana服務:監聽端口為tcp5601
# systemctl? start? kibana
4.在客戶機訪問kibana驗證kibana
??? 
五、在apache上安裝并配置logstash,收集apache的訪問和錯誤日期,并將其發送給elashticsearch服務器
將apache服務器的日志添加到elasticsearch并通過kibana顯示
1.準備工作,安裝httpd
#yum? -y ?install ?httpd
2.啟動httpd
#systemctl? restart? httpd
3.在客戶機上訪問httpd
4.在apache服務器上安裝logstash,以便將收集到的日志發送到elasticsearch中
#rpm? -ivh? /mnt/logstash-5.5.1.rpm
#systemctl? daemon-reload
#systemctl? enable? logstash
5.編寫logstash配置文件apache_log.conf
# vim? /etc/logstash/conf.d/apache_log.conf
input {??????
?file{
??????????????? path => "/etc/httpd/logs/access_log"? //收集apache的訪問日志
??????????????? type => "access"?? //指定日志類型為access(訪問日志),可以自定義
??????????????? start_position => "beginning"? //從日志開始處收集
?}
?file{
??????????????? path => "/etc/httpd/logs/error_log"? //收集apache的錯誤日志
??????????????? type => "error"??????? //指定日志類型為error(錯誤日志),可以自定義
??????????????? start_position => "beginning"? //從日志開始處收集
?}
}
output {
??????? if [type] == "access" {???????? //如果類型為access,即apache訪問日志
??????????????? elasticsearch {????? ???//輸出到elasticsearch
????????????????? ??????hosts => ["192.168.1.1:9200"]? //es服務器監聽地址及端口
??????????????????????? index => "apache_access-%{+YYYY.MM.dd}" //指定索引格式
??????????????????????? }
?? }
??????? if [type] == "error" {? ?//如果類型為error,即apache錯誤日志
??????????????? elasticsearch {?? //輸出到elasticsearch
??????????????????????? hosts => ["192.168.1.1:9200"]? ?//es服務器監聽地址及端口
??????????????????????? index => "apache_error-%{+YYYY.MM.dd}" ?//指定索引格式
??????????????????????? }
?? }
? }
6.啟動logstash并加載配置文件
# /usr/share/logstash/bin/logstash? -f? /etc/logstash/conf.d/apache_log.conf
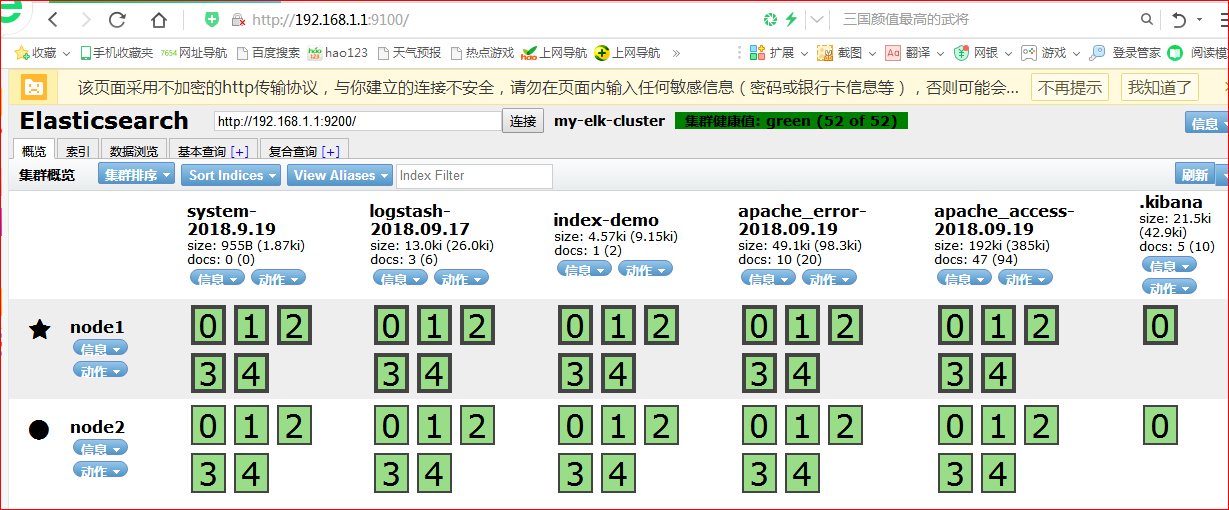
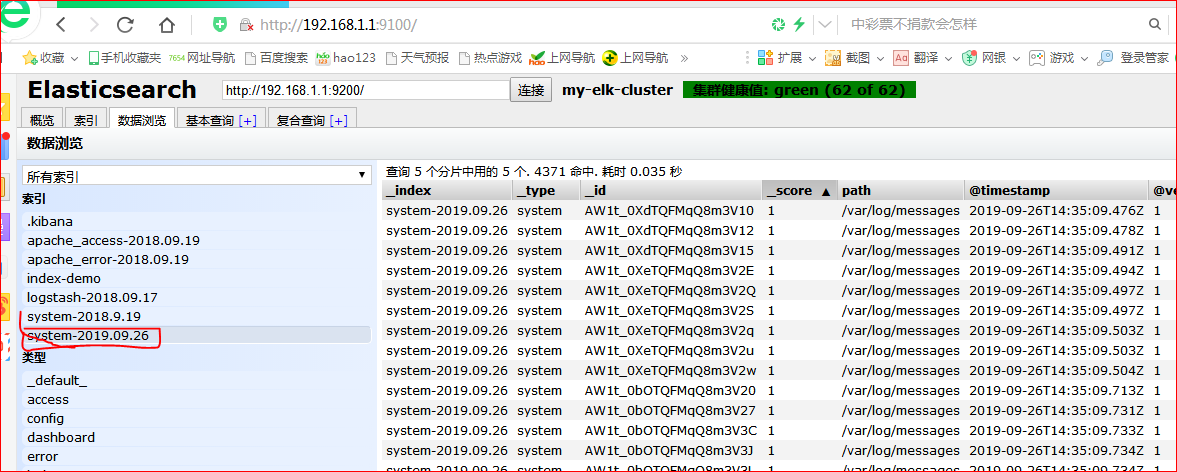
7.通過瀏覽器訪問http://192.168.1.1:9100查看索引是否創建
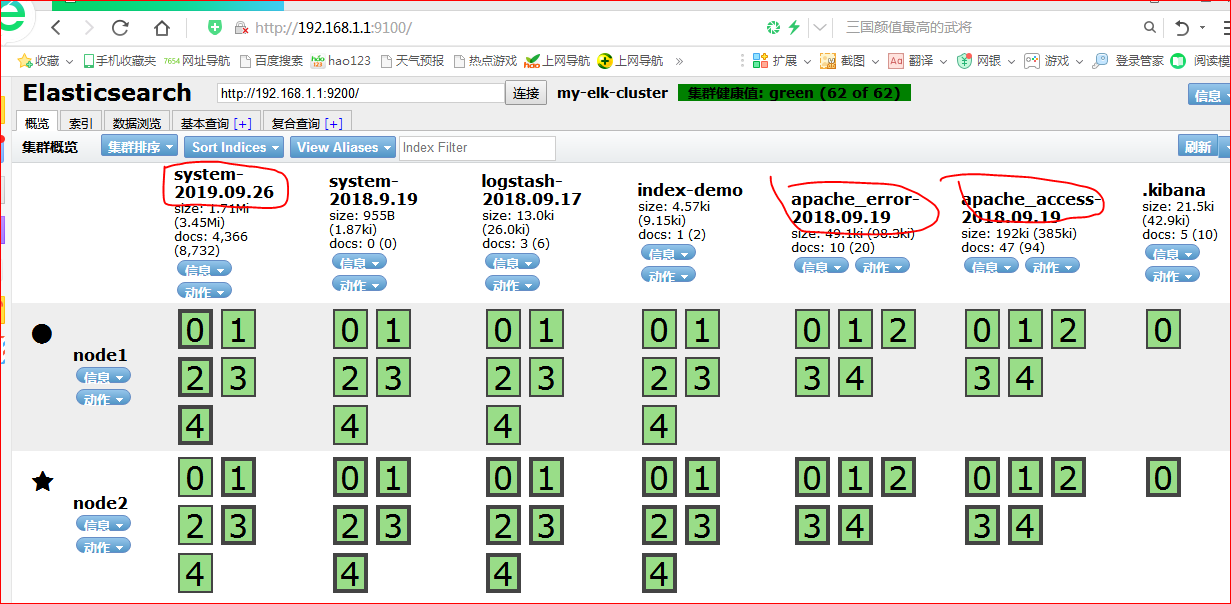
六、在apache服務器上,通過修改logstash配置文件,讓其收集系統日志/va/log/messages,并將其輸出到elasticsearch中(視需要)
# chmod? o+r? /var/log/messages
# vim /etc/logstash/conf.d/system.conf
input {
??????? file{
??????????????? path => "/var/log/messages"
??????????????? type => "system"
??????????????? start_position => "beginning"
??????? }
?}
output {
??????? elasticsearch {
??????? hosts => ["192.168.1.1:9200"]
??????? index => "system-%{+YYYY.MM.dd}"
}
七、在es1上配置kibana
1.在客戶機上登錄kibana
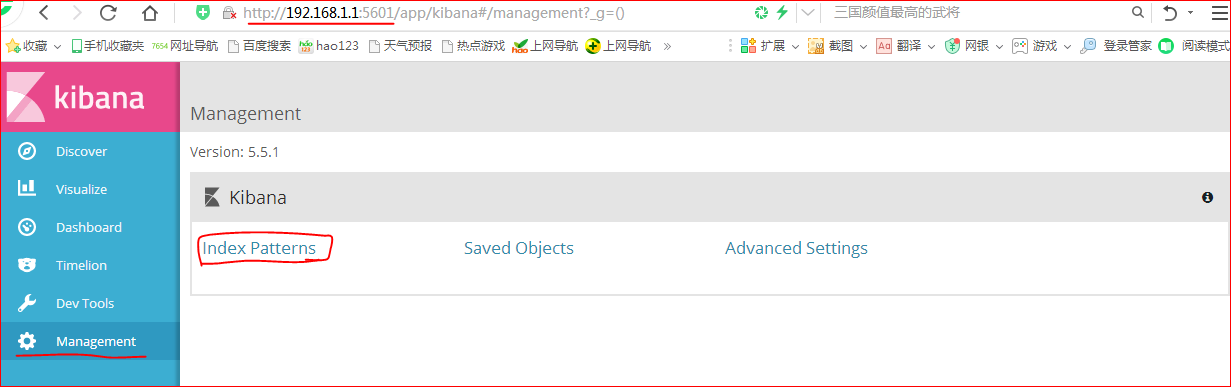
2.點擊+create? index? pattern添加apache_access索引和apache_error索引
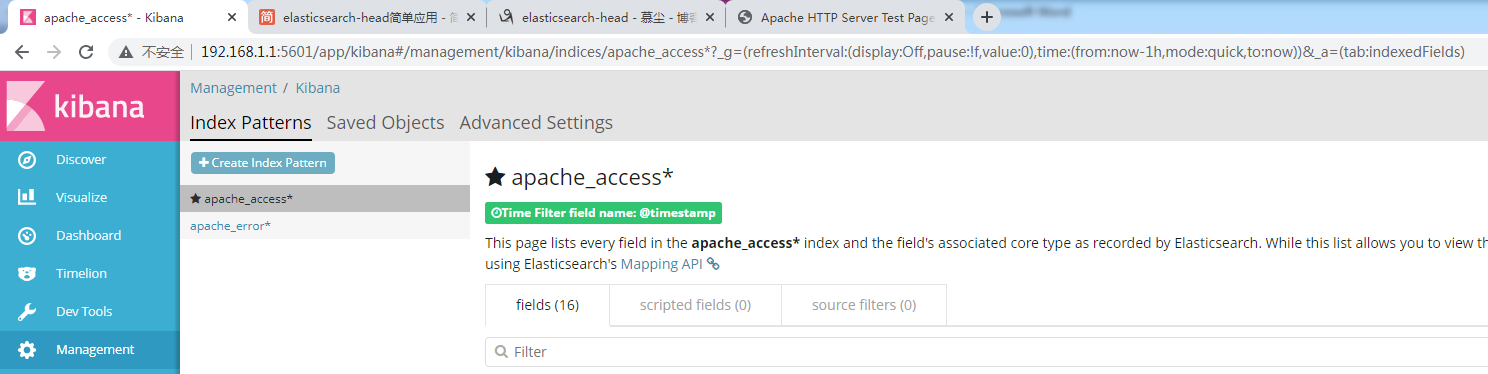
|

3.選擇Discover選項卡,在中間下拉列表中選擇剛添加的apache_access-*索引,可以查看相應的圖表及日志信息

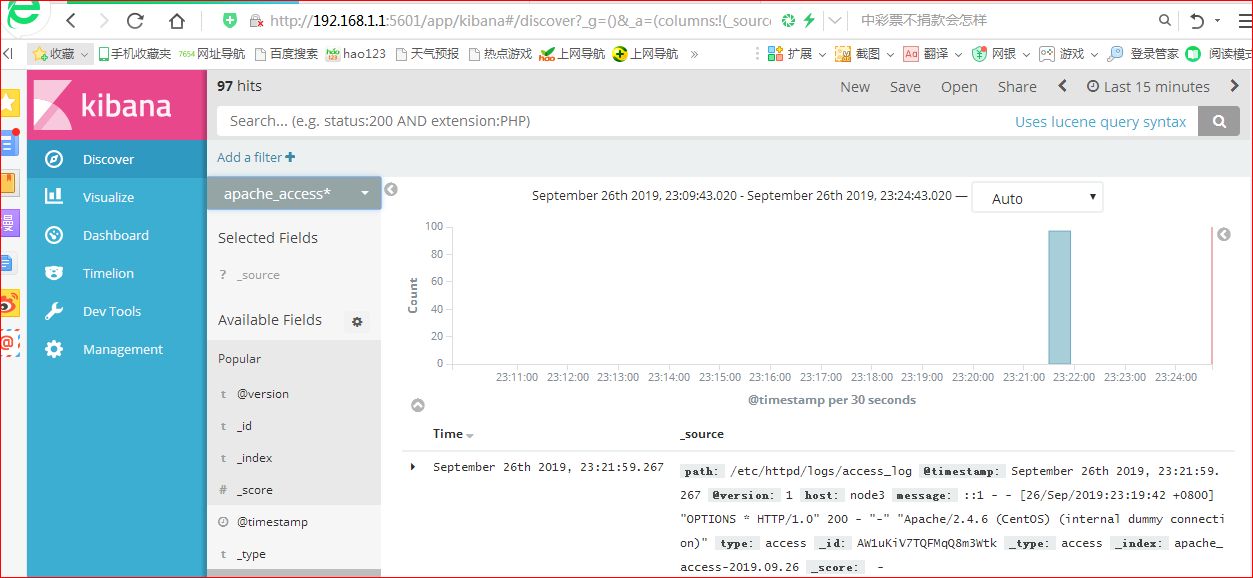


)

)


)
)
)
