Python 備忘單
目錄
1.語法和空格
2.注釋
3.數字和運算
4.字符串處理
5.列表、元組和字典
6.JSON
7.循環
8.文件處理
9.函數
10.處理日期時間
11.NumPy
12.Pandas
要運行單元格,請按 Shift+Enter 或單擊頁面頂部的 Run(運行)。
1.語法和空格
Python 使用縮進空格來指示語句的級別。下面的單元格是一個示例,其中 ‘if’ 和 ‘else’ 處于同一級別,而 ‘print’ 由空格分隔到不同級別。相同級別的項目的間距應相同。
student_number = input("Enter your student number:")
if student_number != 0:print("Welcome student {}".format(student_number))
else:print("Try again!")
Enter your student number: 1Welcome student 1
2.注釋
在 Python 中,注釋以井號 ‘# ’ 開頭并延伸至該行的末尾。’# ’ 可以在行的開頭或代碼之后。
# 這是打印“hello world!”的代碼print("Hello world!") # 打印 hello world 語句
print("# 在本例中不是注釋")
Hello world!
# 在本例中不是注釋
3.數字和運算
與其他編程語言一樣,有四種類型的數字:
- 由 int 表示的整數(例如 1、20、45、1000)
- 由 float 表示的浮點數(例如 1.25、20.35、1000.00)
- 長整數
- 復數(例如 x+2y,其中 x 是已知的)
| 運算 | 結果 |
|---|---|
| x+y | x 與 y 的和 |
| x - y | x 與 y 的差 |
| x * y | x 與 y 的乘積 |
| x / y | x 和 y 的商 |
| x // y | x 和 y 的商(取整) |
| x % y | x / y 的余數 |
| abs(x) | x 的絕對值 |
| int(x) | 將 x 轉換為整數 |
| long(x) | 將 x 轉換為長整數 |
| float(x) | 將 x 轉換為浮點 |
| pow(x, y) | x 的 y 次方 |
| x ** y | x 的 y 次方 |
# 數字示例
a = 5 + 8
print("Sum of int numbers: {} and number format is {}".format(a, type(a)))b = 5 + 2.3
print ("Sum of int and {} and number format is {}".format(b, type(b)))
Sum of int numbers: 13 and number format is <class 'int'>
Sum of int and 7.3 and number format is <class 'float'>
4.字符串處理
與其他編程語言一樣,Python 具有豐富的字符串處理功能。
# 將字符串存儲在變量中
test_word = "hello world to everyone"# 打印 test_word 值
print(test_word)# 使用 [] 訪問字符串的字符。第一個字符由 '0' 表示。
print(test_word[0])# 使用 len() 函數查找字符串的長度
print(len(test_word))# 在字符串中查找的一些示例
print(test_word.count('l')) # 計算 l 在字符串中重復出現的次數
print(test_word.find("o")) # 在字符串中查找字母 'o'。返回第一個匹配項的位置。
print(test_word.count(' ')) # 計算字符串中的空格數
print(test_word.upper()) # 將字符串更改為大寫
print(test_word.lower()) # 將字符串更改為小寫
print(test_word.replace("everyone","you")) # 將單詞“everyone”替換為“you”
print(test_word.title()) # 將字符串更改為標題格式
print(test_word + "!!!") # 連結字符串
print(":".join(test_word)) # 在每個字符之間添加“:”
print("".join(reversed(test_word))) # 將字符串進行反轉
hello world to everyone
h
23
3
4
3
HELLO WORLD TO EVERYONE
hello world to everyone
hello world to you
Hello World To Everyone
hello world to everyone!!!
h:e:l:l:o: :w:o:r:l:d: :t:o: :e:v:e:r:y:o:n:e
enoyreve ot dlrow olleh
5.列表、元組和字典
Python 支持數據類型列表、元組、字典和數組。
列表
通過將所有項目(元素)放在方括號 [ ] 內并以逗號分隔來創建列表。列表可以具有任意數量的項目,并且它們可以具有不同的類型(整數、浮點數、字符串等)。
# Python 列表類似于數組。您也可以創建空列表。my_list = []first_list = [3, 5, 7, 10]
second_list = [1, 'python', 3]
# 嵌套多個列表
nested_list = [first_list, second_list]
nested_list
[[3, 5, 7, 10], [1, 'python', 3]]
# 合并多個列表
combined_list = first_list + second_list
combined_list
[3, 5, 7, 10, 1, 'python', 3]
# 您可以像分割字符串一樣分割列表
combined_list[0:3]
[3, 5, 7]
# 將新條目追加到列表
combined_list.append(600)
combined_list
[3, 5, 7, 10, 1, 'python', 3, 600]
# 從列表中刪除最后一個條目
combined_list.pop()
600
# 迭代列表
for item in combined_list:print(item)
3
5
7
10
1
python
3
元組
元組類似于列表,但是您可以將其與括號 ( ) 一起使用,而不是與方括號一起使用。主要區別在于元組不可變,而列表可變。
my_tuple = (1, 2, 3, 4, 5)
my_tuple[1:4]
(2, 3, 4)
字典
字典也稱為關聯數組。字典由鍵值對的集合組成。每個鍵值對將鍵映射到其關聯值。
desk_location = {'jack': 123, 'joe': 234, 'hary': 543}
desk_location['jack']
123
6.JSON
JSON 是用 JavaScript 對象表示法編寫的文本。Python 有一個名為 json 的內置程序包,可用于處理 JSON 數據。
import json# 示例 JSON 數據
x = '{"first_name":"Jane", "last_name":"Doe", "age":25, "city":"Chicago"}'# 讀取 JSON 數據
y = json.loads(x)# 打印輸出結果,類似于字典
print("Employee name is "+ y["first_name"] + " " + y["last_name"])
Employee name is Jane Doe
7.循環
If, Else, ElIf 循環:和其他任何編程語言一樣,Python 支持條件語句。Python 依靠縮進(行的開頭是空格)來定義代碼范圍。
a = 22
b = 33
c = 100# if ... else 示例
if a > b:print("a is greater than b")
else:print("b is greater than a")# if .. else .. elif 示例if a > b:print("a is greater than b")
elif b > c:print("b is greater than c")
else:print("b is greater than a and c is greater than b")
b is greater than a
b is greater than a and c is greater than b
While 循環:只要條件為 true,就執行一組語句
# while 示例
i = 1
while i < 10:print("count is " + str(i))i += 1print("="*10)# 如果 x 為 2,則繼續進行下一個迭代。最后,條件為 false 時打印消息。x = 0
while x < 5:x += 1if x == 2:continueprint(x)
else:print("x is no longer less than 5")
count is 1
count is 2
count is 3
count is 4
count is 5
count is 6
count is 7
count is 8
count is 9
==========
1
3
4
5
x is no longer less than 5
For 循環: For 循環更像 Python 中的迭代器。For 循環用于遍歷序列(列表、元組、字典、集合、字符串或范圍)。
# 循環示例
fruits = ["orange", "banana", "apple", "grape", "cherry"]
for fruit in fruits:print(fruit)print("\n")
print("="*10)
print("\n")# 迭代范圍
for x in range(1, 10, 2):print(x)
else:print("task complete")print("\n")
print("="*10)
print("\n")# 迭代多個列表
traffic_lights = ["red", "yellow", "green"]
action = ["stop", "slow down", "go"]for light in traffic_lights:for task in action:print(light, task)
orange
banana
apple
grape
cherry
?
==========
?
1
3
5
7
9
task complete
?
==========
?
red stop
red slow down
red go
yellow stop
yellow slow down
yellow go
green stop
green slow down
green go
8.文件處理
在 Python 中處理文件的主要函數是 open() 函數。open() 函數使用兩個參數:filename 和 mode。
打開文件有四種不同的方法(模式):
- “r” - 讀取
- “a” - 追加
- “w” - 寫入
- “x” - 創建
此外,您還可以指定是以二進制還是文本模式處理文件。
- “t” - 文本
- “b” - 二進制
# 我們來創建一個測試文本文件
!echo "This is a test file with text in it.This is the first line." > test.txt
!echo "This is the second line." >> test.txt
!echo "This is the third line." >> test.txt
# 讀取文件
file = open('test.txt', 'r')
print(file.read())
file.close()print("\n")
print("="*10)
print("\n")# 讀取文件的前 10 個字符
file = open('test.txt', 'r')
print(file.read(10))
file.close()print("\n")
print("="*10)
print("\n")# 從文件中讀取行file = open('test.txt', 'r')
print(file.readline())
file.close()
This is a test file with text in it.This is the first line.
This is the second line.
This is the third line.
?
?
==========
?
This is a
?
==========
?
This is a test file with text in it.This is the first line.
# 創建新文件file = open('test2.txt', 'w')
file.write("This is content in the new test2 file.")
file.close()# 讀取新文件的內容
file = open('test2.txt', 'r')
print(file.read())
file.close()
This is content in the new test2 file.
# 更新文件
file = open('test2.txt', 'a')
file.write("\nThis is additional content in the new file.")
file.close()# 讀取新文件的內容
file = open('test2.txt', 'r')
print(file.read())
file.close()
This is content in the new test2 file.
This is additional content in the new file.
# 刪除文件
import os
file_names = ["test.txt", "test2.txt"]
for item in file_names:if os.path.exists(item):os.remove(item)print(f"File {item} removed successfully!")else:print(f"{item} file does not exist.")
File test.txt removed successfully!
File test2.txt removed successfully!
9.函數
函數是在調用時運行的代碼塊。您可以將數據或 參數 傳遞到函數中。在 Python 中,函數是由 def 定義的。
# 定義函數
def new_funct():print("A simple function")# 調用函數
new_funct()
A simple function
# 帶有參數的示例函數def param_funct(first_name):print(f"Employee name is {first_name}.")param_funct("Harry")
param_funct("Larry")
param_funct("Shally")
Employee name is Harry.
Employee name is Larry.
Employee name is Shally.
匿名函數 (lambda):lambda 是一個小的匿名函數。Lambda 函數可以使用任意數量的參數,但只有一個表達式。
# lambda 示例
x = lambda y: y + 100
print(x(15))print("\n")
print("="*10)
print("\n")x = lambda a, b: a*b/100
print(x(2,4))
115
?
==========
?
0.08
10.處理日期時間
Python 中的 datetime 模塊可用于處理日期對象。
import datetimex = datetime.datetime.now()print(x)
print(x.year)
print(x.strftime("%A"))
print(x.strftime("%B"))
print(x.strftime("%d"))
print(x.strftime("%H:%M:%S %p"))
2024-05-15 12:42:35.994638
2024
Wednesday
May
15
12:42:35 PM
11.NumPy
NumPy 是使用 Python 進行科學計算的基本軟件包。以下是它包含的一部分內容:
- 強大的 N 維數組對象
- 復雜的(廣播)函數
- 集成 C/C++ 和 Fortran 代碼的工具
- 有用的線性代數、傅立葉變換和隨機數功能
# 使用 pip 安裝 NumPy
!pip install numpy
Requirement already satisfied: numpy in /home/ec2-user/anaconda3/envs/python3/lib/python3.10/site-packages (1.22.4)
# 導入 NumPy 模塊
import numpy as np
檢查您的數組
# 創建數組
a = np.arange(15).reshape(3, 5) # 在 3 x 5 維中創建范圍為 0-14 的數組
b = np.zeros((3,5)) # 使用 0 創建數組
c = np.ones( (2,3,4), dtype=np.int16 ) # 使用 1 創建數組并定義數據類型
d = np.ones((3,5))
a.shape # 數組維度
(3, 5)
len(b)# 數組長度
3
c.ndim # 數組維度的數量
3
a.size # 數組元素的數量
15
b.dtype # 數組元素的數據類型
dtype('float64')
c.dtype.name # 數據類型的名稱
'int16'
c.astype(float) # 將數組類型轉換為其他類型
array([[[1., 1., 1., 1.],[1., 1., 1., 1.],[1., 1., 1., 1.]],[[1., 1., 1., 1.],[1., 1., 1., 1.],[1., 1., 1., 1.]]])
基本數學運算
# 創建數組
a = np.arange(15).reshape(3, 5) # 在 3 x 5 維中創建范圍為 0-14 的數組
b = np.zeros((3,5)) # 使用 0 創建數組
c = np.ones( (2,3,4), dtype=np.int16 ) # 使用 1 創建數組并定義數據類型
d = np.ones((3,5))
np.add(a,b) # 加法
array([[ 0., 1., 2., 3., 4.],[ 5., 6., 7., 8., 9.],[10., 11., 12., 13., 14.]])
np.subtract(a,b) # 減法
array([[ 0., 1., 2., 3., 4.],[ 5., 6., 7., 8., 9.],[10., 11., 12., 13., 14.]])
np.divide(a,d) # 除法
array([[ 0., 1., 2., 3., 4.],[ 5., 6., 7., 8., 9.],[10., 11., 12., 13., 14.]])
np.multiply(a,d) # 乘法
array([[ 0., 1., 2., 3., 4.],[ 5., 6., 7., 8., 9.],[10., 11., 12., 13., 14.]])
np.array_equal(a,b) # 對比 - 數組方式
False
聚合函數
# 創建數組
a = np.arange(15).reshape(3, 5) # 在 3 x 5 維中創建范圍為 0-14 的數組
b = np.zeros((3,5)) # 使用 0 創建數組
c = np.ones( (2,3,4), dtype=np.int16 ) # 使用 1 創建數組并定義數據類型
d = np.ones((3,5))
a.sum() # 按數組求和
105
a.min() # 數組最小值
0
a.mean() # 數組平均值
7.0
a.max(axis=0) # 數組行的最大值
array([10, 11, 12, 13, 14])
np.std(a) # 標準差
4.320493798938574
子集、切片和索引
# 創建數組
a = np.arange(15).reshape(3, 5) # 在 3 x 5 維中創建范圍為 0-14 的數組
b = np.zeros((3,5)) # 使用 0 創建數組
c = np.ones( (2,3,4), dtype=np.int16 ) # 使用 1 創建數組并定義數據類型
d = np.ones((3,5))
a[1,2] # 選擇第 1 行、第 2 列的元素
7
a[0:2] # 選擇索引 0 和 1 上的項目
array([[0, 1, 2, 3, 4],[5, 6, 7, 8, 9]])
a[:1] # 選擇第 0 行的所有項目
array([[0, 1, 2, 3, 4]])
a[-1:] # 選擇最后一行的所有項目
array([[10, 11, 12, 13, 14]])
a[a<2] # 從 'a' 中選擇小于 2 的元素
array([0, 1])
數組處理
# 創建數組
a = np.arange(15).reshape(3, 5) # 在 3 x 5 維中創建范圍為 0-14 的數組
b = np.zeros((3,5)) # 使用 0 創建數組
c = np.ones( (2,3,4), dtype=np.int16 ) # 使用 1 創建數組并定義數據類型
d = np.ones((3,5))
np.transpose(a) # 轉置數組 'a'
array([[ 0, 5, 10],[ 1, 6, 11],[ 2, 7, 12],[ 3, 8, 13],[ 4, 9, 14]])
a.ravel() # 展平數組
array([ 0, 1, 2, 3, 4, 5, 6, 7, 8, 9, 10, 11, 12, 13, 14])
a.reshape(5,-2) # 重整但不更改數據
array([[ 0, 1, 2],[ 3, 4, 5],[ 6, 7, 8],[ 9, 10, 11],[12, 13, 14]])
np.append(a,b) # 將項目追加到數組
array([ 0., 1., 2., 3., 4., 5., 6., 7., 8., 9., 10., 11., 12.,13., 14., 0., 0., 0., 0., 0., 0., 0., 0., 0., 0., 0.,0., 0., 0., 0.])
np.concatenate((a,d), axis=0) # 連結數組
array([[ 0., 1., 2., 3., 4.],[ 5., 6., 7., 8., 9.],[10., 11., 12., 13., 14.],[ 1., 1., 1., 1., 1.],[ 1., 1., 1., 1., 1.],[ 1., 1., 1., 1., 1.]])
np.vsplit(a,3) # 在第 3 個索引處垂直拆分數組
[array([[0, 1, 2, 3, 4]]),array([[5, 6, 7, 8, 9]]),array([[10, 11, 12, 13, 14]])]
np.hsplit(a,5) # 在第 5 個索引處水平拆分數組
[array([[ 0],[ 5],[10]]),array([[ 1],[ 6],[11]]),array([[ 2],[ 7],[12]]),array([[ 3],[ 8],[13]]),array([[ 4],[ 9],[14]])]
Pandas
Pandas 是 BSD 許可的開源代碼庫,為 Python 編程語言提供了高性能、易于使用的數據結構和數據分析工具。
Pandas DataFrame 是 Python 中復雜數據集合在內存中使用最廣泛的表示形式。
# 使用 pip 安裝 pandas、xlrd 和 openpyxl
!pip install pandas
!pip install xlrd openpyxl
Requirement already satisfied: pandas in /home/ec2-user/anaconda3/envs/python3/lib/python3.10/site-packages (2.2.1)
Requirement already satisfied: numpy<2,>=1.22.4 in /home/ec2-user/anaconda3/envs/python3/lib/python3.10/site-packages (from pandas) (1.22.4)
Requirement already satisfied: python-dateutil>=2.8.2 in /home/ec2-user/anaconda3/envs/python3/lib/python3.10/site-packages (from pandas) (2.9.0)
Requirement already satisfied: pytz>=2020.1 in /home/ec2-user/anaconda3/envs/python3/lib/python3.10/site-packages (from pandas) (2024.1)
Requirement already satisfied: tzdata>=2022.7 in /home/ec2-user/anaconda3/envs/python3/lib/python3.10/site-packages (from pandas) (2024.1)
Requirement already satisfied: six>=1.5 in /home/ec2-user/anaconda3/envs/python3/lib/python3.10/site-packages (from python-dateutil>=2.8.2->pandas) (1.16.0)
Collecting xlrdDownloading xlrd-2.0.1-py2.py3-none-any.whl.metadata (3.4 kB)
Requirement already satisfied: openpyxl in /home/ec2-user/anaconda3/envs/python3/lib/python3.10/site-packages (3.1.2)
Requirement already satisfied: et-xmlfile in /home/ec2-user/anaconda3/envs/python3/lib/python3.10/site-packages (from openpyxl) (1.1.0)
Downloading xlrd-2.0.1-py2.py3-none-any.whl (96 kB)
[2K   [90m━━━━━━━━━━━━━━━━━━━━━━━━━━━━━━━━━━━━━━━━[0m [32m96.5/96.5 kB[0m [31m11.2 MB/s[0m eta [36m0:00:00[0m
[?25hInstalling collected packages: xlrd
Successfully installed xlrd-2.0.1
# 導入 NumPy 和 Pandas 模塊
import numpy as np
import pandas as pd
# 示例 dataframe df
df = pd.DataFrame({'num_legs': [2, 4, np.nan, 0],'num_wings': [2, 0, 0, 0],'num_specimen_seen': [10, np.nan, 1, 8]},index=['falcon', 'dog', 'spider', 'fish'])
df # 顯示 dataframe df
| num_legs | num_wings | num_specimen_seen | |
|---|---|---|---|
| falcon | 2.0 | 2 | 10.0 |
| dog | 4.0 | 0 | NaN |
| spider | NaN | 0 | 1.0 |
| fish | 0.0 | 0 | 8.0 |
# 另一個示例 dataframe df1 - 使用帶有日期時間索引和標記列的 NumPy 數組
df1 = pd.date_range('20130101', periods=6)
df1 = pd.DataFrame(np.random.randn(6, 4), index=df1, columns=list('ABCD'))
df1 # 顯示 dataframe df1
| A | B | C | D | |
|---|---|---|---|---|
| 2013-01-01 | 0.455005 | 2.047280 | 0.260058 | -1.068430 |
| 2013-01-02 | -1.903830 | 0.521249 | 0.906778 | 2.358446 |
| 2013-01-03 | 0.036278 | 0.237705 | -0.836402 | -0.142862 |
| 2013-01-04 | 1.302199 | 2.130269 | -0.467286 | -0.739326 |
| 2013-01-05 | 0.924034 | 0.413690 | 1.122296 | -1.917679 |
| 2013-01-06 | -1.428025 | 1.277279 | 0.164601 | 1.313498 |
查看數據
df1 = pd.date_range('20130101', periods=6)
df1 = pd.DataFrame(np.random.randn(6, 4), index=df1, columns=list('ABCD'))
df1.head(2) # 查看頂部數據
| A | B | C | D | |
|---|---|---|---|---|
| 2013-01-01 | 0.910131 | 0.857031 | 1.324397 | 0.768240 |
| 2013-01-02 | -1.193712 | 0.598527 | -0.654860 | -1.528201 |
df1.tail(2) # 查看底部數據
| A | B | C | D | |
|---|---|---|---|---|
| 2013-01-05 | 1.009387 | -0.695923 | -1.254239 | 0.374314 |
| 2013-01-06 | -0.622698 | 0.959586 | 0.351294 | 1.240811 |
df1.index # 顯示索引列
DatetimeIndex(['2013-01-01', '2013-01-02', '2013-01-03', '2013-01-04','2013-01-05', '2013-01-06'],dtype='datetime64[ns]', freq='D')
df1.dtypes # 檢查數據類型
A    float64
B    float64
C    float64
D    float64
dtype: object
df1.describe() # 顯示數據的快速統計摘要
| A | B | C | D | |
|---|---|---|---|---|
| count | 6.000000 | 6.000000 | 6.000000 | 6.000000 |
| mean | -0.432193 | 0.637821 | -0.158000 | 0.080423 |
| std | 1.151799 | 0.769916 | 0.905303 | 0.973543 |
| min | -1.827255 | -0.695923 | -1.254239 | -1.528201 |
| 25% | -1.112537 | 0.500875 | -0.639878 | -0.299781 |
| 50% | -0.745856 | 0.727779 | -0.357296 | 0.207468 |
| 75% | 0.526924 | 0.933948 | 0.233554 | 0.669758 |
| max | 1.009387 | 1.639382 | 1.324397 | 1.240811 |
子集、切片和索引
df1 = pd.date_range('20130101', periods=6)
df1 = pd.DataFrame(np.random.randn(6, 4), index=df1, columns=list('ABCD'))
df1.T # 置換數據
| 2013-01-01 | 2013-01-02 | 2013-01-03 | 2013-01-04 | 2013-01-05 | 2013-01-06 | |
|---|---|---|---|---|---|---|
| A | 0.339706 | -0.033353 | -0.469912 | 0.683896 | -0.119535 | -0.391874 |
| B | -1.271134 | 1.160861 | 0.594625 | -0.355716 | -1.718980 | -1.546150 |
| C | 0.631270 | 0.525860 | 0.173641 | -1.885387 | -2.915834 | -0.781985 |
| D | 0.674431 | -0.274830 | 0.630307 | 1.132642 | 0.021696 | 1.299410 |
df1.sort_index(axis=1, ascending=False) # 按軸排序
| D | C | B | A | |
|---|---|---|---|---|
| 2013-01-01 | 0.674431 | 0.631270 | -1.271134 | 0.339706 |
| 2013-01-02 | -0.274830 | 0.525860 | 1.160861 | -0.033353 |
| 2013-01-03 | 0.630307 | 0.173641 | 0.594625 | -0.469912 |
| 2013-01-04 | 1.132642 | -1.885387 | -0.355716 | 0.683896 |
| 2013-01-05 | 0.021696 | -2.915834 | -1.718980 | -0.119535 |
| 2013-01-06 | 1.299410 | -0.781985 | -1.546150 | -0.391874 |
df1.sort_values(by='B') # 按值排序
| A | B | C | D | |
|---|---|---|---|---|
| 2013-01-05 | -0.119535 | -1.718980 | -2.915834 | 0.021696 |
| 2013-01-06 | -0.391874 | -1.546150 | -0.781985 | 1.299410 |
| 2013-01-01 | 0.339706 | -1.271134 | 0.631270 | 0.674431 |
| 2013-01-04 | 0.683896 | -0.355716 | -1.885387 | 1.132642 |
| 2013-01-03 | -0.469912 | 0.594625 | 0.173641 | 0.630307 |
| 2013-01-02 | -0.033353 | 1.160861 | 0.525860 | -0.274830 |
df1['A'] # 選擇列 A
2013-01-01    0.339706
2013-01-02   -0.033353
2013-01-03   -0.469912
2013-01-04    0.683896
2013-01-05   -0.119535
2013-01-06   -0.391874
Freq: D, Name: A, dtype: float64
df1[0:3] # 選擇索引 0 到 2
| A | B | C | D | |
|---|---|---|---|---|
| 2013-01-01 | 0.339706 | -1.271134 | 0.631270 | 0.674431 |
| 2013-01-02 | -0.033353 | 1.160861 | 0.525860 | -0.274830 |
| 2013-01-03 | -0.469912 | 0.594625 | 0.173641 | 0.630307 |
df1['20130102':'20130104'] # 從匹配值的索引中選擇
| A | B | C | D | |
|---|---|---|---|---|
| 2013-01-02 | -0.033353 | 1.160861 | 0.525860 | -0.274830 |
| 2013-01-03 | -0.469912 | 0.594625 | 0.173641 | 0.630307 |
| 2013-01-04 | 0.683896 | -0.355716 | -1.885387 | 1.132642 |
df1.loc[:, ['A', 'B']] # 通過標簽在多軸上選擇
| A | B | |
|---|---|---|
| 2013-01-01 | 0.339706 | -1.271134 |
| 2013-01-02 | -0.033353 | 1.160861 |
| 2013-01-03 | -0.469912 | 0.594625 |
| 2013-01-04 | 0.683896 | -0.355716 |
| 2013-01-05 | -0.119535 | -1.718980 |
| 2013-01-06 | -0.391874 | -1.546150 |
df1.iloc[3] # 通過傳遞的整數的位置進行選擇
A    0.683896
B   -0.355716
C   -1.885387
D    1.132642
Name: 2013-01-04 00:00:00, dtype: float64
df1[df1 > 0] # 從滿足布爾運算條件的 DataFrame 中選擇值
| A | B | C | D | |
|---|---|---|---|---|
| 2013-01-01 | 0.339706 | NaN | 0.631270 | 0.674431 |
| 2013-01-02 | NaN | 1.160861 | 0.525860 | NaN |
| 2013-01-03 | NaN | 0.594625 | 0.173641 | 0.630307 |
| 2013-01-04 | 0.683896 | NaN | NaN | 1.132642 |
| 2013-01-05 | NaN | NaN | NaN | 0.021696 |
| 2013-01-06 | NaN | NaN | NaN | 1.299410 |
df2 = df1.copy() # 將 df1 數據集復制到 df2
df2['E'] = ['one', 'one', 'two', 'three', 'four', 'three'] # 添加帶有值的 E 列
df2[df2['E'].isin(['two', 'four'])] # 使用 isin 方法進行篩選
| A | B | C | D | E | |
|---|---|---|---|---|---|
| 2013-01-03 | -0.469912 | 0.594625 | 0.173641 | 0.630307 | two |
| 2013-01-05 | -0.119535 | -1.718980 | -2.915834 | 0.021696 | four |
數據缺失
Pandas 主要使用值 np.nan 來表示缺失數據。默認情況下,它不包括在計算中。
df = pd.DataFrame({'num_legs': [2, 4, np.nan, 0],'num_wings': [2, 0, 0, 0],'num_specimen_seen': [10, np.nan, 1, 8]},index=['falcon', 'dog', 'spider', 'fish'])
df.dropna(how='any') # 刪除所有缺失數據的行
| num_legs | num_wings | num_specimen_seen | |
|---|---|---|---|
| falcon | 2.0 | 2 | 10.0 |
| fish | 0.0 | 0 | 8.0 |
df.dropna(how='any', axis=1) # 刪除所有缺失數據的列
| num_wings | |
|---|---|
| falcon | 2 |
| dog | 0 |
| spider | 0 |
| fish | 0 |
df.fillna(value=5) # 用值 5 填充缺失的數據
| num_legs | num_wings | num_specimen_seen | |
|---|---|---|---|
| falcon | 2.0 | 2 | 10.0 |
| dog | 4.0 | 0 | 5.0 |
| spider | 5.0 | 0 | 1.0 |
| fish | 0.0 | 0 | 8.0 |
pd.isna(df) # 在缺失數據的位置獲取布爾掩碼
| num_legs | num_wings | num_specimen_seen | |
|---|---|---|---|
| falcon | False | False | False |
| dog | False | False | True |
| spider | True | False | False |
| fish | False | False | False |
文件處理
df = pd.DataFrame({'num_legs': [2, 4, np.nan, 0],'num_wings': [2, 0, 0, 0],'num_specimen_seen': [10, np.nan, 1, 8]},index=['falcon', 'dog', 'spider', 'fish'])
df.to_csv('foo.csv') # 寫入 CSV 文件
pd.read_csv('foo.csv') # 從 CSV 文件中讀取
| Unnamed: 0 | num_legs | num_wings | num_specimen_seen | |
|---|---|---|---|---|
| 0 | falcon | 2.0 | 2 | 10.0 |
| 1 | dog | 4.0 | 0 | NaN |
| 2 | spider | NaN | 0 | 1.0 |
| 3 | fish | 0.0 | 0 | 8.0 |
df.to_excel('foo.xlsx', sheet_name='Sheet1') # 寫入 Microsoft Excel 文件
pd.read_excel('foo.xlsx', 'Sheet1', index_col=None, na_values=['NA']) # 從 Microsoft Excel 文件中讀取
| Unnamed: 0 | num_legs | num_wings | num_specimen_seen | |
|---|---|---|---|---|
| 0 | falcon | 2.0 | 2 | 10.0 |
| 1 | dog | 4.0 | 0 | NaN |
| 2 | spider | NaN | 0 | 1.0 |
| 3 | fish | 0.0 | 0 | 8.0 |
繪圖
# 使用 pip 安裝 Matplotlib
!pip install matplotlib
Requirement already satisfied: matplotlib in /home/ec2-user/anaconda3/envs/python3/lib/python3.10/site-packages (3.8.3)
Requirement already satisfied: contourpy>=1.0.1 in /home/ec2-user/anaconda3/envs/python3/lib/python3.10/site-packages (from matplotlib) (1.2.0)
Requirement already satisfied: cycler>=0.10 in /home/ec2-user/anaconda3/envs/python3/lib/python3.10/site-packages (from matplotlib) (0.12.1)
Requirement already satisfied: fonttools>=4.22.0 in /home/ec2-user/anaconda3/envs/python3/lib/python3.10/site-packages (from matplotlib) (4.50.0)
Requirement already satisfied: kiwisolver>=1.3.1 in /home/ec2-user/anaconda3/envs/python3/lib/python3.10/site-packages (from matplotlib) (1.4.5)
Requirement already satisfied: numpy<2,>=1.21 in /home/ec2-user/anaconda3/envs/python3/lib/python3.10/site-packages (from matplotlib) (1.22.4)
Requirement already satisfied: packaging>=20.0 in /home/ec2-user/anaconda3/envs/python3/lib/python3.10/site-packages (from matplotlib) (21.3)
Requirement already satisfied: pillow>=8 in /home/ec2-user/anaconda3/envs/python3/lib/python3.10/site-packages (from matplotlib) (10.2.0)
Requirement already satisfied: pyparsing>=2.3.1 in /home/ec2-user/anaconda3/envs/python3/lib/python3.10/site-packages (from matplotlib) (3.1.2)
Requirement already satisfied: python-dateutil>=2.7 in /home/ec2-user/anaconda3/envs/python3/lib/python3.10/site-packages (from matplotlib) (2.9.0)
Requirement already satisfied: six>=1.5 in /home/ec2-user/anaconda3/envs/python3/lib/python3.10/site-packages (from python-dateutil>=2.7->matplotlib) (1.16.0)
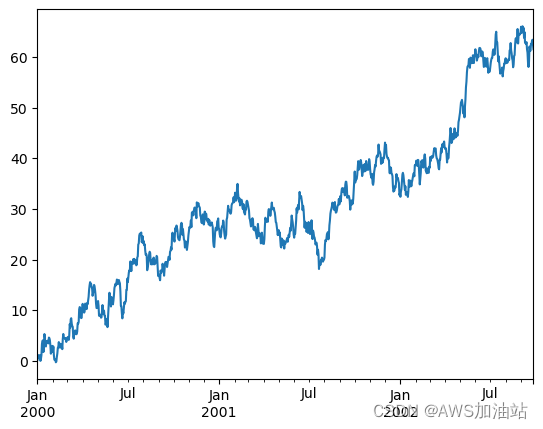
from matplotlib import pyplot as plt # 導入 Matplotlib 模塊
# 生成隨機時間序列數據
ts = pd.Series(np.random.randn(1000),index=pd.date_range('1/1/2000', periods=1000))
ts.head()
2000-01-01    0.273730
2000-01-02    0.934832
2000-01-03   -0.142245
2000-01-04   -0.499136
2000-01-05    0.169899
Freq: D, dtype: float64
ts = ts.cumsum()
ts.plot() # 繪制圖表
plt.show()
?
?
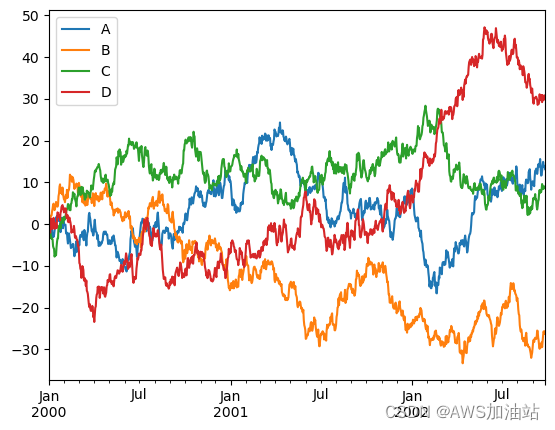
# 在 DataFrame 上,plot() 方法可以方便繪制帶有標簽的所有列
df4 = pd.DataFrame(np.random.randn(1000, 4), index=ts.index,columns=['A', 'B', 'C', 'D'])
df4 = df4.cumsum()
df4.head()
| A | B | C | D | |
|---|---|---|---|---|
| 2000-01-01 | -0.847755 | 1.239531 | -0.760856 | 0.668182 |
| 2000-01-02 | -1.191067 | 1.930612 | -2.587667 | 0.075473 |
| 2000-01-03 | -1.353704 | 1.815771 | -1.788468 | -2.039681 |
| 2000-01-04 | -2.338159 | 1.734058 | -2.269514 | -0.756332 |
| 2000-01-05 | -2.835570 | 2.067088 | -3.396366 | 1.352672 |
df4.plot()
plt.show()
?
?


)


)

:二叉樹的使用)
)

-- 系統異步化)

