題目?:
- 從Kaggle的“House Prices - Advanced Regression Techniques”數據集
- 使用Pandas讀取數據,并查看數據的基本信息。
- 選擇一些你認為對房屋價格有重要影響的特征,并進行數據預處理(如缺失值處理、異常值處理等)。
- 使用matplotlib繪制特征與目標變量(房屋價格)之間的散點圖或箱線圖,觀察它們之間的關系。
- 將數據分為訓練集和測試集。
- 使用numpy或scikit-learn搭建一個線性回歸模型,并在訓練集上進行訓練。
- 在測試集上評估模型的性能,并計算均方誤差(MSE)或均方根誤差(RMSE)。
- 嘗試使用不同的特征組合或進行特征選擇,觀察模型性能的變化。
import pandas as pd
import matplotlib.pyplot as plt
import numpy as np
from sklearn.model_selection import train_test_split
from sklearn.preprocessing import StandardScaler
from sklearn.linear_model import LinearRegression# 中文顯示
plt.rcParams['font.sans-serif'] = ['SimHei']
plt.rcParams['axes.unicode_minus'] = False# 使用Pandas讀取數據,并查看數據的基本信息。
data = pd.read_csv('./train.csv')
print(data.head())# 選擇一些你認為對房屋價格有重要影響的特征,并進行數據預處理(如缺失值處理、異常值處理等)。
# 判斷是否有缺失值
print(data.isnull().sum())
# 使用中位數填充缺失值
data['LotFrontage'] = data['LotFrontage'].fillna(data['LotFrontage'].median())
data['MasVnrArea'] = data['MasVnrArea'].fillna(data['MasVnrArea'].median())
data['GarageYrBlt'] = data['GarageYrBlt'].fillna(data['GarageYrBlt'].median())
# 異常值處理
data = data[data['SalePrice'] < 500000]# 使用matplotlib繪制特征與目標變量(房屋價格)之間的散點圖或箱線圖,觀察它們之間的關系。
plt.scatter(data['GrLivArea'], data['SalePrice'], alpha=0.5)
plt.title('住房面積與房價的關系')
plt.xlabel('住房面積')
plt.ylabel('房價')
plt.show()# 選擇數值型特征
numeric_features = data.select_dtypes(include=[np.number]).columns.tolist()
numeric_features.remove('SalePrice')  # 移除目標變量# 將數據分為訓練集和測試集。
x = data[numeric_features]  # 只使用數值型特征
y = data['SalePrice']# 特征工程(標準化)
transfer = StandardScaler()
# 將數值型特征進行標準化
x = transfer.fit_transform(x)# 使用scikit-learn搭建一個線性回歸模型,并在訓練集上進行訓練。
x_train, x_test, y_train, y_test = train_test_split(x, y, test_size=0.2, random_state=42)
model = LinearRegression()
model.fit(x_train, y_train)# 在測試集上評估模型的性能,并計算均方誤差(MSE)或均方根誤差(RMSE)。
y_predict = model.predict(x_test)
mse = np.mean((y_predict - y_test) ** 2)
rmse = np.sqrt(mse)
print(f"均方誤差(MSE):{mse}")
print(f"均方根誤差(RMSE):{rmse}")plt.show()
Pytorch) c:\Users\Wennight531\Desktop\機器學習\day6>D:/Anaconda/envs/Pytorch/python.exe c:/Users/Wennight531/Desktop/機器學習/day6/House_prices.pyId MSSubClass MSZoning LotFrontage LotArea Street Alley ... MiscFeature MiscVal MoSold YrSold SaleType SaleCondition SalePrice
0 1 60 RL 65.0 8450 Pave NaN ... NaN 0 2 2008 WD Normal 208500
1 2 20 RL 80.0 9600 Pave NaN ... NaN 0 5 2007 WD Normal 181500
2 3 60 RL 68.0 11250 Pave NaN ... NaN 0 9 2008 WD Normal 223500
3 4 70 RL 60.0 9550 Pave NaN ... NaN 0 2 2006 WD Abnorml 140000
4 5 60 RL 84.0 14260 Pave NaN ... NaN 0 12 2008 WD Normal 250000 [5 rows x 81 columns]
Id 0
MSSubClass 0
MSZoning 0
LotFrontage 259
LotArea 0...
MoSold 0
YrSold 0
SaleType 0
SaleCondition 0
SalePrice 0
Length: 81, dtype: int64
均方誤差(MSE):784419750.0907469
均方根誤差(RMSE):28007.494534333964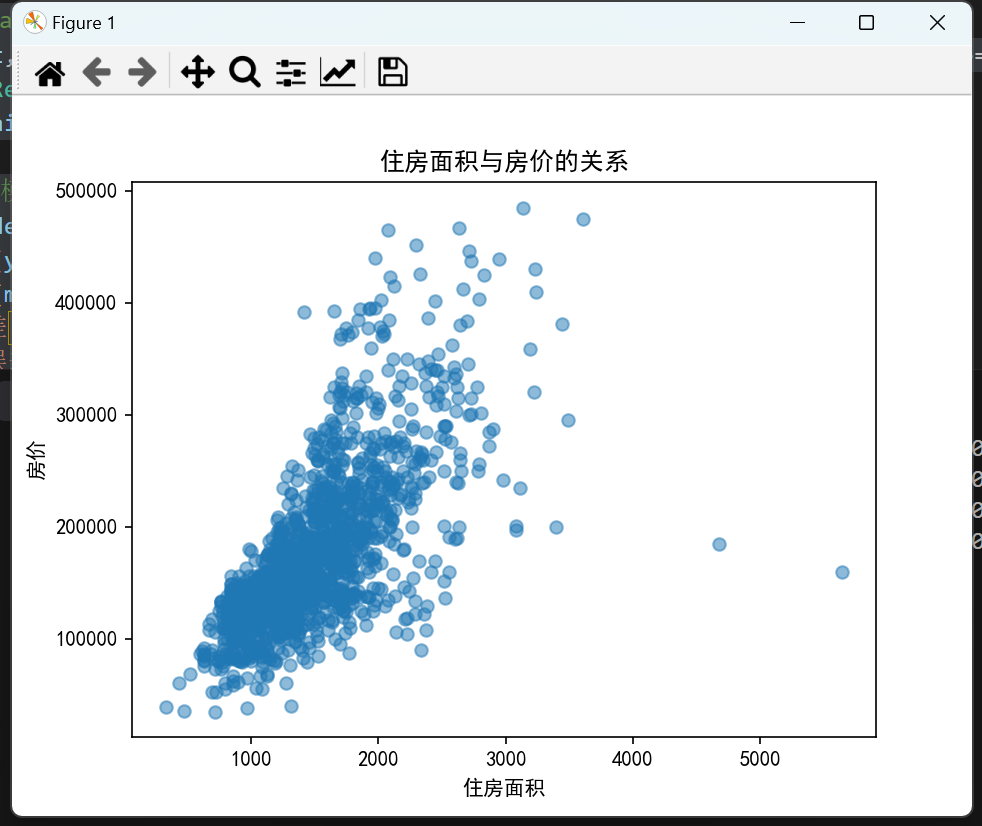
:數據一致性)
實例應用講解)


)


)


