MNIST數據集上樸素貝葉斯分類器
Naive Bayes Classification
fitcnb
Train multiclass naive Bayes model
Syntax
Mdl = fitcnb(Tbl,ResponseVarName)
Mdl = fitcnb(Tbl,formula)
Mdl = fitcnb(Tbl,Y)
Mdl = fitcnb(X,Y)
Mdl = fitcnb(___,Name,Value)
[Mdl,AggregateOptimizationResults] = fitcnb(___)
Normal (Gaussian) Distribution
The ‘normal’ distribution (specify using ‘normal’ ) is appropriate for predictors that have normal distributions in each class. For each predictor you model with a normal distribution, the naive Bayes classifier estimates a separate normal distribution for each class by computing the mean and standard deviation of the training data in that class.
Kernel Distribution
The ‘kernel’ distribution (specify using ‘kernel’) is appropriate for predictors that have a continuous distribution. It does not require a strong assumption such as a normal distribution and you can use it in cases where the distribution of a predictor may be skewed or have multiple peaks or modes. It requires more computing time and more memory than the normal distribution. For each predictor you model with a kernel distribution, the naive Bayes classifier computes a separate kernel density estimate for each class based on the training data for that class. By default the kernel is the normal kernel, and the classifier selects a width automatically for each class and predictor. The software supports specifying different kernels for each predictor, and different widths for each predictor or class.
DistributionNames — fitcnb searches among 'normal' and 'kernel'.
Kernel — fitcnb searches among 'normal', 'box', 'epanechnikov', and 'triangle'.
使用pca作為降維,pca是一種非監督的線性降維方法。方差貢獻率作為參數。
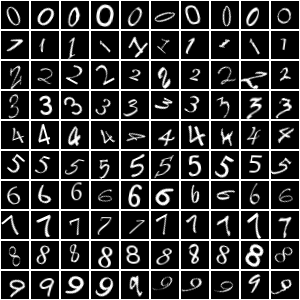
10000個樣本的樣本集
Label    Count
_____    _____0      1000 1      1000 2      1000 3      1000 4      1000 5      1000 6      1000 7      1000 8      1000 9      1000
%%
filename = 'mnist';
digitDatasetPath = fullfile(matlabroot,'toolbox','nnet','nndemos', ...'nndatasets','DigitDataset');
imds = imageDatastore(digitDatasetPath, ...'IncludeSubfolders',true,'LabelSource','foldernames');
%%
labelCount = countEachLabel(imds);
%%
Y = imds.Labels;
for i = 1:sum(labelCount.Count)img = im2double(readimage(imds,i));imgs(:,i) = img(:);
end%%
[coeff,score,latent,tsquared,explained,mu] = pca(imgs');
% figure;plot(explained)
%%
idx = explained > 0.05;
X = score(:,idx);%%
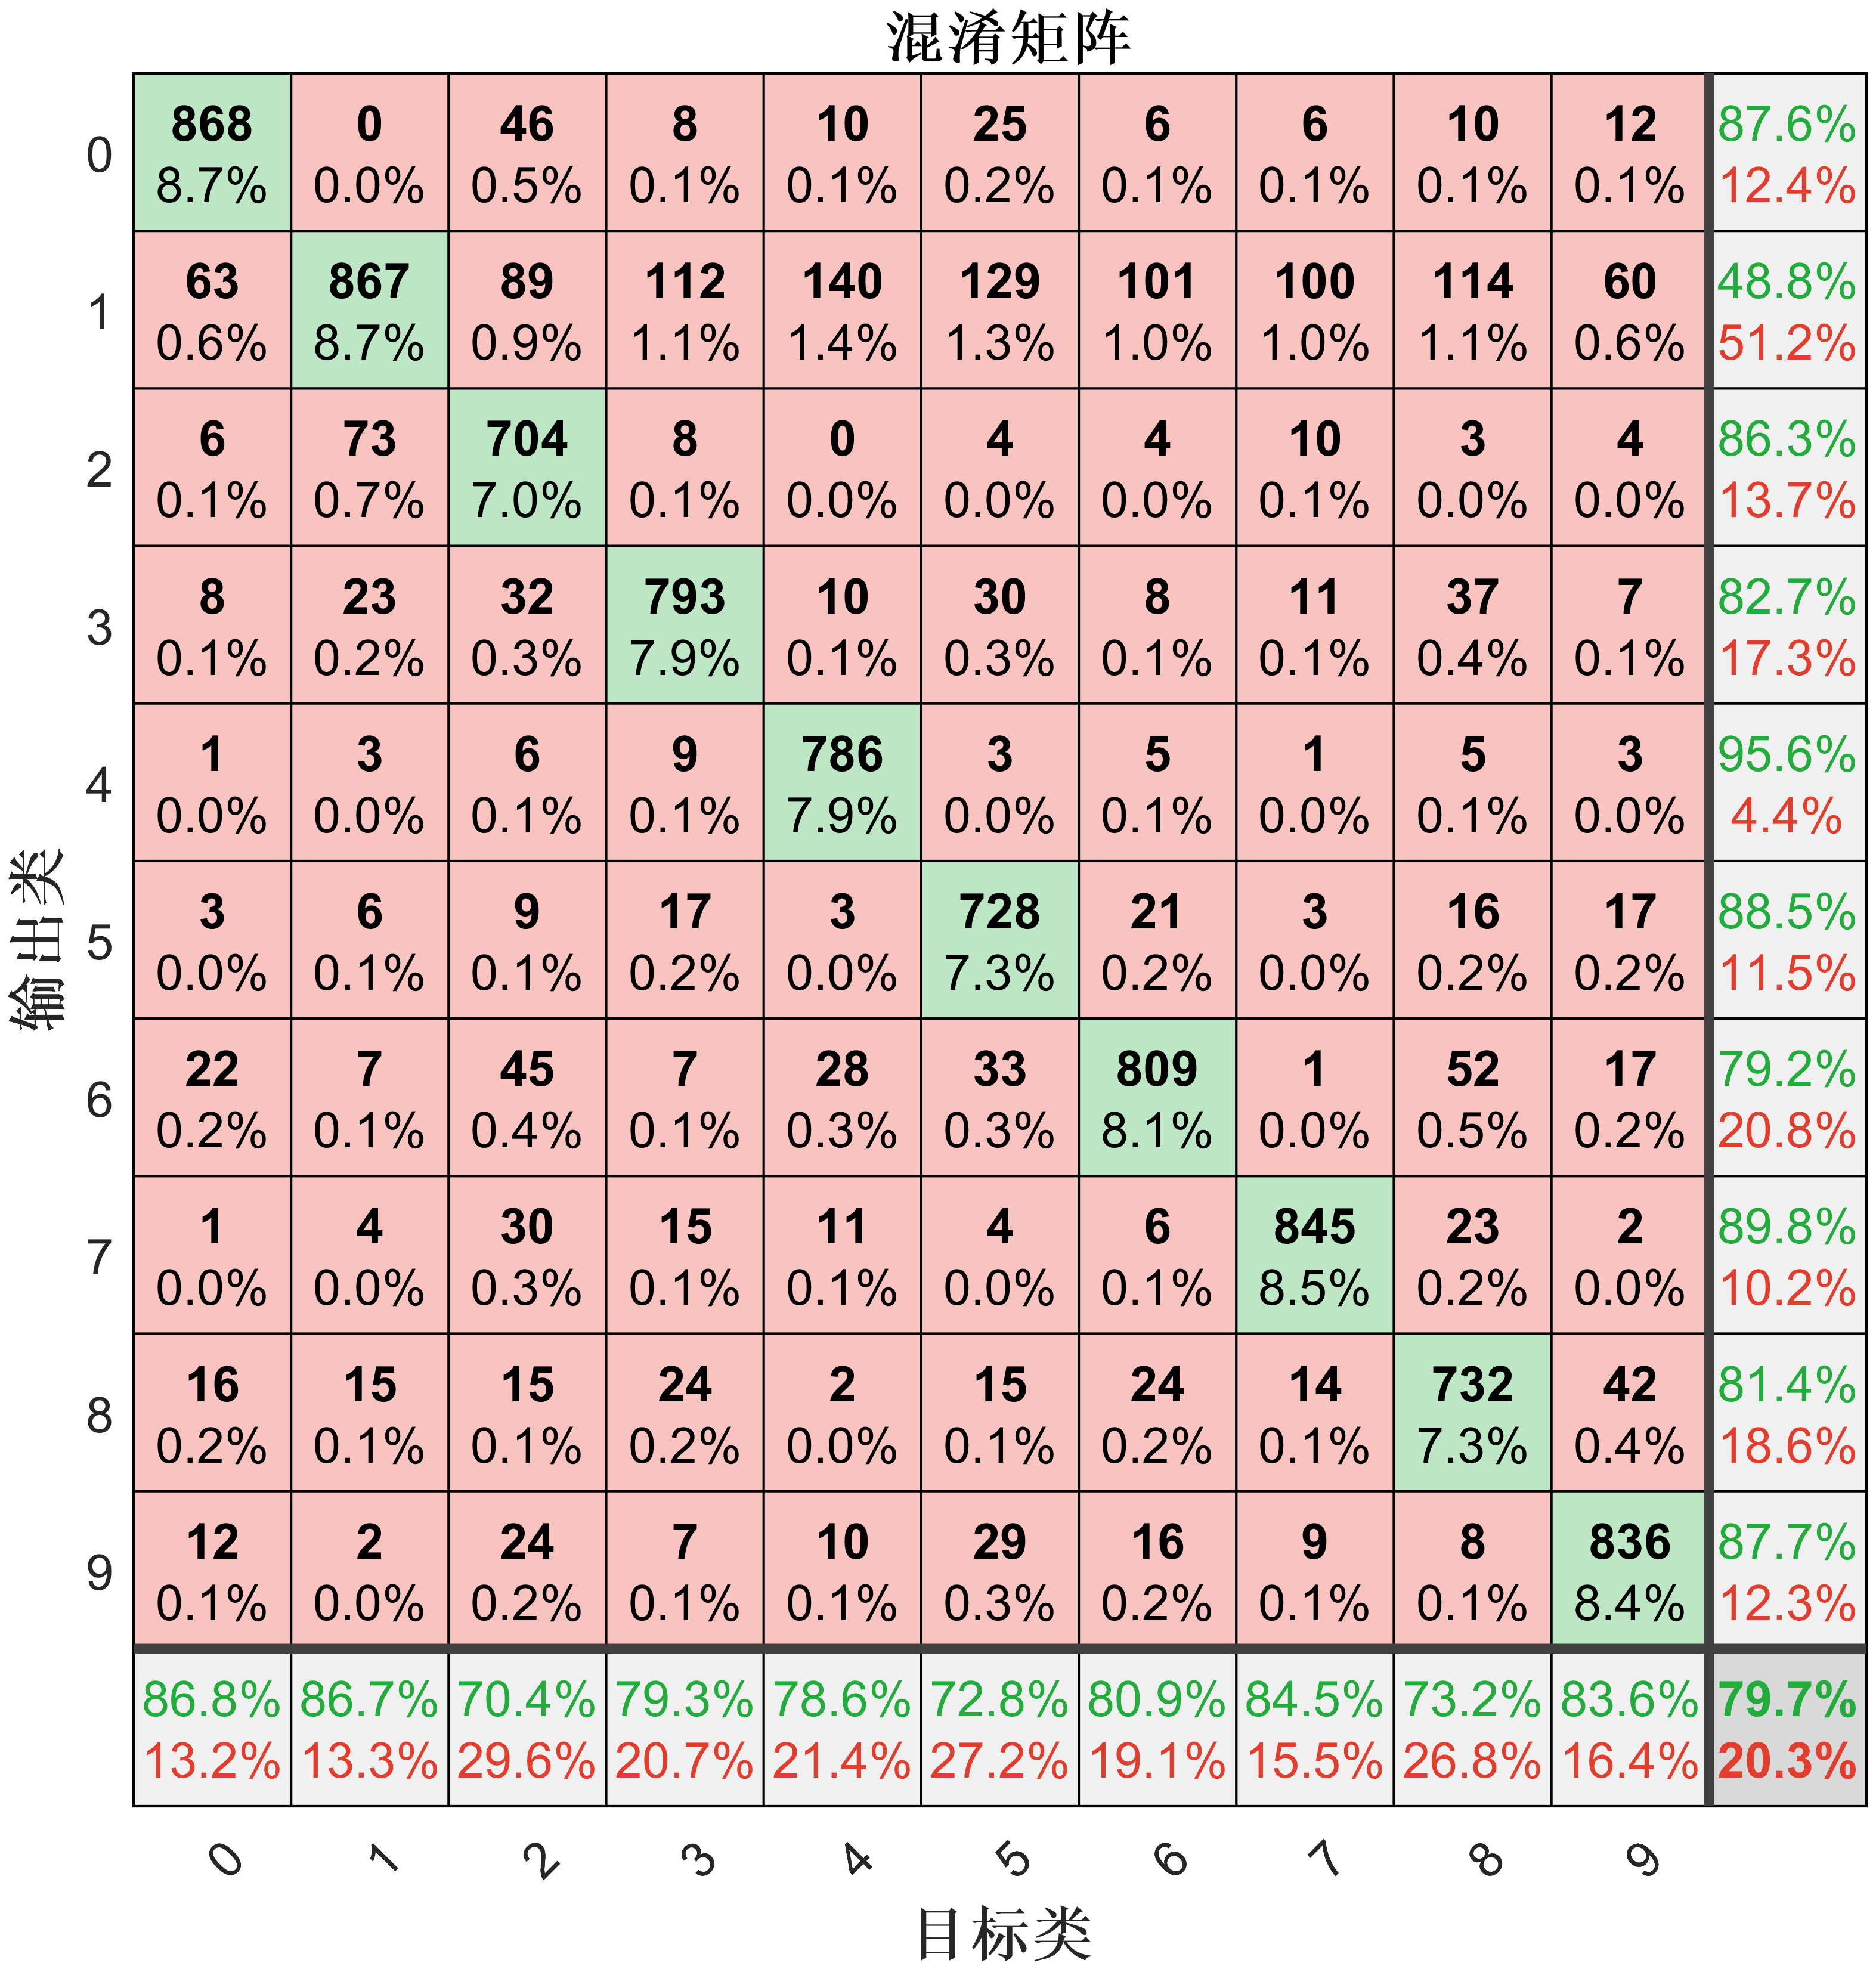
DistributionNames = 'kernel';
Mdl = fitcnb(X,Y,"DistributionNames",DistributionNames);
isLabels = resubPredict(Mdl);
%%
filename = 'mnist';
digitDatasetPath = fullfile(matlabroot,'toolbox','nnet','nndemos', ...'nndatasets','DigitDataset');
imds = imageDatastore(digitDatasetPath, ...'IncludeSubfolders',true,'LabelSource','foldernames');
%%
labelCount = countEachLabel(imds);
%%
Y = imds.Labels;
for i = 1:sum(labelCount.Count)img = im2double(readimage(imds,i));imgs(:,i) = img(:);
end%%
[coeff,score,latent,tsquared,explained,mu] = pca(imgs');
% figure;plot(explained)
%%
idx = explained > 0.05;
X = score(:,idx);%%
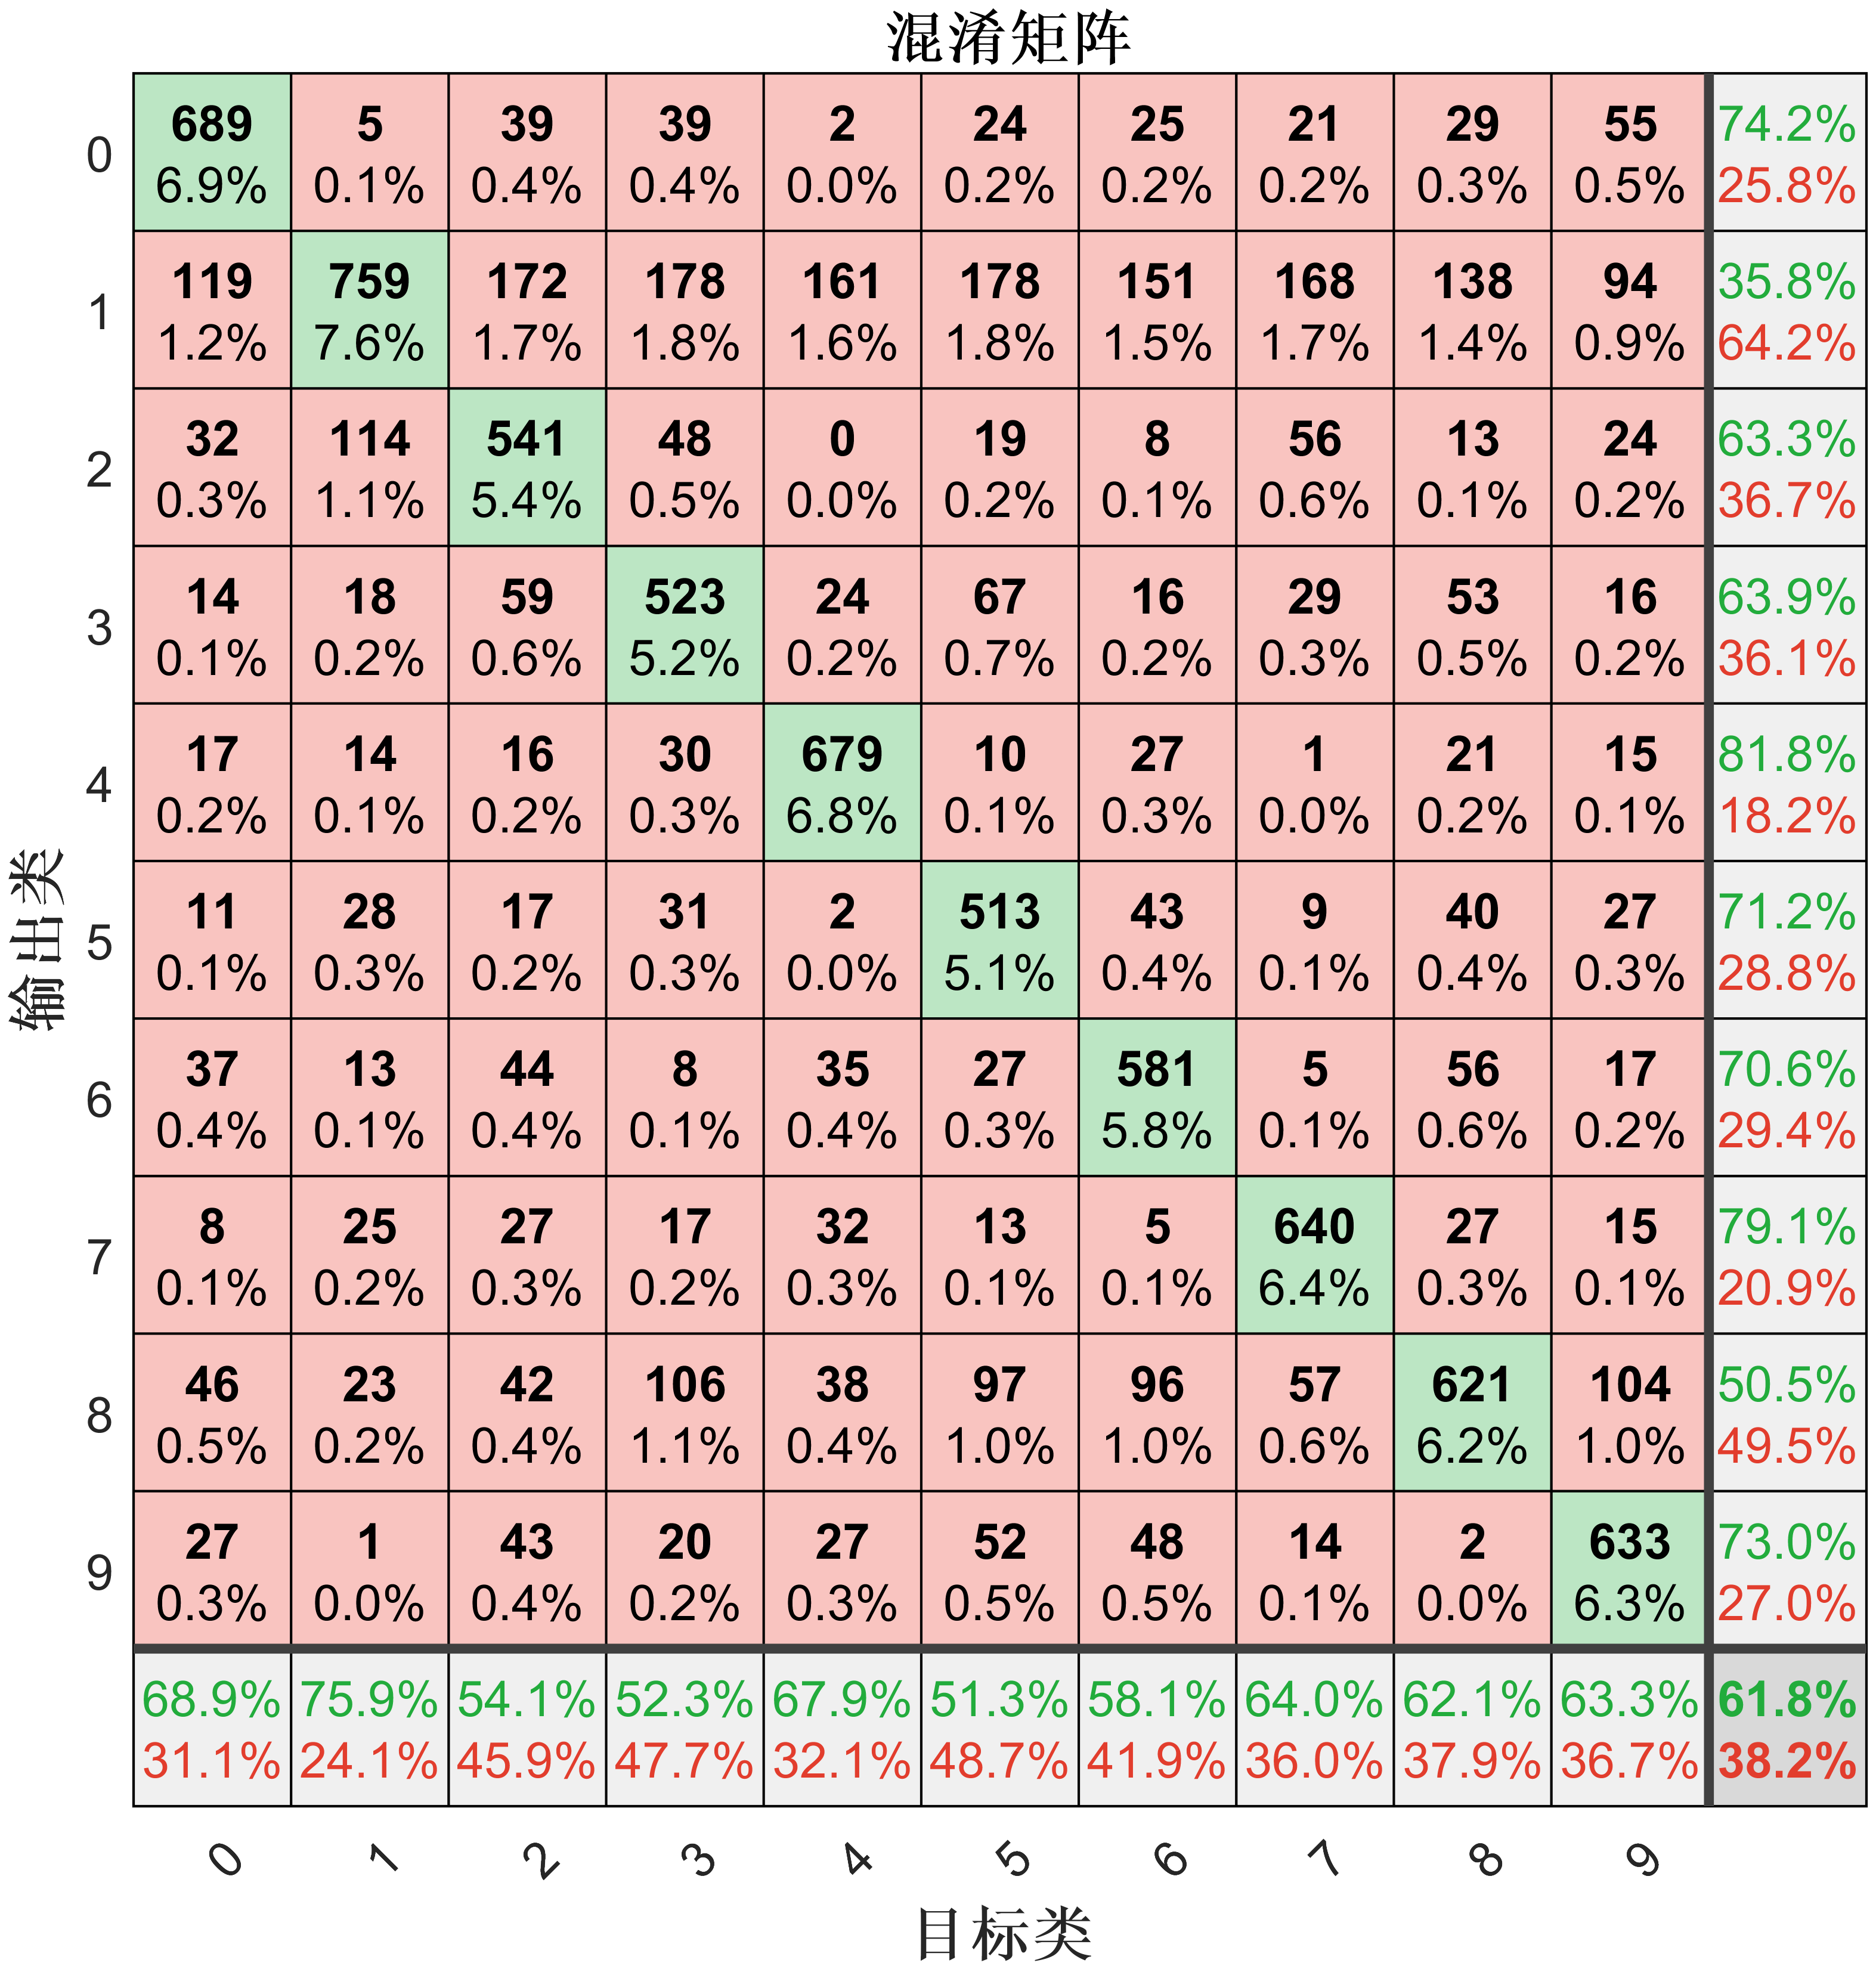
DistributionNames = 'normal';
Mdl = fitcnb(X,Y,"DistributionNames",DistributionNames);
isLabels = resubPredict(Mdl);


)

)
)


使用)

- 本地部署(后端 1.2版本))

![[技術積累]成熟的前端和后端開發框架](http://pic.xiahunao.cn/[技術積累]成熟的前端和后端開發框架)