一、jupyter和pyecharts下載和打開
因為我是用的pycharm,所以我直接在pycharm項目終端中下載pip install jupyter,pip install pyecharts
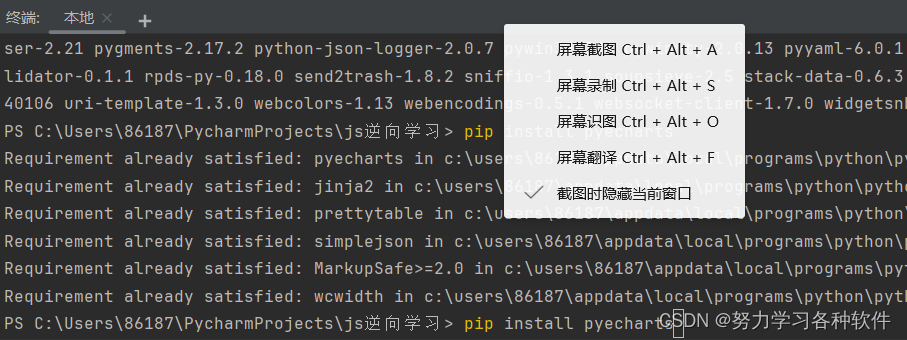
在你下載的項目路徑中輸入jupyter notebook
 ?
?
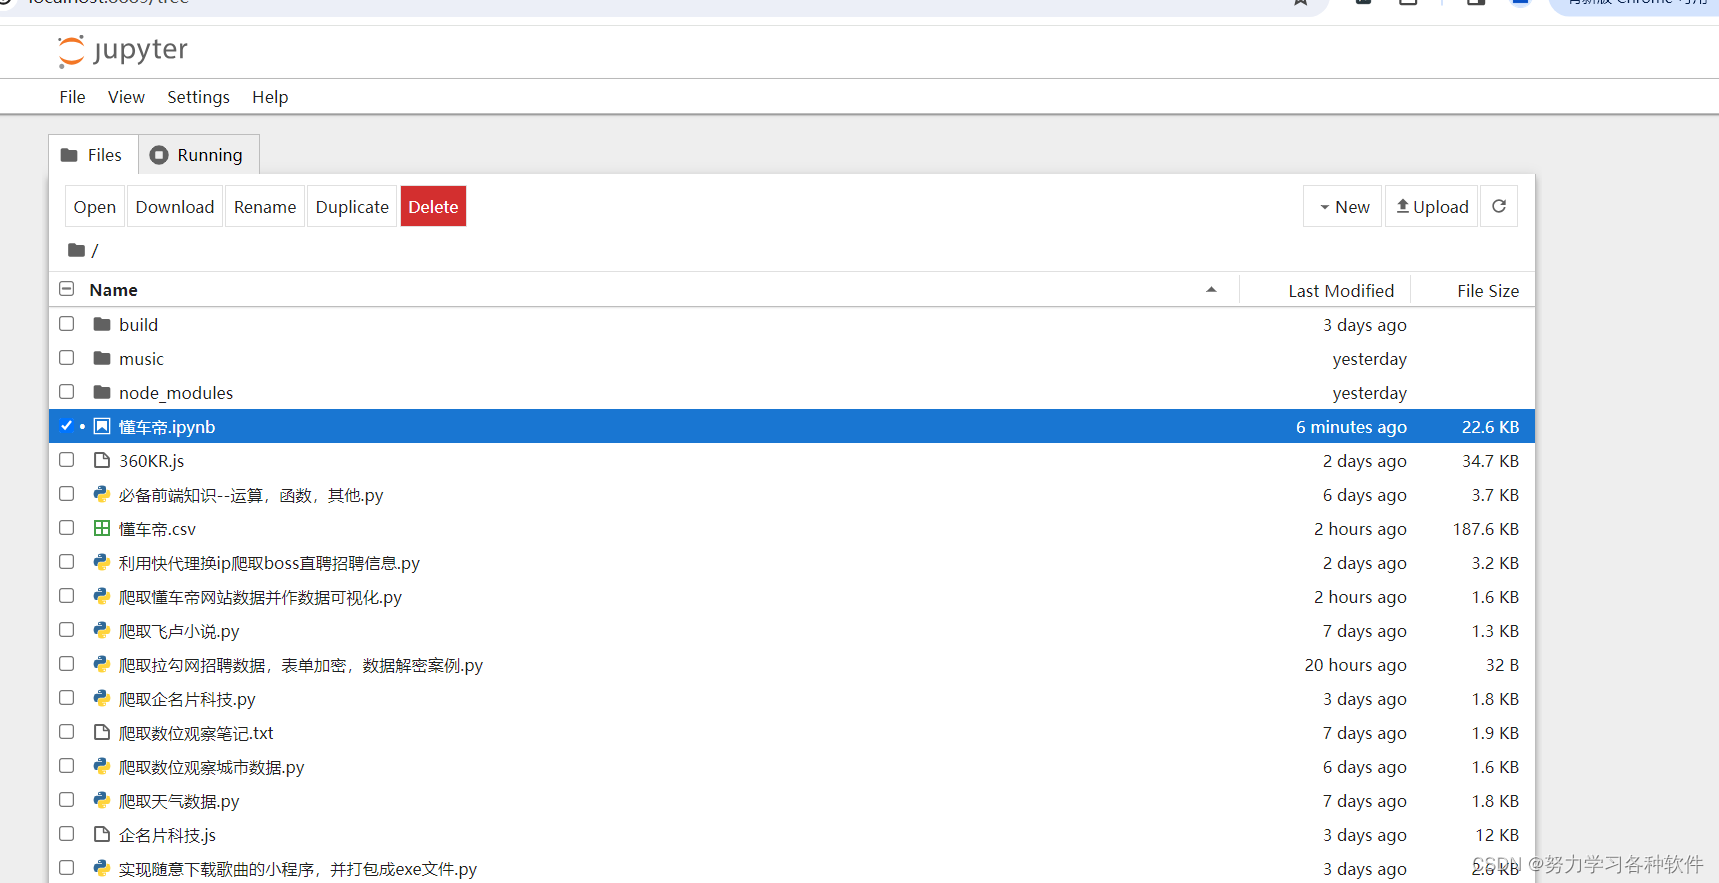
之后會進入頁面
 ?
?
Jupyter 具體使用參考這個鏈接:Jupyter Notebook基本使用_jupyter notebook有哪些優點和缺點?-CSDN博客?
二、jupyter 利用pyecharts常見問題
?最常見的問題是不出圖
解決方法:
在導入包時候,導入下面的代碼:
from pyecharts.globals import CurrentConfig,NotebookType
CurrentConfig.NOTEBOOK_TYPE = NotebookType.JUPYTER_LAB
接著寫代碼
?
一定要另起一行寫展示代碼
 ?
?
?
三、爬取懂車帝數據并進行數據分析詳細代碼
爬蟲代碼:
import csv
import requests
f = open('懂車帝.csv',mode='w',encoding='utf-8',newline='')
csv_writer = csv.writer(f)
csv_writer.writerow(['車輛名稱','系列名稱','品牌','城市','過戶次數','售價','官方指導價','年份','行駛里程','汽車源類型','認證'])headers = {"User-Agent":"Mozilla/5.0 (Windows NT 10.0; Win64; x64) AppleWebKit/537.36 (KHTML, like Gecko) Chrome/120.0.0.0 Safari/537.36"
}
url = 'https://www.dongchedi.com/motor/pc/sh/sh_sku_list?aid=1839&app_name=auto_web_pc'
for page in range(1,21):data = {'sh_city_name':' 全國','page': page,'limit': '20',}response = requests.post(url=url,json=data,headers=headers)json_data = response.json()['data']['search_sh_sku_info_list']print(f'正在打印第{page}頁數據')for item in json_data:car_name = item['car_name']series_name = item['series_name']brand_name = item['brand_name']car_source_city_name = item['car_source_city_name']transfer_cnt = item['transfer_cnt']sh_price = item['sh_price']official_price = item['official_price']productionTime = item['sub_title'].split('|')[0]car_source_type = item['car_source_type']authentication_method = item['authentication_method']try:mileage = item['sub_title'].split('|')[1]except:mileage = '無數據'csv_writer.writerow([car_name, series_name, brand_name, car_source_city_name, transfer_cnt, sh_price, official_price,productionTime, mileage, car_source_type, authentication_method])
分析代碼:
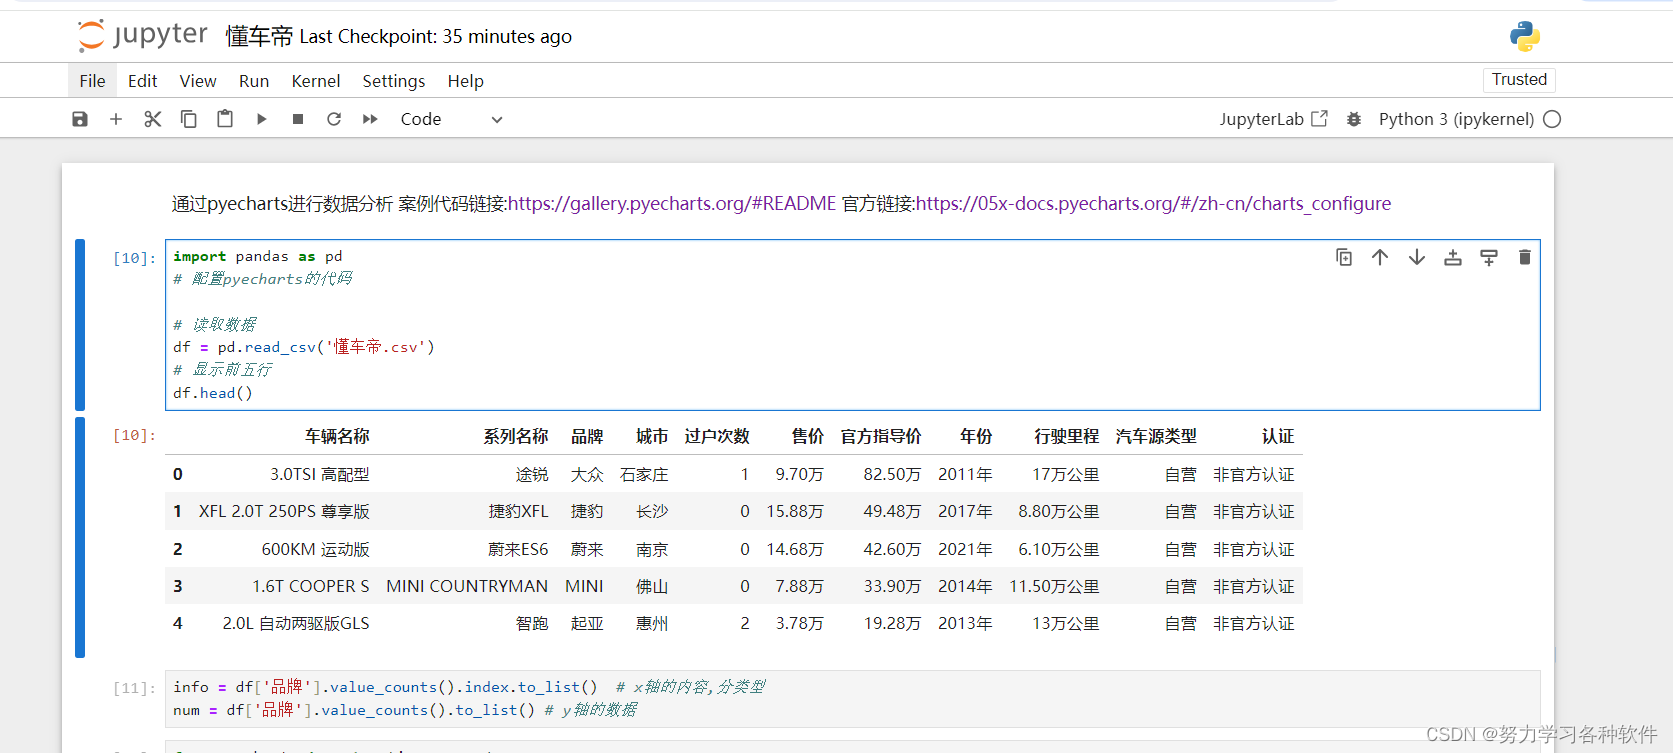
import pandas as pd
# 配置pyecharts的代碼# 讀取數據
df = pd.read_csv('懂車帝.csv')
# 顯示前五行
df.head()
info = df['品牌'].value_counts().index.to_list() # x軸的內容,分類型
num = df['品牌'].value_counts().to_list() # y軸的數據from pyecharts import options as opts
from pyecharts.charts import Pie
from pyecharts.faker import Faker
from pyecharts.globals import CurrentConfig,NotebookType
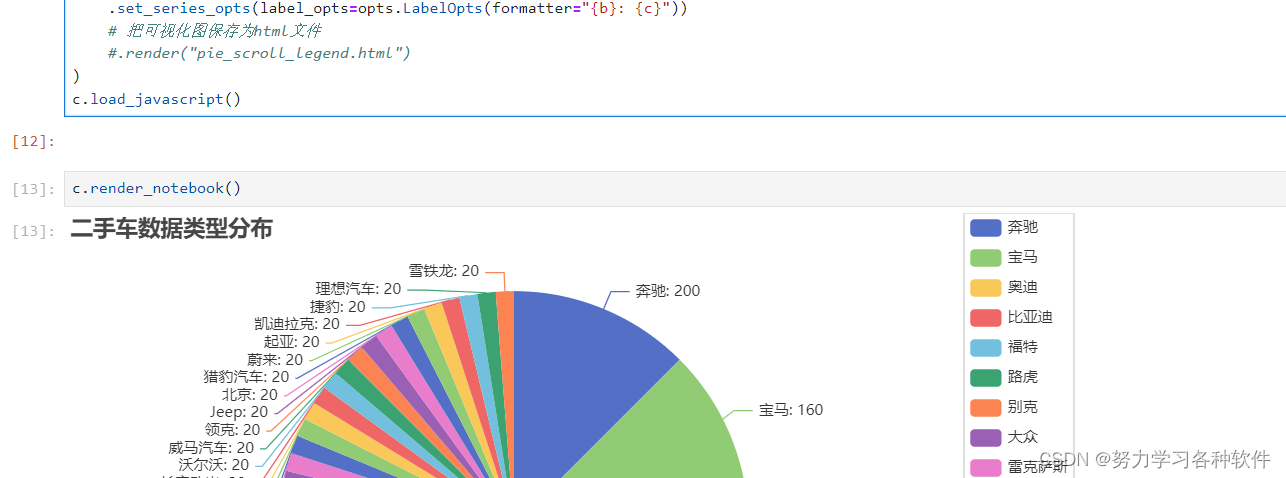
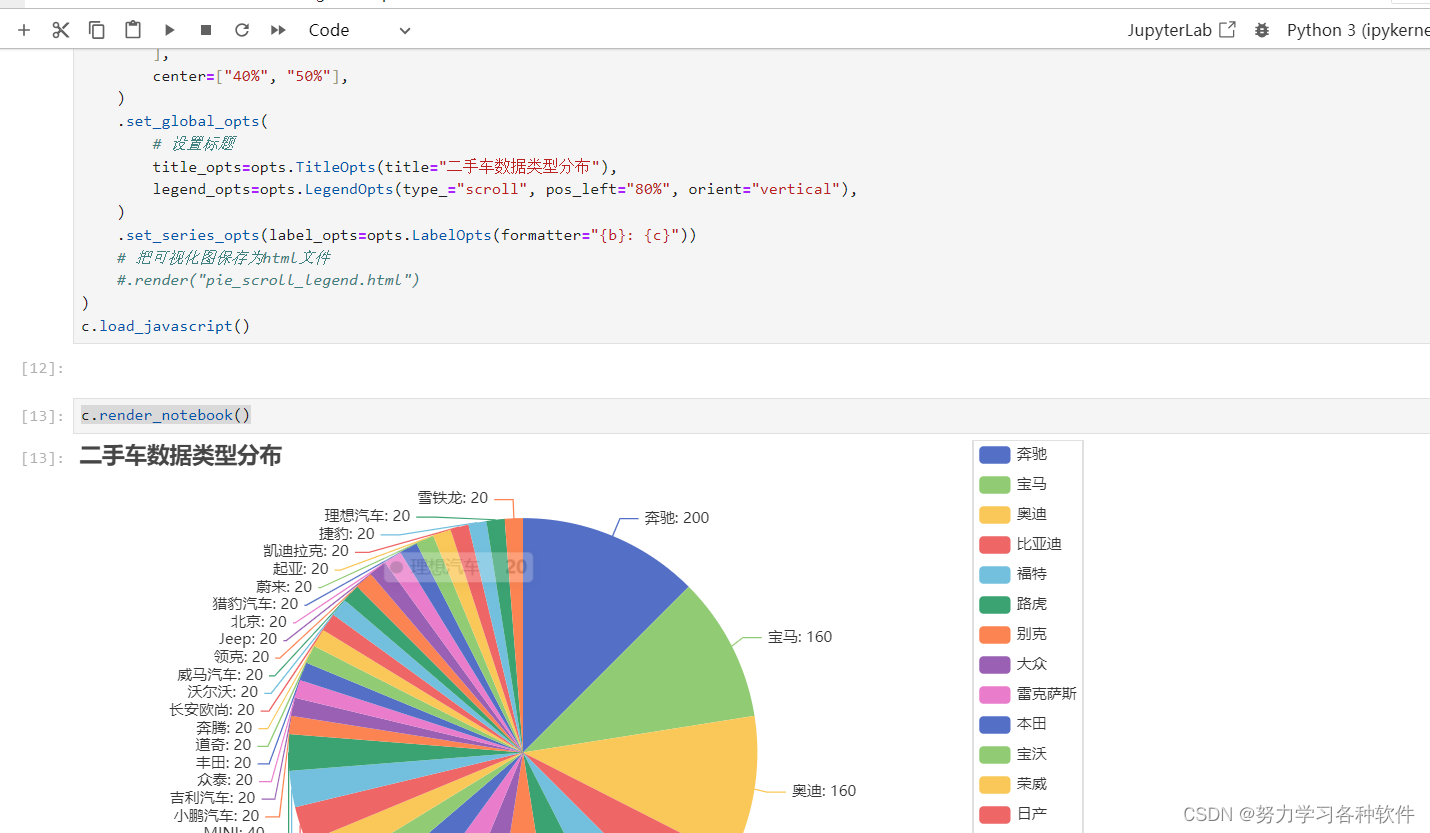
CurrentConfig.NOTEBOOK_TYPE = NotebookType.JUPYTER_LABc = (Pie().add("",[list(z)for z in zip(# 傳入的x和y軸數據info,num,)],center=["40%", "50%"],).set_global_opts(# 設置標題title_opts=opts.TitleOpts(title="二手車數據類型分布"),legend_opts=opts.LegendOpts(type_="scroll", pos_left="80%", orient="vertical"),).set_series_opts(label_opts=opts.LabelOpts(formatter="{b}: {c}"))# 把可視化圖保存為html文件#.render("pie_scroll_legend.html")
)
c.load_javascript()c.render_notebook()?
結果展示:
 ?
?
 ?
?
?
?
四、pyecharts官方示例代碼鏈接:Document?
官方鏈接:pyecharts - A Python Echarts Plotting Library built with love.
?
?
?
?
?
?
?


求解23個基準函數,提供MATLAB代碼)


