In one of my last posts, I showed how to create graphics using the Plotly library. To do this, we import data from MetaTrader in a ‘raw’ way without automation. Today, we will learn how to automate this process and plot a heatmap graph of the correlations of different assets in just a few lines of code.
在上一篇文章中,我展示了如何使用Plotly庫創建圖形。 為此,我們無需自動化即可以“原始”方式從MetaTrader導入數據。 今天,我們將學習如何自動執行此過程,并僅用幾行代碼就可以繪制出不同資產的相關性的熱圖圖。
How to integrate Python and MetaTrader? I follow the following steps:
如何集成Python和MetaTrader? 我遵循以下步驟:
- Having installed MetaTrader 5 and Python 3.8 on your machine 在計算機上安裝了MetaTrader 5和Python 3.8
- Installing the Python libraries: MetaTrader5, matplotlib, and pandas 安裝Python庫:MetaTrader5,matplotlib和pandas
- Importing the data 導入數據
- Plot the Graph 繪制圖
安裝庫 (Installing the Libraries)
If you already have Python installed on your computer, open the terminal and install the necessary libraries with the command:
如果您已經在計算機上安裝了Python,請打開終端并使用以下命令安裝必要的庫:
pip install MetaTrader5
pip install pandas
pip install matplotlib
Have in mind that you must have installed the latest version of MetaTrader on your computer for the integration to work.
請記住,您必須在計算機上安裝最新版本的MetaTrader才能進行集成。
收集資料 (Collecting the Data)
We arrived at the interesting part. We will start the development of our small data collection program.
我們到達了有趣的部分。 我們將開始開發小型數據收集程序。
The first step is to import the necessary libraries:
第一步是導入必要的庫:
import MetaTrader5 as mt5
import pandas as pd
import matplotlib.pyplot as plt
After, we initialize the MetaTrader terminal with the code:
之后,我們使用以下代碼初始化MetaTrader終端:
mt5.initialize()We define the symbols of the assets that we want to analyze in an array. I am Brazilian, and I trade on the Brazilian stock exchange. Thus, the assets described in this article will not work in other brokerages.
我們在數組中定義要分析的資產的符號。 我是巴西人,我在巴西證券交易所交易。 因此,本文所述的資產將無法在其他經紀公司中使用。
symbols = ['GOAU4','WEGE3','VVAR3','PRIO3','MRFG3']
data = pd.DataFrame()
For each symbol in the array, we collect the data defining the time of each bar and the quantity. Then, we feed the data frame with the closing prices of each request:
對于數組中的每個符號,我們收集定義每個柱形時間和數量的數據。 然后,我們向數據框提供每個請求的收盤價:
for i in symbols:
    rates = mt5.copy_rates_from_pos(i, mt5.TIMEFRAME_D1, 0, 1000)
    data[i] = [y['close'] for y in rates]
We will now close the communication with MetaTrader, as we already have the data for analysis.
由于我們已經有要分析的數據,因此我們現在將關閉與MetaTrader的通信。
mt5.shutdown()
計算退貨 (Calculating Returns)
Calculating returns is quite easy. Just call the dataframe’s pct_change () method, and you’re good to go.
計算收益非常容易。 只需調用數據框的pct_change()方法,就可以了。
retornos = data.pct_change()
相關計算 (Correlation Calculation)
Like returns, correlations can also be easily calculated by calling the dataframe’s corr () method.
像返回一樣,通過調用數據框的corr()方法也可以輕松計算相關性。
corr = data.corr()
繪制HeatMap (Plotting the HeatMap)
To build the heat graph, we will use the matplotlib library. So:
要構建熱圖,我們將使用matplotlib庫。 所以:
plt.figure(figsize=(10,10))
plt.imshow(corr, cmap = 'RdYlGn', interpolation='none', aspect='auto')
plt.colorbar()
plt.xticks(range(len(corr)), corr.columns, rotation = 'vertical')
plt.yticks(range(len(corr)), corr.columns)
plt.suptitle('MAPA de CALOR - ATIVOS', fontsize = 15, fontweight = 'bold')
plt.show()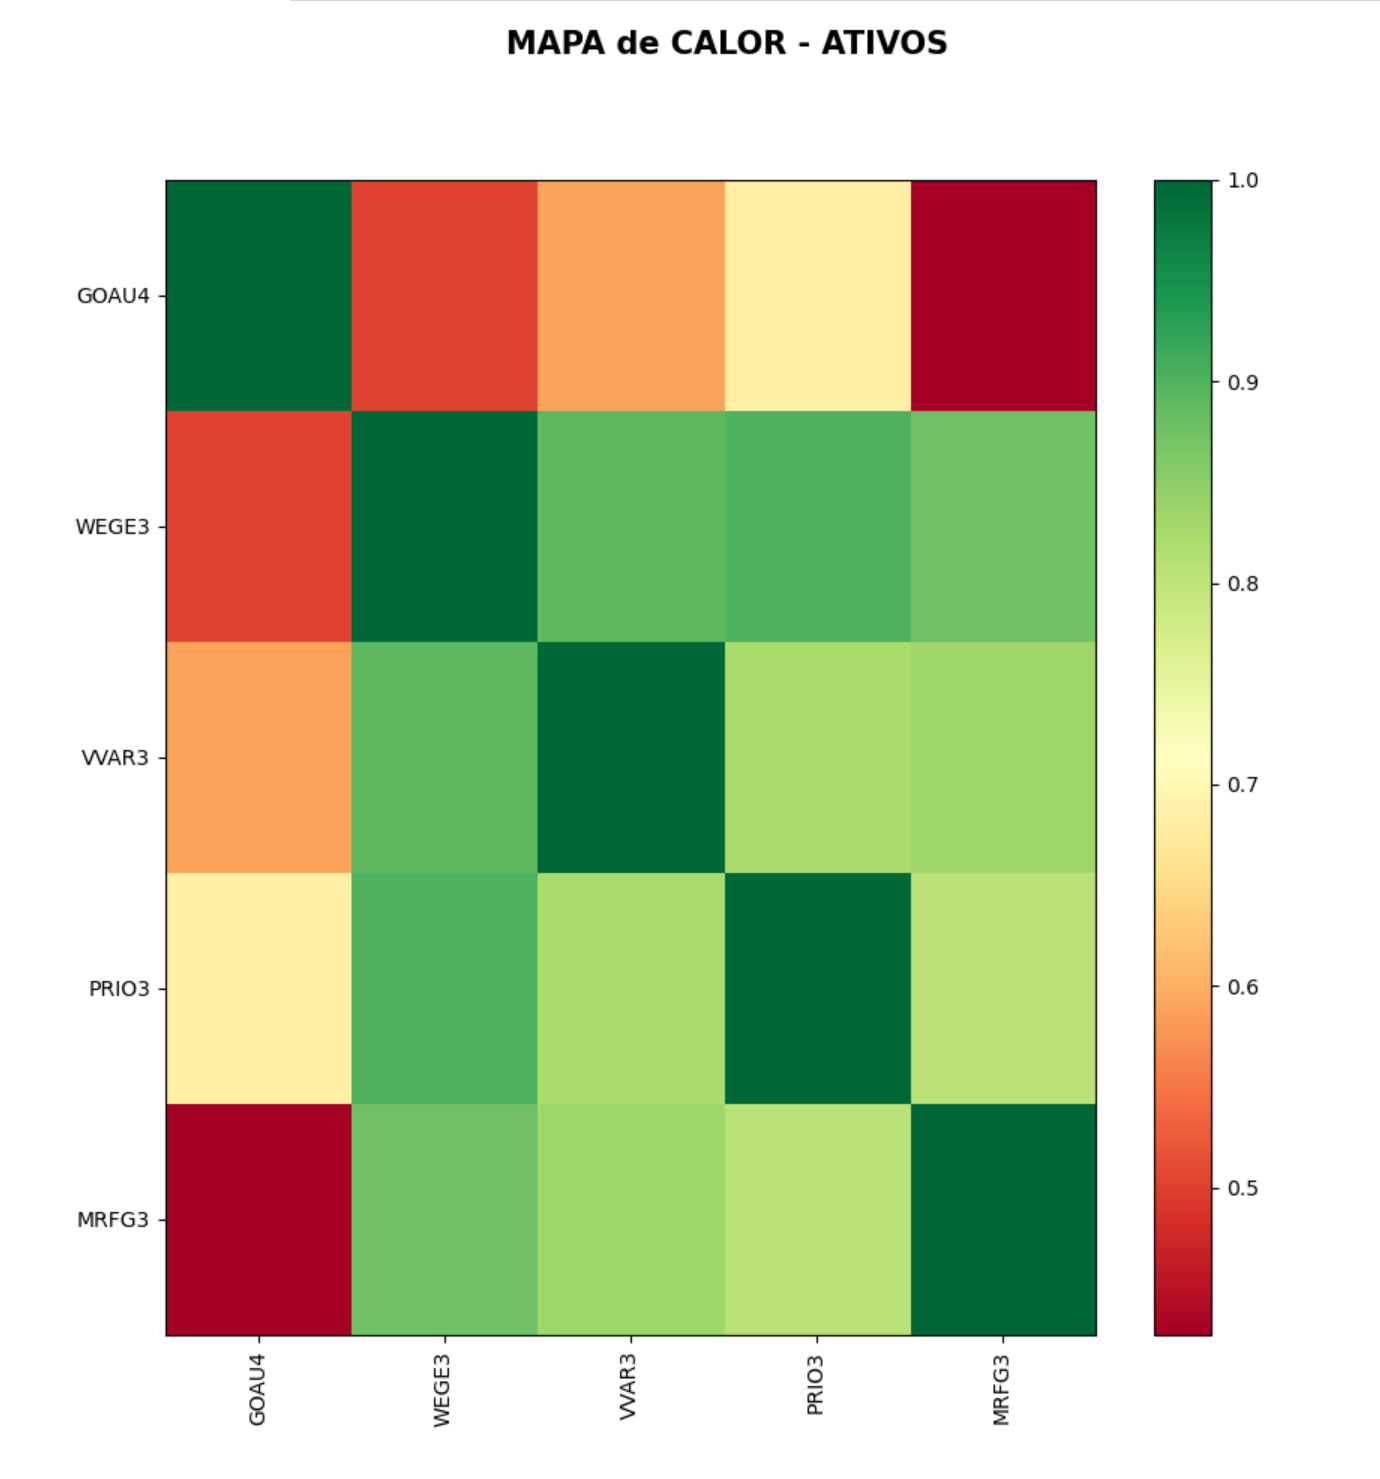
結論 (Conclusion)
In this post, we saw how to connect Python and MetaTrader 5, how to import the data of the assets we want to analyze, and how to create a heatmap of the correlations of the returns of these assets.
在本文中,我們看到了如何連接Python和MetaTrader 5,如何導入要分析的資產的數據,以及如何為這些資產的收益相關建立熱圖。
Thanks for reading, see you next time! Let me know if you have questions. Cheers!
感謝您的閱讀,下次見! 如果您有任何問題,請告訴我。 干杯!
Gain Access to Expert View — Subscribe to DDI Intel
獲得訪問專家視圖的權限- 訂閱DDI Intel
翻譯自: https://medium.com/datadriveninvestor/build-your-trading-strategies-in-5-minutes-with-python-and-metatrader-3e9fd5c62956
本文來自互聯網用戶投稿,該文觀點僅代表作者本人,不代表本站立場。本站僅提供信息存儲空間服務,不擁有所有權,不承擔相關法律責任。 如若轉載,請注明出處:http://www.pswp.cn/news/391989.shtml 繁體地址,請注明出處:http://hk.pswp.cn/news/391989.shtml 英文地址,請注明出處:http://en.pswp.cn/news/391989.shtml
如若內容造成侵權/違法違規/事實不符,請聯系多彩編程網進行投訴反饋email:809451989@qq.com,一經查實,立即刪除!相關文章

卷積神經網絡 手勢識別_如何構建識別手語手勢的卷積神經網絡

spring—第一個spring程序

請對比html與css的異同,css2與css3的區別是什么?


Linux_異常_08_本機無法訪問虛擬機web等工程
![Building a WAMP Dev Environment [3/4] - Installing and Configuring PHP](http://pic.xiahunao.cn/Building a WAMP Dev Environment [3/4] - Installing and Configuring PHP)
Building a WAMP Dev Environment [3/4] - Installing and Configuring PHP

ipywidgets_未來價值和Ipywidgets

2019 css 框架_宣布CSS 2019調查狀態

計算機主機后面輻射大,電腦的背面輻射大嗎

spring— Bean標簽scope配置和生命周期配置

裝飾器3--裝飾器作用原理

用folium模塊畫地理圖_使用Folium表示您的地理空間數據

Windows下安裝Python模塊時環境配置

函數)
linear在HTML的作用,CSS3里的linear-gradient()函數

golang底層深入_帶有Golang的GraphQL:從基礎到高級的深入研究

spring—Bean實例化三種方式

bzoj 3439: Kpm的MC密碼

python創建類統計屬性_輕松創建統計數據的Python包
