用folium模塊畫地理圖
As a part of the Data Science community, Geospatial data is one of the most crucial kinds of data to work with. The applications are as simple as ‘Where’s my food delivery order right now?’ and as complex as ‘What is the most optimal path for the delivery guy?’
作為數據科學社區的一部分,地理空間數據是最重要的數據類型之一。 申請就像“我現在的外賣訂單在哪里?”一樣簡單。 就像“送貨員的最佳路徑是什么?”一樣復雜。
是什么把我帶到了Folium? (What brought me to Folium?)
I was recently working on a data science problem involving a lot of gps coordinates. Obviously the very basic question — how do I represent these coordinates on a map in my jupyter notebook? And while we know that plotly, geopy and basemap get the job done, this is the first time I came across Folium and decided to give it a go!
我最近正在研究一個涉及許多gps坐標的數據科學問題。 顯然,這是一個非常基本的問題-如何在jupyter筆記本中的地圖上表示這些坐標? 雖然我們知道plotly , geopy和basemap可以完成工作,但這是我第一次遇到Folium并決定嘗試一下!
This article is a step by step tutorial on representing your data using folium.
本文是有關使用folium表示數據的分步教程。
介紹 (Introduction)
Folium essentially is used for generating interactive maps for the browser (inside notebooks or on a website). It uses leaflet.js , a javascript library for interactive maps.
Folium本質上用于為瀏覽器(在筆記本內部或網站上)生成交互式地圖。 它使用leaflet.js (用于交互式地圖的javascript庫)。
To put it in a one-liner: Manipulate your data in Python, then visualize it in on a Leaflet map via folium.
要將其放在一個直線上: 用Python處理數據,然后通過葉片將其可視化在Leaflet地圖上。
Step 1: Installing folium on the computer and importing the necessary packages.
步驟1: 在計算機上安裝大葉草并導入必要的軟件包。
!pip install foliumimport numpy as np
import pandas as pd
import matplotlib.pyplot as plt
from sklearn import preprocessing
import scipy## for geospatial
import folium
import geopy
We will work with the Fire from Space: Australia dataset.
我們將使用“ 來自太空的火焰:澳大利亞”數據集。
Step 2: Loading and inspecting the dataset.
步驟2: 加載和檢查數據集。
df = pd.read_csv("fire_archive_M6_96619.csv")
Step 3: Finding the coordinates to begin with.
步驟3: 找到要開始的坐標。
We can either pick a set of coordinates from the dataset itself or we can use geopy for this purpose. Here, we are talking about Australian wildfires so I started with Melbourne for reference.
我們可以從數據集本身中選擇一組坐標,也可以為此使用geopy。 在這里,我們談論的是澳大利亞的山火,所以我從墨爾本開始作為參考。
city = "Melbourne"
# get location
locator = geopy.geocoders.Nominatim(user_agent="My app")
city = locator.geocode(city)
location = [city.latitude, city.longitude]
print(city, "\n[lat, long]:", location)
Step 4: Plotting on the map.
步驟4: 在地圖上繪制。
Plotting points on a map in Folium is like building a house. You lay the base (that’s your background map) and then you add points on top of it’s surface.
在Folium地圖上繪制點就像在蓋房子。 放置基礎(即背景圖),然后在其表面頂部添加點。
We shall first lay the base.
我們首先要打基礎。
map_ = folium.Map(location=location, tiles="cartodbpositron",
                  zoom_start=8)
map_
You can also play around with the tileset and zoom by referring here.
您還可以通過參考此處來玩游戲并縮放。
Now we plot the points on the map. We shall color-code according to the attribute ‘type’ and size it as per the ‘brightness’ of the fire. So let’s get those attributes in order first.
現在我們在地圖上繪制點。 我們將根據屬性“類型”對代碼進行顏色編碼,并根據火的“亮度”對其進行大小調整。 因此,讓我們先按順序獲取這些屬性。
# create color column to correspond to type
colors = ["red","yellow","orange", "green"]
indices = sorted(list(df["type"].unique()))
df["color"] = df["type"].apply(lambda x:
               colors[indices.index(x)])
## scaling the size
scaler = preprocessing.MinMaxScaler(feature_range=(3,15))
df["size"] = scaler.fit_transform(
               df['brightness'].values.reshape(-1,1)).reshape(-1)
We finally add points on top of the map using folium.
最后,我們使用葉片將點添加到地圖頂部。
df.apply(lambda row: folium.CircleMarker(
           location=[row['latitude'],row['longitude']],
           popup=row['type'],
           color=row["color"], fill=True,
           radius=row["size"]).add_to(map_), axis=1)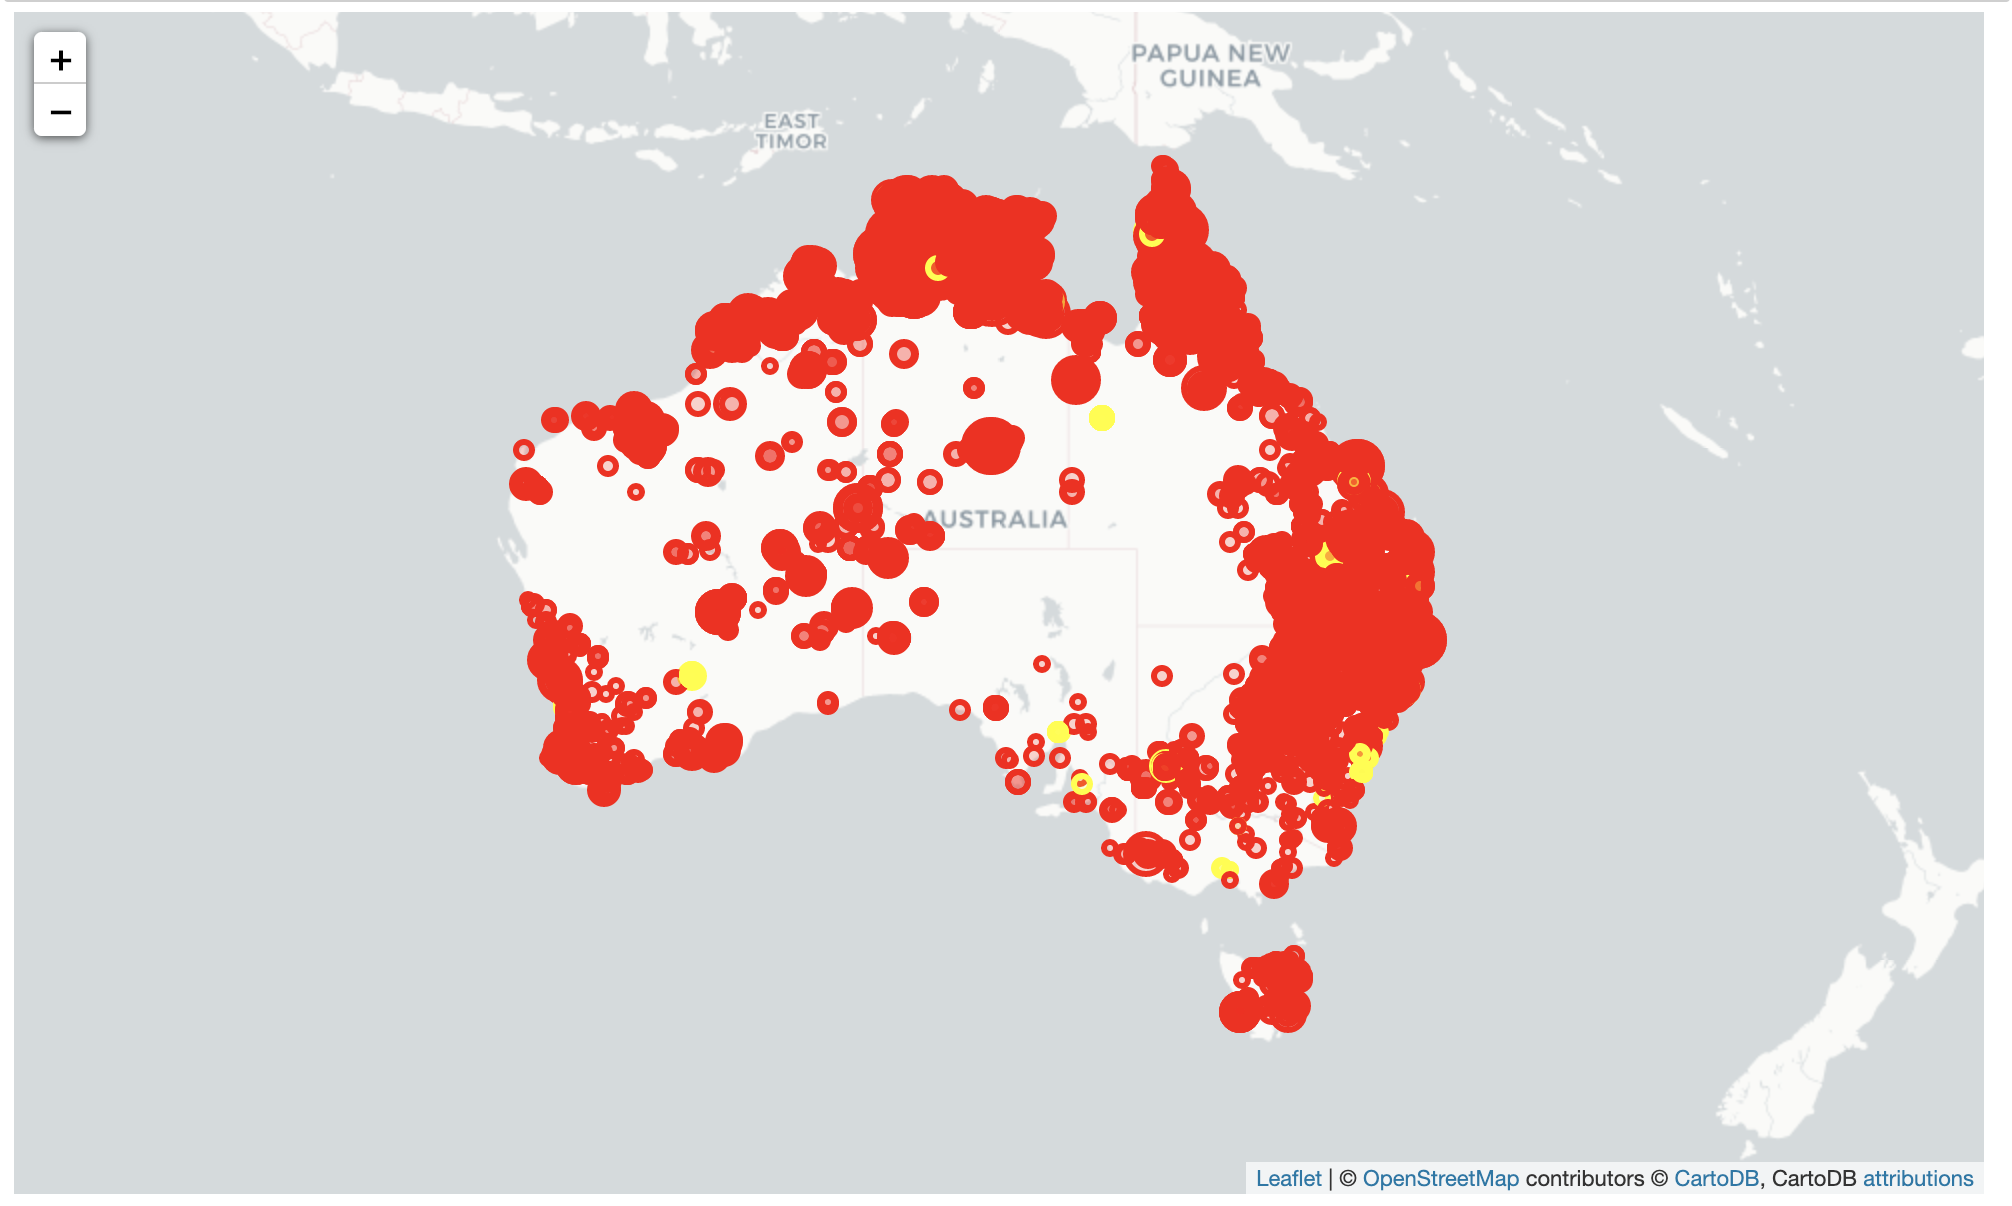
Finally, we move to adding a legend to the map. I used this reference for adding a legend. There are a variety of other methods but this was what I found the easiest.
最后,我們開始向地圖添加圖例。 我使用此參考來添加圖例。 還有許多其他方法,但這是我發現的最簡單的方法。
legend_html = """<div style="position:fixed;
top:10px; right:10px;
border:2px solid black; z-index:9999;
font-size:14px;"> <b>"""+color+""":</b><br>"""
for i in lst_elements:
legend_html = legend_html+""" <i class="fa fa-circle
fa-1x" style="color:"""+lst_colors[lst_elements.index(i)]+"""">
</i> """+str(i)+"""<br>"""
legend_html = legend_html+"""</div>"""
map_.get_root().html.add_child(folium.Element(legend_html))#plot
map_
Here’s the whole piece of code:
這是整個代碼段:
import numpy as np
import pandas as pd
import matplotlib.pyplot as plt
from sklearn import preprocessing
import scipy
## for geospatial
import folium
import geopydf = pd.read_csv("fire_archive_M6_96619.csv")city = "Melbourne"
# get location
locator = geopy.geocoders.Nominatim(user_agent="My app")
city = locator.geocode(city)
location = [city.latitude, city.longitude]
print(city, "\n[lat, long]:", location)map_ = folium.Map(location=location, tiles="cartodbpositron",
zoom_start=8)# create color column to correspond to type
colors = ["red","yellow","orange", "green"]
indices = sorted(list(df["type"].unique()))
df["color"] = df["type"].apply(lambda x:
colors[indices.index(x)])
## scaling the size
scaler = preprocessing.MinMaxScaler(feature_range=(3,15))
df["size"] = scaler.fit_transform(
df['brightness'].values.reshape(-1,1)).reshape(-1)df.apply(lambda row: folium.CircleMarker(
location=[row['latitude'],row['longitude']],
popup=row['type'],
color=row["color"], fill=True,
radius=row["size"]).add_to(map_), axis=1)legend_html = """<div style="position:fixed;
top:10px; right:10px;
border:2px solid black; z-index:9999;
font-size:14px;"> <b>"""+color+""":</b> <br>"""
for i in lst_elements:
legend_html = legend_html+""" <i class="fa fa-circle
fa-1x" style="color:"""+lst_colors[lst_elements.index(i)]+"""">
</i> """+str(i)+"""<br>"""
legend_html = legend_html+"""</div>"""
map_.get_root().html.add_child(folium.Element(legend_html))
#plot
map_You can also find it on my Github. Hope this article helped.
您也可以在我的Github上找到它。 希望本文對您有所幫助。
翻譯自: https://towardsdatascience.com/represent-your-geospatial-data-using-folium-c2a0d8c35c5c
用folium模塊畫地理圖
本文來自互聯網用戶投稿,該文觀點僅代表作者本人,不代表本站立場。本站僅提供信息存儲空間服務,不擁有所有權,不承擔相關法律責任。 如若轉載,請注明出處:http://www.pswp.cn/news/391977.shtml 繁體地址,請注明出處:http://hk.pswp.cn/news/391977.shtml 英文地址,請注明出處:http://en.pswp.cn/news/391977.shtml
如若內容造成侵權/違法違規/事實不符,請聯系多彩編程網進行投訴反饋email:809451989@qq.com,一經查實,立即刪除!相關文章

Windows下安裝Python模塊時環境配置

函數)
linear在HTML的作用,CSS3里的linear-gradient()函數

golang底層深入_帶有Golang的GraphQL:從基礎到高級的深入研究

spring—Bean實例化三種方式

bzoj 3439: Kpm的MC密碼

python創建類統計屬性_輕松創建統計數據的Python包

pytorch深度學習_在本完整課程中學習在PyTorch中應用深度學習

html讓a標簽左右一樣寬,button和a標簽設置相同的css樣式,但是寬度不同

淺析STM32之usbh_def.H

spring—依賴注入
在運行時的相互關系)
C# (類型、對象、線程棧和托管堆)在運行時的相互關系

2019-08-01 紀中NOIP模擬賽B組

knn分類 knn_關于KNN的快速小課程

spring—配置數據源

大型網站系統與Java中間件實踐pdf

office漏洞利用--獲取shell

pandas之DataFrame合并merge

typescript_如何掌握高級TypeScript模式
和splice())和js引用的三種方法總結—2019年1月16日...)