安裝kube-prometheus 后默認在monitoring namespace中有創建 blackbox-exporter deployment。但默認沒有icmp的module配置,無法執行ping探測。因為即使有icmp module,默認配置也是無法執行ping探測的(這篇文章要解決的就是這個問題),這可能也是默認沒有icmp module的原因。
首先把icmp module加上,然后增加icmp 的probe配置:
第一步修改blackbox 的config map,添加icmp的modules:
kubectl -n monitoring edit cm blackbox-exporter-configuration
添加如下module配置"icmp_example":"prober": "icmp""timeout": "5s""icmp":"preferred_ip_protocol": "ip4"
創建probe
注意這里的module 名要與剛創建的對應
kind: Probe
apiVersion: monitoring.coreos.com/v1
metadata:name: example-pingnamespace: monitoring
spec:interval: 60smodule: icmp_exampleprober:url: blackbox-exporter.monitoring.svc.cluster.local:19115targets:staticConfig:static:- 127.0.0.1
至此,你的prometheus中應該有這個target了,并且狀態也是up,類似如下
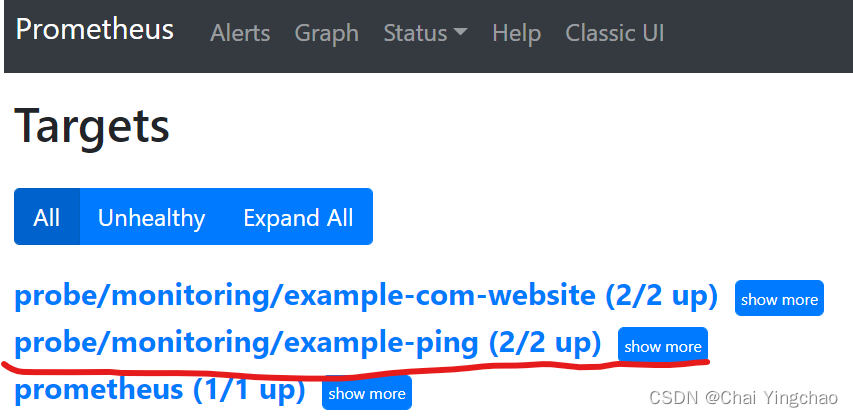
但是在Prometheus 中查詢 probe_success 的結果時返回值是0,也就時ping不通。值為1表示ping成功。
也可以通過訪問blackbox的如下url進行測試:
curl -s http://192.168.112.123:9115/probe?module=icmp_example&target=127.0.0.1
此時檢查blcakbox-exporter的日志毫無發現。
下面調整日志級別為debug試試
在blackbox容器args新曾參數--log.level=debug
kubectl -n monitoring edit deployments.apps  blackbox-exporter containers:- args:- --config.file=/etc/blackbox_exporter/config.yml- --web.listen-address=:19115- --log.level=debug #新增行,開啟debug模式
開啟debug日志后再查看日志,將看到有如下報錯
ts=2023-08-08T01:15:43.133Z caller=handler.go:184 module=icmp_example target=192.168.199.123 level=debug msg="Unable to do unprivileged listen on socket, will attempt privileged" err="socket: permission denied"
ts=2023-08-08T01:15:43.133Z caller=handler.go:184 module=icmp_example target=192.168.199.123 level=debug msg="Error listening to socket" err="listen ip4:icmp 0.0.0.0: socket: operation not permitted"
ts=2023-08-08T01:15:43.133Z caller=handler.go:184 module=icmp_example target=192.168.199.123 level=debug msg="Probe failed" duration_seconds=0.00031592
這看起來是權限問題導致的。找到如下解釋:
https://github.com/prometheus/blackbox_exporter#permissions
The ICMP probe requires elevated privileges to function:
Windows: Administrator privileges are required.
Linux: either a user with a group within net.ipv4.ping_group_range, the CAP_NET_RAW capability or the root user is required.
1. Your distribution may configure net.ipv4.ping_group_range by default in /etc/sysctl.conf or similar. If not you can set net.ipv4.ping_group_range = 0 2147483647 to allow any user the ability to use ping.
2. Alternatively the capability can be set by executing setcap cap_net_raw+ep blackbox_exporter
BSD: root user is required.
bNo additional privileges are needed.
Linux ping 命令需要 “cap_net_raw”(或 “CAP_NET_RAW”)的 Capabilities 權限,因為該命令需要對數據包進行原始套接字訪問。如果不具備此權限,則無法構建和發送 ICMP 包,或者無法接 ICMP 包的響應。
請注意,ping 命令需要在網絡層上執行操作,因此它需要特殊的權限。使用 Capabilities 機制覆蓋了普通 Linux 用戶的權限限制。設置 “cap_net_raw” 權限時,用戶將能夠執行“ping”命令,而無需以 root 用戶的身份登錄到系統。
如果使用 root 用戶運行 ping 命令,則無需為 ping 命令設置 “cap_net_raw” 的 Capabilities 權限即可成功運行。這是因為 root 用戶具有所有系統資源和 Capabilities 權限。使用 root 用戶時,系統將允許 ping 命令訪問原始套接字,而無需 Capabilities 權限。
那么也就說應該有兩種方式解決這個問題,一是簡單粗暴使用root運行(安全性低)。二是給與容器NET_RAW權限。下面分別測試一下:
方案1,給root權限
kubectl -n monitoring edit deployments.apps blackbox-exportersecurityContext部分修改為如下:securityContext:allowPrivilegeEscalation: falsereadOnlyRootFilesystem: truerunAsNonRoot: falserunAsUser: 0(注意這里去掉了原來的capabilities)也就是這部分,因為即使是有root權限,如果顯示的移除了權限,也仍然沒權限。capabilities:drop: - ALL
這樣修改之后再在Prometheus 中查詢 probe_success 的結果值應該是1了。也就是正常了。
再看第二種方案:為容器增加NET_RAW
開始想直接修改deployment的capabilities配置,加上如下配置即可。
capabilities:add:- NET_RAW
但是經過測試發現不行,初步判斷是因為blackbox-exporter容器鏡像本身處于安全性考慮的原因,禁用了一些權限,(如Alpine 鏡像,加也沒效果,可以通過進入容器內cat /proc/1/status命令查看CapPrm和CapEff的值。可參照文檔 https://kubernetes.io/zh-cn/docs/tasks/configure-pod-container/security-context/)
在 Linux 操作系統中,進程的系統權限可以通過掩碼方式進行控制。這些掩碼通常被稱為“capabilities”,每個掩碼通常代表一項特定的系統操作功能。
如果 /proc/1/status 文件中 CapPrm 和 CapEff 的值都為 0,這意味著該進程沒有啟用任何權限。這可能是由于系統管理員將該進程的權限掩碼設置為 0,或者該進程在啟動時未顯式啟用任何額外的權限。另外一些 Linux 發行版(如 Alpine)默認在容器中禁用權限,因此 /proc/1/status 中的權限值通常為 0。如果您有特定的權限要求,請確保正確配置容器和 Pod 的權限
所以如果我們即不想用root用戶運行blackbox,又想用icmp監控。則需要重新build一個鏡像。
Dockerfile 如下
FROM scionproto/docker-caps as capsFROM prom/blackbox-exporter:v0.23.0
COPY --from=caps /bin/setcap /bin
RUN setcap cap_net_raw+ep /bin/blackbox_exporter && rm /bin/setcap
修改blackbox-exporter deployment 的鏡像為剛剛build的鏡像。再修改securityContext配置,去掉原有的:
capabilities:drop: - ALL
securityContext部分修改為如下:securityContext:allowPrivilegeEscalation: falsereadOnlyRootFilesystem: truerunAsNonRoot: truerunAsUser: 65534
blackbox-extporter pod正常運行后在Prometheus 中查詢 probe_success 的結果值應該是1了。也就是正常了。
如果使監控web站點,直接配置probe即可
參考文檔:https://github.com/prometheus-operator/kube-prometheus/blob/main/docs/blackbox-exporter.md
kind: Probe
apiVersion: monitoring.coreos.com/v1
metadata:name: example-com-websitenamespace: monitoring
spec:interval: 60smodule: http_2xxprober:url: blackbox-exporter.monitoring.svc.cluster.local:19115targets:staticConfig:static:- http://example.com- https://example.com
參考資料
https://blog.csdn.net/qq_33745102/article/details/131042025
https://github.com/prometheus/blackbox_exporter/issues/689
https://github.com/scionproto/docker-caps


:perspctive透視效果 與 preserve-3d 3d效果(奧運五環例子))


)


)
)