hdf5文件和csv的區別
In my last article, I discussed the steps to download NASA data from GES DISC. The data files downloaded are in the HDF5 format. HDF5 is a file format, a technology, that enables the management of very large data collections. Thus, it is quite popular for storing information. For getting NASA’s data, please check the below article first:
在上一篇文章中,我討論了從GES DISC下載NASA數據的步驟。 下載的數據文件為HDF5格式。 HDF5是一種文件格式,一種技術,可以管理非常大的數據集。 因此,在存儲信息方面非常流行。 要獲取NASA的數據,請先查看以下文章:
Whenever I work with datasets, I’m most comfortable with CSV files. Thus, once I got the HDF5 files, I decided to look for ways to change them to CSV files. I found the package h5py in Python, which enables the reading in of HDF5 files. Thus, this article articulates the steps to use h5py and convert HDF5 to CSV. You can follow along by referring to the complete notebook at the link below.
每當我使用數據集時,我對CSV文件都很滿意。 因此,一旦獲得HDF5文件,我便決定尋找將其更改為CSV文件的方法。 我在Python中找到了h5py軟件包,該軟件包可以讀取HDF5文件。 因此,本文闡述了使用h5py并將HDF5轉換為CSV的步驟。 您可以通過以下鏈接參考完整的筆記本。
導入庫 (Import libraries)
For this work, we’ll require two libraries. The first library is h5py which has the option to read and work with HDF5 files (documentation). The second package we need is numpy to work with arrays. Finally, we will import pandas so we can create a dataframe and later save it as a CSV file.
對于這項工作,我們將需要兩個庫。 第一個庫是h5py ,它具有讀取和使用HDF5文件( 文檔 )的選項。 我們需要的第二個包是使用numpy來處理數組。 最后,我們將導入pandas以便我們可以創建一個數據框,然后將其另存為CSV文件。
import h5py
import numpy as np
import pandas as pd
加載數據集 (Load dataset)
The next step is to load in the HDF5 file. Note that for this example, I’m working with GPM data collected from GES DISC for January, 2020 for the whole world. It’s located inside the data folder in the GitHub repo (downloaded from GES DISC website).
下一步是加載HDF5文件。 請注意,在此示例中,我正在使用從GES DISC收集的2020年1月全世界的GPM數據。 它位于GitHub存儲庫中的data文件夾內(可從GES DISC網站下載)。
I’ll use the File method from the h5py library to read the HDF5 file and save it to the variable called dataset. I specify the name of the file along with the full path as the first argument and set the second argument as r indicating that I’m working with this file in the read only mode.
我將使用h5py庫中的File方法讀取HDF5文件并將其保存到名為dataset的變量中。 我將文件名以及完整路徑指定為第一個參數,并將第二個參數設置為r指示我正在以只讀模式使用此文件。
dataset = h5py.File('data/gpm_jan_2020.HDF5', 'r')探索數據集 (Explore dataset)
Now that the file is all loaded in, we can get started with exploring the dataset. The elements of this file are similar to a Python dictionary. Thus, it comprises of key-value pairs. So, I started by looking at the various keys in this file.
現在文件已全部加載完畢,我們可以開始探索數據集了。 該文件的元素類似于Python字典。 因此,它包含鍵值對。 因此,我首先查看了此文件中的各種鍵。
dataset.keys()## Output
# <KeysViewHDF5 ['Grid']>
As we see in the result above, there is just one key called Grid. As we do not see any data, the data might be inside the value of this key; so that’s what I do, I read its value using dataset[’Grid’] into grid and look at its keys.
正如我們在上面的結果中看到的,只有一個名為Grid鍵。 由于我們看不到任何數據,因此該數據可能在此鍵的值之內; 這就是我的工作,我使用dataset['Grid']將其值讀取到grid并查看其鍵。
grid = dataset['Grid']
grid.keys()## Output
# <KeysViewHDF5 ['nv', 'lonv', 'latv', 'time', 'lon', 'lat', 'time_bnds', 'lon_bnds', 'lat_bnds',
# 'precipitation', 'randomError', 'gaugeRelativeWeighting', 'probabilityLiquidPrecipitation',
# 'precipitationQualityIndex']>
Finally, we see the data. We have several features that we can use. All of these represent keys and they will have their corresponding values, which is what we’re looking for. For this work, I’m only interested in latitude, longitude and the precipitation at that latitude-longitude combination.
最后,我們看到了數據。 我們有幾個可以使用的功能。 所有這些都代表鍵,并且它們將具有它們對應的值,這就是我們想要的。 對于這項工作,我只對緯度,經度和該緯度-經度組合處的降水感興趣。
Let’s take a look at each of these features one by one.
讓我們一一看一下這些功能。
經度 (Longitude)
I print the longitude key and its attributes. We find that there are 3600 values for longitude. In the attributes, the units and standard_name are the two things I would like to use.
我打印經度鍵及其屬性。 我們發現經度有3600個值。 在屬性中, units和standard_name是我要使用的兩件事。
print("Longitude data: {}".format(grid['lon']))
print("Longitude data attributes: {}".format(list(grid['lon'].attrs)))## Output
# Longitude data: <HDF5 dataset "lon": shape (3600,), type "<f4">
# Longitude data attributes: ['DimensionNames', 'Units', 'units',
# 'standard_name', 'LongName', 'bounds', 'axis', 'CLASS', 'REFERENCE_LIST']print("Name: {}".format(grid['lon'].attrs['standard_name'].decode()))
print("Unit: {}".format(grid['lon'].attrs['units'].decode()))## Output
# Name: longitude
# Unit: degrees_east
緯度 (Latitude)
Similar to longitude, I check the key and its attributes. There are 1800 latitude values and units and standard_name are useful to me.
與經度類似,我檢查鍵及其屬性。 有1800個緯度值, units和standard_name對我有用。
print("Latitude data: {}".format(grid['lat']))
print("Latitude data attributes: {}".format(list(grid['lat'].attrs)))## Output
# Latitude data: <HDF5 dataset "lat": shape (1800,), type "<f4">
# Latitude data attributes: ['DimensionNames', 'Units', 'units',
# 'standard_name', 'LongName', 'bounds', 'axis', 'CLASS', 'REFERENCE_LIST']print("Name: {}".format(grid['lat'].attrs['standard_name'].decode()))
print("Unit: {}".format(grid['lat'].attrs['units'].decode()))## Output
# Name: latitude
# Unit: degrees_north
沉淀 (Precipitation)
I print the key and attributes for precipitation.
我打印沉淀的鍵和屬性。
print("Precipitation data: {}".format(grid['precipitation']))
print("Precipitation data attributes: {}".format(list(grid['precipitation'].attrs)))## Output
# Precipitation data: <HDF5 dataset "precipitation": shape (1, 3600, 1800), type "<f4">
# Precipitation data attributes: ['DimensionNames', 'Units', 'units', 'coordinates',
# '_FillValue', 'CodeMissingValue', 'DIMENSION_LIST']print("Unit: {}".format(grid['precipitation'].attrs['units'].decode()))## Output
# Unit: mm/hr
The precipitation data is a 3-dimensional array with the precipitation values stored as a 2-d matrix. It has the shape (3600, 1800) meaning it has precipitation values across all combinations of longitude and latitude. Further, the units of precipitation are found in the units attribute as mm/hr.
降水量數據是一個3維數組,其中降水量值存儲為2-d矩陣。 它的形狀為(3600,1800),表示在所有經度和緯度組合中都具有降水值。 此外,在units屬性中以mm/hr為units找到降水的units 。
創建數據框 (Create dataframe)
As we now know all the things we want to capture in the final CSV file, we’ll directly proceed with capturing that.
現在我們知道了要在最終CSV文件中捕獲的所有內容,我們將直接進行捕獲。
Our dataset will have 6,480,000 rows (3600x1800). Each of these rows has a unique combination of longitude and latitude. Thus, for each longitude, we have a latitude and the corresponding precipitation value.
我們的數據集將有6,480,000行(3600x1800)。 這些行中的每行都有經度和緯度的唯一組合。 因此,對于每個經度,我們都有一個緯度和相應的降水值。
To create the list of longitude values for all precipitation values, we need to repeat each value of the longitude list 1800 times. This is saved as longitude_values with a total length of 6,480,000 values (3600 longitude values, each repreated 1800 times) using np.repeat().
要為所有降水值創建經度值列表,我們需要將經度列表的每個值重復1800次。 使用np.repeat()將其保存為longitude_values值,總長度為6,480,000個值(3600個經度值,每個值被np.repeat() 1800次np.repeat() 。
For each longitude value, we need all latitude values. So, to create the final latitude_values list, we multiply the complete list by 3600, creating a 6,480,000 long list with latitude list repeated over and over again 3600 times.
對于每個經度值,我們需要所有緯度值。 因此,要創建最終的latitude_values列表,我們將整個列表乘以3600,創建一個6,480,000長的列表,并將緯度列表重復3600次。
Finally, to convert the matrix of precipitation values, I used the flatten() function to convert it into a long list.
最后,為了轉換降水值矩陣,我使用了flatten()函數將其轉換為一個長列表。
longitude_values = np.repeat(list(grid['lon']), 1800)
latitude_values = list(grid['lat'])*3600
precipitation_values = np.array(list(grid['precipitation'])).flatten()dataset = pd.DataFrame({"lon": longitude_values, "lat": latitude_values, "precipitation": precipitation_values})
dataset.columns = [grid['lon'].attrs['standard_name'].decode() + " (" + grid['lon'].attrs['units'].decode() + ")",grid['lat'].attrs['standard_name'].decode() + " (" + grid['lat'].attrs['units'].decode() + ")","Precipitation (" + grid['precipitation'].attrs['units'].decode() + ")",]
dataset.head()
I then saved these lists as columns of the dataset dataframe with labels lon, lat and precipitation. I rename the columns with the labels and the units we extracted above. Note that the strings are saved with a b due to byte encoding, so I append these attributes with decode() to get the string values.
然后,我將這些列表另存為dataset數據框的列,標簽為lon , lat和precipitation 。 我使用上面提取的標簽和單位對列進行重命名。 請注意,由于字節編碼的原因,字符串使用b進行保存,因此我將這些屬性附加到decode()以獲取字符串值。
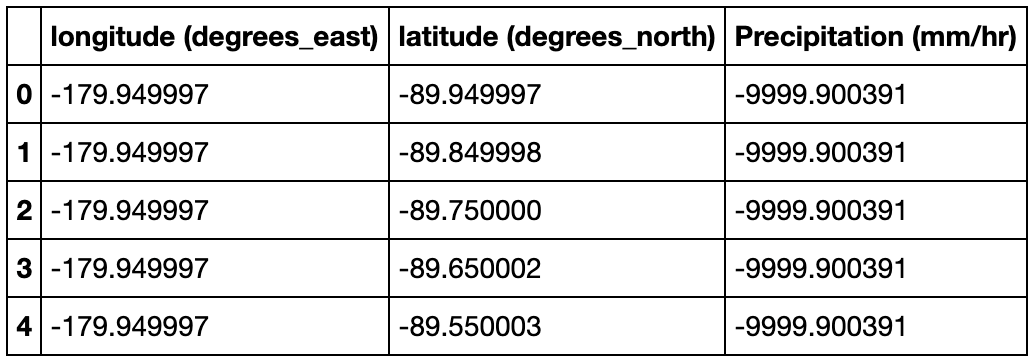
Some precipitation values are not captured or are missing and are denoted by -9999.900391 in the dataset, so I mask them with a value 0.
一些降水量值未捕獲或丟失,在數據集中用-9999.900391表示,因此我將其掩碼為0 。
dataset['Precipitation (mm/hr)'] = dataset['Precipitation (mm/hr)'].mask(dataset['Precipitation (mm/hr)'] == -9999.900391, 0)As the last step, I saved the dataframe as a CSV file precipitation_jan_2020.csv inside the data folder.
作為最后一步,我保存的數據幀為CSV文件precipitation_jan_2020.csv 數據文件夾內。
dataset.to_csv("data/precipitation_jan_2020.csv", index = False)And that’s it! We have our CSV file.
就是這樣! 我們有CSV文件。
結論 (Conclusion)
In this article, I described the steps to load a HDF5 file in Python, read its elements and finally create a dataframe that can be saved as a CSV file. The same steps can be replicated for any other HDF5 file as well.
在本文中,我描述了在Python中加載HDF5文件,讀取其元素并最終創建可保存為CSV文件的數據框的步驟。 相同的步驟也可以復制到任何其他HDF5文件。
Hope you liked this article. If you have any questions, suggestions or ideas, please mention them in the comments.
希望您喜歡這篇文章。 如果您有任何問題,建議或想法,請在評論中提及。
翻譯自: https://towardsdatascience.com/working-with-hdf5-files-and-creating-csv-files-1a7d212d970f
hdf5文件和csv的區別
本文來自互聯網用戶投稿,該文觀點僅代表作者本人,不代表本站立場。本站僅提供信息存儲空間服務,不擁有所有權,不承擔相關法律責任。 如若轉載,請注明出處:http://www.pswp.cn/news/391636.shtml 繁體地址,請注明出處:http://hk.pswp.cn/news/391636.shtml 英文地址,請注明出處:http://en.pswp.cn/news/391636.shtml
如若內容造成侵權/違法違規/事實不符,請聯系多彩編程網進行投訴反饋email:809451989@qq.com,一經查實,立即刪除!相關文章

CSS仿藝龍首頁鼠標移入圖片放大
)
leetcode 224. 基本計算器(棧)

機械制圖國家標準的繪圖模板_如何使用p5js構建繪圖應用

機器學習常用模型:決策樹_fairmodels:讓我們與有偏見的機器學習模型作斗爭

高德地圖如何將比例尺放大到10米?

Android 手把手帶你玩轉自己定義相機

如何在JavaScript中克隆數組
)
leetcode 227. 基本計算器 II(棧)

100米隊伍,從隊伍后到前_我們的隊伍

idea使用 git 撤銷commit
pdf)
ES6標準入門(第二版)pdf

hexo博客添加暗色模式_我如何向網站添加暗模式

leetcode 331. 驗證二叉樹的前序序列化

mongodb數據可視化_使用MongoDB實時可視化開放數據

4.kafka的安裝部署

javascript初學者_針對JavaScript初學者的調試技巧和竅門

leetcode 705. 設計哈希集合

ecshop 前臺個人中心修改側邊欄 和 側邊欄顯示不全 或 導航現實不全

leetcode 706. 設計哈希映射
