pymc3使用
Visually exploring historic airline accidents, applying frequentist interpretations and validating changing trends with PyMC3.
使用PyMC3直觀地瀏覽歷史性航空事故,應用常識性解釋并驗證變化趨勢。
前言 (Preface)
On the 7th of August this year, an Air India Express flight on a repatriation mission from Dubai (United Arab Emirates) to Kozhikode (Kerala, India) skidded off the runway under heavy rainfall and fell into a valley [1].
今年8月7日,印度航空快運航班執行遣返任務,從迪拜(阿拉伯聯合酋長國)飛往科澤科德(印度喀拉拉邦),在大雨中滑出跑道并墜入山谷[1]。
The ensuing 35 foot drop broke the aircraft into two. The flight was ferrying a total of 180 souls and 18 of them lost their lives as an immediate consequence of the accident. The remaining 172 were injured to varying degrees and underwent treatment [2].
隨后的35英尺高將飛機分成兩部分。 這次飛行總共運送了180個人,其中18個人是事故的直接后果。 其余172人不同程度地受傷并接受了治療[2]。
The official probe into this horrifying accident will naturally be a fact finding mission and would try to make sense of what went wrong and who’s to blame.
官方對此可怕事件的調查自然是一項事實調查任務,并將試圖弄清出了什么問題以及應歸咎于誰。
動機 (Motivation)
Following this story, I started Googling about recent aircraft accidents, to understand the context and to look at these events from a global perspective.
跟隨這個故事,我開始谷歌搜索有關最近發生的飛機事故,以了解背景并從全球角度審視這些事件。
This search led me to numerous webpages that had photos and videos of plane crashes, tables of crash statistics, accident investigation reports and sound bites from different aviation industry experts following such catastrophic accidents.
通過搜索,我找到了許多網頁,其中包含飛機失事的照片和視頻 , 失事統計表 ,事故調查報告以及發生此類災難性事故后來自不同航空業專家的聲音。
The bottom line of this search was that we are in the midst of an increasingly safe flying environment. Regulatory, Design, Mechanical and Electronic safety measures are more stringent than ever before, thus making flying a relatively safer means of transport.
搜索的底線是我們處于一個越來越安全的飛行環境中。 法規,設計,機械和電子安全措施比以往任何時候都更加嚴格,因此使飛行成為一種相對安全的運輸方式。
But I wanted to play with these numbers myself to validate this conclusion.
但是我想自己使用這些數字來驗證這個結論。
The motivating question for this exercise was —
這項練習的動機問題是-
Has flying become relatively safer in recent times than in the past?
最近的飛行是否比過去變得相對安全?
數據源 (Data Source)
I looked at publicly available air crash data on Wikipedia and the National Transportation Safety Board (NTSB) and created a dataset that suited the needs of this exercise.
我查看了Wikipedia和國家運輸安全委員會 (NTSB)上公開可用的空難數據,并創建了適合此練習需求的數據集。
The entire exercise and dataset can be found on my GitHub repository.
整個練習和數據集可以在我的GitHub存儲庫中找到。
Switching over to the first person plural….Now.
切換到第一人稱復數…。現在。
工作工具 (Tools for the Job)
To answer the motivating question, we divide the task into two parts —
為了回答激勵性問題,我們將任務分為兩個部分:
- Exploratory Data Analysis (EDA) in Python. Python中的探索性數據分析(EDA)。
- Probabilistic programming (PyMC3) in Python. Python中的概率編程(PyMC3)。
探索性數據分析 (Exploratory Data Analysis)
In this part, we look at the aircraft crashes in the past, which forms our time series for analysis. A few things to remember -
在這一部分中,我們將查看過去的飛機失事,這構成了我們進行分析的時間序列。 需要記住的幾件事-
The Convention on International Civil Aviation differentiates an aircraft accident from an aircraft incident. The difference is essentially whether fatalities occurred or not.
在國際民用航空公約區分從飛機事故的飛機事故 。 本質上的區別在于是否發生了死亡。
Our focus in this exercise is restricted to the occurrence of the accident, rather than its cause.
我們在此練習中的重點僅限于事故的發生 ,而不是事故的原因。
- We look at commercial aircraft accidents from 1975 till 2019. 我們考察了1975年至2019年的商用飛機事故。
事故和死亡人數趨勢 (Trend of accidents and fatalities)

Looking at the historic time series, we visually sense a decline in number of accidents per year from 1978 onwards. There appears to be a minor rise in number of accidents between 1987 and 1989, after which the numbers steadily decrease. The lowest number of accidents was observed in 2017, which is considered the safest year in aviation history. After 2017, the numbers seem to increase marginally.
縱觀歷史時間序列,我們從視覺上感覺到自1978年以來每年事故數量的下降。 在1987年至1989年之間,事故數量似乎有小幅上升,此后,這一數字穩步下降。 2017年的事故發生率最低,這被認為是航空歷史上最安全的一年。 2017年之后,這個數字似乎略有增加。
Another clear trend observable is the drop in the number of fatalities over time. The 1970s and 80s were dangerous times to fly, with aircraft accidents, on an average, causing nearly 2200 fatalities a year. But over time we see that this number has dramatically reduced.
可觀察到的另一個明顯趨勢是死亡人數隨著時間的流逝而下降。 1970年代和80年代是飛行的危險時期,平均每年有飛機事故,每年造成近2200人死亡。 但是隨著時間的流逝,我們看到這個數字已經大大減少了。
When this declining trend is looked at in the context of rising number of air travellers (green shaded region in Fig. 1), we get a better picture of airline safety.
在航空旅客人數增加的背景下觀察這種下降趨勢(圖1中的綠色陰影區域),我們可以更好地了解航空公司的安全狀況。
每百萬乘客死亡人數 (Fatalities per million passengers)

When the declining number of fatalities are looked at from the perspective of rising number of air travellers, we get a clearly declining trend. The number of fatalities per million passengers travelling by air every year, has dropped drastically from 5 in a million to less than 1 in a million.
從航空旅客人數上升的角度看待死亡人數的下降,我們得到了明顯下降的趨勢。 每年每百萬乘飛機旅行的乘客中的死亡人數已從百萬分之五減少到不到百萬分之一。
(Disclaimer: Bayesians, keep that pinch of salt ready)
(免責聲明:貝葉斯主義者,請準備一點鹽)
每次事故死亡人數 (Fatalities per accident)

Another measure of aircraft safety is the number of fatalities per accident. Although there may be a number of exogenous factors (external factors) that influence the number of fatalities in a given accident — weather, nature of crash, time of day etc. — we still look at this measure as a rough estimate of aircraft safety.
飛機安全的另一項衡量標準是每次事故的死亡人數。 盡管可能有許多外來因素(外部因素)會影響給定事故中的死亡人數(天氣,墜機性質,一天中的時間等),但我們仍然將此措施視為飛機安全的粗略估計。
There seems to be a slight decrease in trend beyond 1995 but it is not immediately observable from the graph. We also see that 1985, 1996, 2014 and 2018 were fatal years involving major crashes, because the average number of fatalities per crash is large.
1995年以后趨勢似乎略有下降,但不能立即從圖中觀察到。 我們還看到1985、1996、2014和2018年是涉及重大墜機事故的致命年份,因為每起事故的平均死亡人數很高。
變化率 (Rate of change)

A final piece of evidence, before we begin the probabilistic testing of the motivating question, is the yearly rate of change of accidents.
在我們開始對動機問題進行概率測試之前,最后的證據是事故的年變化率。
If we are truly living in safe times, then we expect the graph to show a series of successively increasing green bars. Such a window was observed only in 1979–80, 1980–84, 1999–00, 2006–07 and 2013–14. Extended periods of relatively safe travel can be seen from 1980–84 and 1996–2000.
如果我們確實生活在安全時期,那么我們希望圖表顯示一系列連續增加的綠色柱。 僅在1979–80、1980–84、1999–00、2006–07和2013–14中觀察到這種窗口。 從1980-84年和1996-2000年可以看到相對安全的旅行延長了。
If we look at the rate of change beyond 1995, we see that there has largely been a decline in year-on-year accidents (very few red bars and more of green bars).
如果我們看一下1995年以后的變化率,我們發現事故率在逐年下降(紅色條很少,綠色條更多)。
It appears that some external factor (like change in aircraft design, civil aviation regulations, better ATC technology etc.) may have caused this decline beyond 1995.
看來,某些外部因素(例如飛機設計變更,民航法規,更好的空中交通管制技術等)可能導致了1995年以后的下降。
概率編程 (Probabilistic Programming)
From our data exploration we saw that there is a continued decline in number of aircraft accidents every decade and we validated this trend with a couple of statistical measures.
從我們的數據探索中,我們可以看到每十年飛機事故的數量持續下降,并且我們通過一些統計方法驗證了這一趨勢。
We also saw that 1995 was, presumably, a turning point for the aviation industry. How can we validate this assumption?
我們還看到,1995年大概是航空業的轉折點。 我們如何驗證這個假設?
One interesting technique to do so, with the limited data and non-repeatability of events (Let us assume that we can’t simulate these accidents a million times) is the use of probabilistic techniques like Markov Chain Monte Carlo (MCMC).
在數據有限且事件不可重復的情況下(例如, 假設我們無法百萬次模擬這些事故 ),一種有趣的技術是使用概率技術,例如Markov Chain Monte Carlo(MCMC)。
And one of the ways of implementing these techniques is by means of the PyMC3 library in Python.
實現這些技術的方法之一是借助Python中的PyMC3庫。
快速入門 (A quick primer)
PyMC3 is a library in Python that helps us carry out probabilistic programming. This does not mean that the programming is probabilistic (it is still a very much deterministic process!), but instead, we employ probability distributions and Bayesian methods.
PyMC3是Python中的一個庫,可幫助我們進行概率編程。 這并不意味著編程是概率性的( 它仍然是一個非常確定性的過程! ),而是使用概率分布和貝葉斯方法。
This technique is built on top of a Bayesian outlook of the world. We start with a belief (called prior probability)about a certain process or a parameter and we update this belief (called posterior probability) after several thousand runs (a.k.a random sampling). This method is opposite to that of the frequentist way of looking at things (like we did in the EDA).
該技術建立在貝葉斯基礎之上 世界觀。 我們從某個過程或參數的置信度( 稱為先驗概率 )開始,經過數千次運行( 又稱為隨機抽樣 ) 后 ,我們更新此置信度( 稱為后驗概率 )。 這種方法與常看事物的方法相反( 就像我們在EDA中所做的那樣 )。
The second foundation for this process is the random sampling methods of Markov Chain Monte Carlo (MCMC). This is a set of algorithms that allows us to sample from the prior probability distributions and generate data to test our prior beliefs and update them.
此過程的第二個基礎是馬爾可夫鏈蒙特卡洛 (MCMC)的隨機抽樣方法。 這是一組算法,使我們可以從先前的概率分布中采樣并生成數據以測試我們的先前的信念并對其進行更新。
The documentation provided on the PyMC3 webpage and this hands on approach by Susan Li are excellent for a high-level understanding of the library and the techniques. The book Bayesian Methods for Hackers, by Cam Davidson-Pilon is really helpful if you are thinking of getting your hands dirty.
PyMC3 網頁上提供的文檔以及Susan Li的 這種動手操作方法對于深入了解庫和技術非常有用。 如果您打算弄臟手, Cam Davidson-Pilon的《 貝葉斯黑客方法》確實很有幫助。
好吧,讓我們測試 (Alright so let’s test)
We begin by establishing our prior beliefs about the accidents —
我們首先建立對事故的先前信念,
What kind of distribution do aircraft accidents follow?
飛機事故的后果如何?
Here we assume that the accidents follow a Poisson Distribution.
在這里,我們假設事故遵循泊松分布。
P(x|lambda) = (lambda^x)*(exp^-lambda)/(lambda!)x: number of accidents
lambda: rate of occurrence of the accident
What would be the rate of occurrence?
發生率是多少?
Given our initial assumption, we further presume that this rate of occurrence can be roughly the reciprocal of the average occurrences for the whole dataset.
給定我們最初的假設,我們進一步假設該發生率可以大致等于整個數據集平均發生率的倒數。
In other words,
換一種說法,
lambda = 1/(mean of number of accidents from 1975 to 2019)What would be the initial turning point?
最初的轉折點是什么?
The turning point is that year before which the rate of occurrence was high and after which, it became low. We initially assume that every year from 1975 to 2019 has an equal probability (drawn from a discrete uniform distribution) of being considered as a turning point.
轉折點是發生率高的那一年,之后發生率低的那一年。 我們最初假設,從1975年到2019年,每年都有相等的可能性( 從離散的均勻分布中得出 )被視為轉折點。
With these set of prior beliefs, we instantiate the model —
基于這些先驗信念,我們實例化了模型-
import pymc3 as pm
import arviz as azyears = np.arange(1975, 2020)
with pm.Model() as accident_model:

    alpha = 1/df.loc[df.year>=1975].num_crashes.mean()
    # Setting the prior belief for the inflection point
    change_point = pm.DiscreteUniform(
                    'change_point', lower=1975, upper=2020)

    # Setting prior belief for the rate of occurrence, ie, lambda, before and after inflection
    rate_before = pm.Exponential('before_change', alpha)
    rate_after = pm.Exponential('after_change', alpha)

    # Allocate appropriate Poisson rates to years before and after current
    rate = pm.math.switch(change_point >= years, rate_before, rate_after)accidents = pm.Poisson("accidents", rate, observed=df.loc[df.year>=1975].num_crashes)
And we sample these distributions using the No-U-Turn Sampler (NUTS) at least 10,000 times —
而且,我們使用“不掉頭”采樣器(NUTS)對這些分布進行了至少10,000次采樣-
with accident_model:
    trace = pm.sample(10000, return_inferencedata=False)
測試結果 (Results of the test)

We see that after sampling 10,000 times our initial belief that all years have an equal chance of being considered a turning point was updated. The result indicates that 1997 (and not 1995) is the most likely candidate for being considered a turning point in aviation accident history.
我們看到,在對我們最初認為所有年份都具有被視為轉折點的機會均等的10,000次抽樣之后,這一事實得到了更新。 結果表明, 1997年(而不是1995年)最有可能被認為是航空事故歷史的轉折點。
And the initial assumption that the rate of occurrences would be the reciprocal of the 45 year average has been updated. 1997 was considered the turning point because the rate of occurrences of accident changed from about 300 per year to 165 per year!
最初的假設是發生率將是45年平均值的倒數。 1997年被認為是轉折點,因為事故發生率從每年約300次更改為每年165次!
So how sure are these predictions?
那么這些預測有多可靠?

The USP of probabilistic programming is that predictions are made with a pinch of salt! Unlike a frequentist prediction, the predictions from the Bayesian methods come with uncertainties attached (which is more realistic).
USP概率性編程是通過少量的鹽來進行預測! 與慣常論者的預測不同,貝葉斯方法的預測帶有不確定性( 更為現實 )。
Our model shows that the 94% High Density Interval (HDI) is between 1996 and 1999, with 1997 being the mean. In other words, 1997 has a higher probability of being the turning point.
我們的模型顯示94%的高密度間隔(HDI)在1996年至1999年之間,以1997年為平均值。 換句話說,1997年成為轉折點的可能性更高。
Similar 94% HDI for the rate of occurrences before this turning point is between 295 to 312 accidents per year; and for accidents after 1997 it is between 158 and 172 accidents per year.
在此轉折點之前,每年發生295到312起事故,發生率相似,為94%。 對于1997年以后的事故,每年發生158至172起事故。
最近的過去 (Recent Past)
Since our motivating question was restricted to ‘recent times’, we apply this model to data from 2000 to 2019 (assuming the last 20 years to be recent enough).
由于我們的激勵性問題僅限于“最近的時間”,因此我們將此模型應用于2000年至2019年的數據( 假設最近20年足夠近 )。

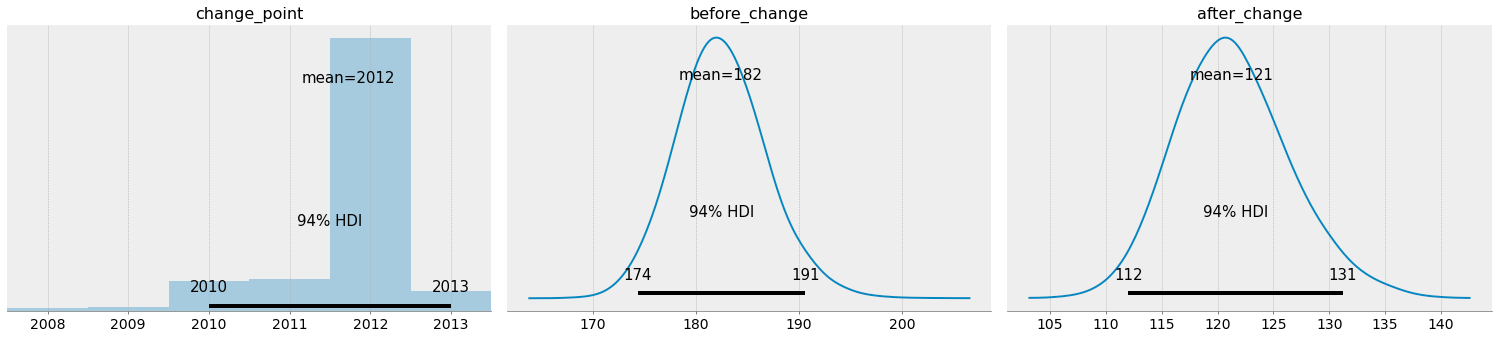
We observe that 2012 is a strong candidate for a turning point (with the 94% HDI being 2010 to 2013), with the rate of accidents being nearly 180 per year before 2012 and about 120 per year after 2012.
我們觀察到,2012年是轉折點的強勁候選者(94%的HDI為2010年至2013年),2012年之前的事故發生率每年接近180次,2012年之后的事故發生率大約每年120次。
判決 (Verdict)
So by carrying out this small exercise, I was able to satisfy my curiosity and answer the motivating question —
因此,通過進行這一小練習,我就能滿足我的好奇心并回答了這個激勵性的問題-
If low rates of aviation accidents per year are the sole indicators of aviation safety, then after 1997, the rates have significantly reduced and in the last 20 years the numbers have dropped further beyond 2012.
如果說每年的航空事故低發生率是航空安全的唯一指標,那么在1997年之后,發生率大大降低了,在過去的20年中,這一數字進一步下降到2012年以后。
Despite the low number of accidents every year, it is relatively safer to fly right now than it was 20 years ago.
盡管每年發生的事故較少,但現在飛行比20年前相對安全。
翻譯自: https://towardsdatascience.com/understanding-aircraft-accidents-trends-with-pymc3-b1ca0e4c5d33
pymc3使用
本文來自互聯網用戶投稿,該文觀點僅代表作者本人,不代表本站立場。本站僅提供信息存儲空間服務,不擁有所有權,不承擔相關法律責任。 如若轉載,請注明出處:http://www.pswp.cn/news/391567.shtml 繁體地址,請注明出處:http://hk.pswp.cn/news/391567.shtml 英文地址,請注明出處:http://en.pswp.cn/news/391567.shtml
如若內容造成侵權/違法違規/事實不符,請聯系多彩編程網進行投訴反饋email:809451989@qq.com,一經查實,立即刪除!相關文章

視頻監控業務上云方案解析
)
leetcode 341. 扁平化嵌套列表迭代器(dfs)

爬蟲結果數據完整性校驗

go map數據結構

吳恩達神經網絡1-2-2_圖神經網絡進行藥物發現-第2部分

android初學者_適用于初學者的Android廣播接收器

Android熱修復之 - 阿里開源的熱補丁
)
leetcode 456. 132 模式(單調棧)

seaborn分類數據可視:散點圖|箱型圖|小提琴圖|lv圖|柱狀圖|折線圖

數據圖表可視化_數據可視化十大最有用的圖表

javascript實現自動添加文本框功能

從Mysql slave system lock延遲說開去

傳智播客全棧_播客:從家庭學生到自學成才的全棧開發人員
)
leetcode 82. 刪除排序鏈表中的重復元素 II(map)

python 列表、字典多排序問題

接facebook廣告_Facebook廣告分析

如何創建自定義進度欄

基于SpringBoot的CodeGenerator

