一、線性關系數據可視化lmplot( )
表示對所統計的數據做散點圖,并擬合一個一元線性回歸關系。
lmplot(x, y, data, hue=None, col=None, row=None, palette=None,col_wrap=None, height=5, aspect=1,markers="o",
? ? sharex=True,sharey=True, hue_order=None, col_order=None,row_order=None,legend=True, legend_out=True,
? ? ? ? ? x_estimator=None, x_bins=None,x_ci="ci", scatter=True, fit_reg=True, ci=95, n_boot=1000,units=None, order=1,
? ? ? ? ? logistic=False, lowess=False, robust=False,logx=False, x_partial=None, y_partial=None, truncate=False,x_jitter=None,
? ? ? ? ? y_jitter=None, scatter_kws=None, line_kws=None,?size=None)
- x和y 表示顯示x和y的線性關系
- hue 表示對x按照hue進行分類,每個分類都在同一個圖表顯示
- hue_order 按照hue分類后,多分類的結果進行篩選和顯示排序
- col和row 表示對hue的分類拆分為多個圖表顯示,或者對x按照col分類并拆分為多個橫向的獨立圖表、或者對x按照row分類并拆分為多個豎直的獨立圖表
- col_order和row_order 按照col和row分類拆分后,多分類進行刪選和顯示排序
- col_wrap 每行顯示的圖表個數
- height 每個圖表的高度(最后一個參數size即height,size正被height替代)
- aspect 每個圖表的長寬比,默認為1即顯示為正方形
- marker 點的形式,
- sharex和sharey 拆分為多個圖表時是否共用x軸和y軸,默認共用
- x_jitter和y_jitter 給x軸和y軸隨機增加噪點
#hue分類,col圖表拆分
sns.lmplot(x="tip", y="total_bill",data=tips,hue='smoker',palette="Set1",ci = 80, markers = ['+','o'])  #是否吸煙在同一個圖表顯示
sns.lmplot(x="tip", y="total_bill",data=tips,hue='day',col='day',sharex=True,markers='.')  #按日期拆分為獨立的圖表
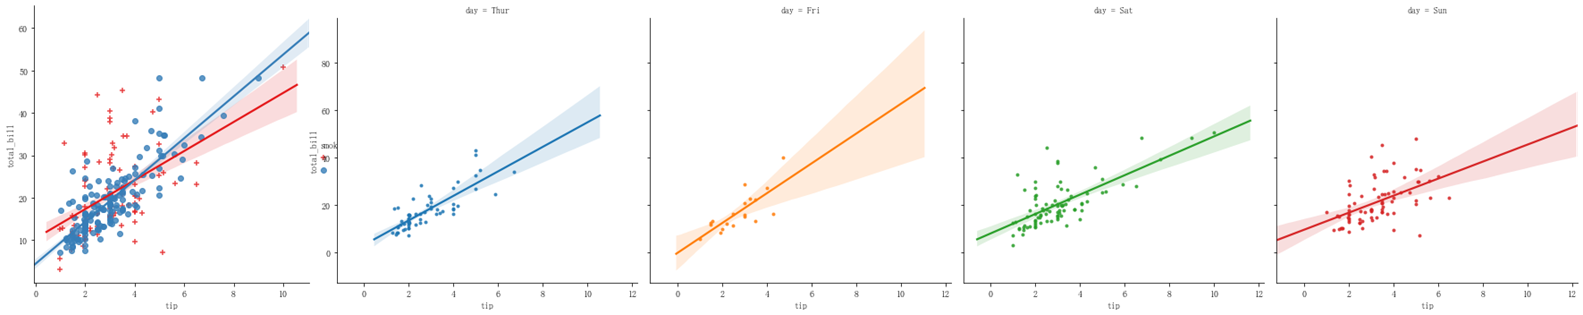
?
sns.lmplot(x="tip", y="total_bill",data=tips,col='time',row='sex',height=3) #行拆分和列拆分

二、時間線圖lineplot()
時間線圖用lineplot()表示,tsplot()正在被替代。
lineplot(x=None, y=None, hue=None, size=None, style=None, data=None, palette=None, hue_order=None, hue_norm=None,
? ? ? ? ? ? sizes=None, size_order=None, size_norm=None,dashes=True, markers=None, style_order=None,units=None,
? ? ? ? ? ? estimator="mean", ci=95, n_boot=1000,sort=True, err_style="band", err_kws=None,legend="brief", ax=None, **kwargs)
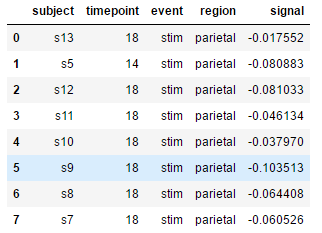
fmri = sns.load_dataset("fmri")
ax = sns.lineplot(x="timepoint", y="signal", data=fmri)
fmri.head()
 ? ?
? ?
?
三、熱圖heatmap()
熱圖只針對二維數據,用顏色的深淺表示大小,數值越小顏色越深。
heatmap(data, vmin=None, vmax=None, cmap=None, center=None, robust=False,annot=None, fmt=".2g",
? ? ? ? ? ? ? annot_kws=None,linewidths=0, linecolor="white",cbar=True, cbar_kws=None, cbar_ax=None,
? ? ? ? ? ? ? square=False, xticklabels="auto", yticklabels="auto",mask=None, ax=None, **kwargs)
- data 二維數據
- vmin和vmax 調色板的最小值和最大值
- annot 圖中是否顯示數值
- fmt 格式化數值
- linewidth和linecolor 格子線寬和顏色
- cbar 是否顯示色帶?
- cbar_kws 色帶的參數設置,字典形式,在cbar設置為True時才生效,例如{"orientation": "horizontal"}表示橫向顯示色帶
- square 每個格子是否為正方形
rng = np.random.RandomState(1)
df = pd.DataFrame(rng.randint(1,10,(10,12)))
fig = plt.figure(figsize=(15,6))
ax1 = plt.subplot(121)
sns.heatmap(df,vmin=3,vmax=8,linewidth=0.2,square=True)
ax2 = plt.subplot(122)
sns.heatmap(df,annot=True,square=False,cbar_kws={"orientation": "horizontal"})

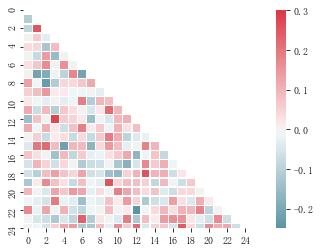
生成半邊熱圖,mask參數
rs = np.random.RandomState(33)
d = pd.DataFrame(rs.normal(size=(100, 26)))
corr = d.corr() #求解相關性矩陣表格,26*26的一個正方數據

mask = np.zeros_like(corr, dtype=np.bool)
mask[np.triu_indices_from(mask)] = True
# 設置一個“上三角形”蒙版

cmap = sns.diverging_palette(220, 10, as_cmap=True)# 設置調色盤

sns.heatmap(corr, mask=mask, cmap=cmap, vmax=.3, center=0,square=True, linewidths=0.2)
?
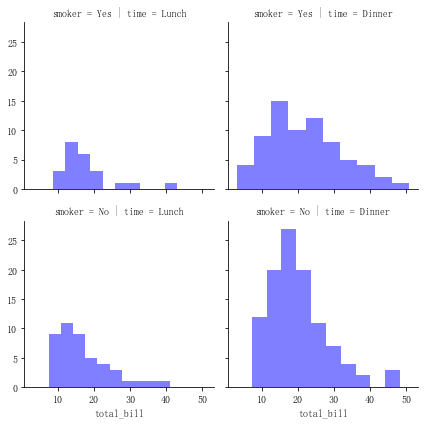
四、結構化圖表可視化
tips = sns.load_dataset("tips")  # 導入數據
g = sns.FacetGrid(tips, col="time", row="smoker")#  創建一個繪圖表格區域,列按time分類、行按smoker分類
g.map(plt.hist, "total_bill",alpha = 0.5,color = 'b',bins = 10) # 以total_bill字段數據分別做直方圖統計
?
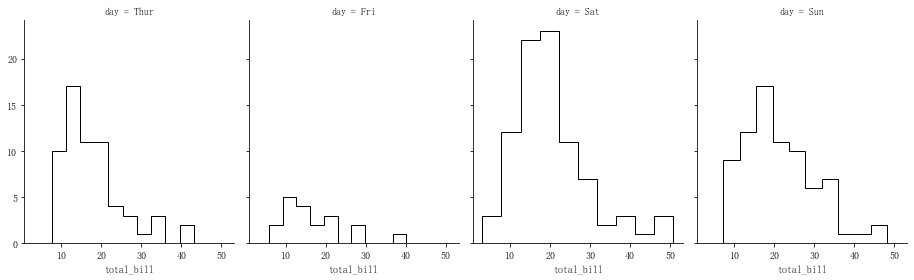
g = sns.FacetGrid(tips, col="day", height=4,    # 圖表大小aspect=.8) # 圖表長寬比

g.map(plt.hist, "total_bill", bins=10,histtype = 'step',   #'bar', 'barstacked', 'step', 'stepfilled'color = 'k')
?
#散點圖
g = sns.FacetGrid(tips, col="time",  row="smoker")g.map(plt.scatter, "total_bill", "tip",    # share{x,y} → 設置x、y數據edgecolor="w", s = 40, linewidth = 1)   # 設置點大小,描邊寬度及顏色

?
g = sns.FacetGrid(tips, col="time", hue="smoker") # 創建一個繪圖表格區域,列按col分類,按hue分類

g.map(plt.scatter, "total_bill", "tip",    # share{x,y} → 設置x、y數據edgecolor="w", s = 40, linewidth = 1)   # 設置點大小,描邊寬度及顏色
g.add_legend()

?
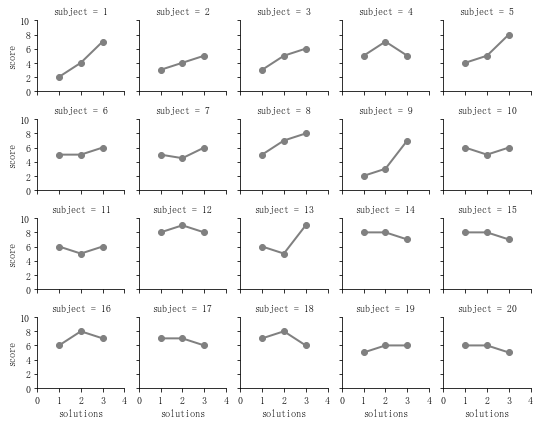
attend = sns.load_dataset("attention")
print(attend.head())g = sns.FacetGrid(attend, col="subject", col_wrap=5,# 設置每行的圖表數量size=1.5)
g.map(plt.plot, "solutions", "score", marker="o",color = 'gray',linewidth = 2)# 繪制圖表矩陣

g.set(xlim = (0,4),ylim = (0,10),xticks = [0,1,2,3,4], yticks = [0,2,4,6,8,10]) # 設置x,y軸刻度

?

的高級可視化)


——fabric-sdk-java應用)


)


)


