先知模型 facebook
什么是先知? (What is Prophet?)
“Prophet” is an open-sourced library available on R or Python which helps users analyze and forecast time-series values released in 2017. With developers’ great efforts to make the time-series data analysis be available without expert works, it is highly user-friendly but still highly customizable, even to non-expert users. How lovely!!
“ Prophet”是可在R或Python上使用的開源庫,可幫助用戶分析和預測2017年發布的時間序列值。由于開發人員的巨大努力,使得無需專家工作即可進行時間序列數據分析,用戶友好,但仍然高度可定制,甚至對非專業用戶也是如此。 多么可愛!!
In this article, starting from default model run, I tried to summarize any available tuning options, particularly useful ones, to provide better prediction, although it may not be literally everything because there are so many customizable options in Prophet! I also gave some Python example codes and cheat sheet-like exhibits.
在本文中,從默認模型運行開始,我試圖總結任何可用的調整選項,尤其是有用的調整選項,以提供更好的預測,盡管由于Prophet中有許多可自定義的選項,所以它可能并不是全部內容! 我還給出了一些Python示例代碼和類似備忘單的展覽。
目錄: (Table of Contents:)
-具有默認選項設置的快速入門代碼(在Python中) (- Quick Start Code (in Python) with Default Option Setting)
-先知選項備忘單和使用示例 (- Prophet Options Cheat Sheets And Use Examples)
- Uncertainty Options / Trend Options / Holiday Options 不確定性選項/趨勢選項/假日選項
- Seasonality Options 季節性選項
- Adding Regressors / Model Diagnostics 添加回歸器/模型診斷
-先知的背景數學 (- Background Math of Prophet)
-先知不做的事 (- What Prophet Does Not Do)
- Prophet does not allow non-Gaussian noise distribution (at the moment) 先知不允許(此時)非高斯噪聲分布
- Prophet does not take autocorrelation on residual into account 先知不考慮殘差的自相關
- Prophet does not assume stochastic trend 先知不假設隨機趨勢
-尾注 (- End Note)
具有默認選項設置的快速入門代碼(在Python中) (Quick Start Code (in Python) with Default Option Setting)
Prophet can handle;
先知可以應付;
- trend with its changepoints, 趨勢及其變化點,
- seasonality (yearly, weekly, daily, and other user-defined seasonality), 季節性(每年,每周,每天和其他用戶定義的季節性),
- holiday effect, and 假期效應,以及
- input regressors 輸入回歸
as model components, and there’s also uncertainty options to control the prediction uncertainty interval.
作為模型的組成部分,還有不確定性選項來控制預測不確定性間隔。
Here’s what Prophet default functions provide to each of the components.
這是Prophet默認功能提供給每個組件的功能。

Below is a quick-start Python code, with default setups.
以下是具有默認設置的快速入門Python代碼。
You may find everything is prepared to be user-friendly without any special care about the time-series data handling. Once you are familiar with basic Python data modeling using sklearn APIs, Prophet code should also look similar.
您可能會發現所有內容都易于使用,無需對時間序列數據處理進行任何特別護理。 熟悉使用sklearn API的基本Python數據建模后,Prophet代碼也應該看起來相似。
Data used in the exercise throughout this post is the data of log-transformed daily page views of the Wikipedia page for Peyton Manning, an American Football player, prepared and distributed by Prophet team.
在本博文中,練習中使用的數據是先知團隊準備和分發的,美國足球運動員佩頓·曼寧 ( Peyton Manning)維基百科頁面上日志轉換后的每日頁面瀏覽量數據。
import pandas as pd
import matplotlib.pyplot as pltfrom fbprophet import Prophet# Load test data: log-transformed daily page views for the Wikipedia page for Peyton Manning.
df = pd.read_csv("https://raw.githubusercontent.com/facebook/prophet/master/examples/example_wp_log_peyton_manning.csv")# Model fit
m = Prophet() #Instanticate from Prophet class.
m.fit(df) # Fit the Prophet model.# Predict
future = m.make_future_dataframe(periods=365) # Make future date data frame for the next 365 days (it gives daily because it follows the frequency in input dataframe by default).
forecast = m.predict(future) # Predict future value.# Plot results
fig1 = m.plot(forecast) # Plot the fit to past data and future forcast.
fig2 = m.plot_components(forecast) # Plot breakdown of components.
plt.show()
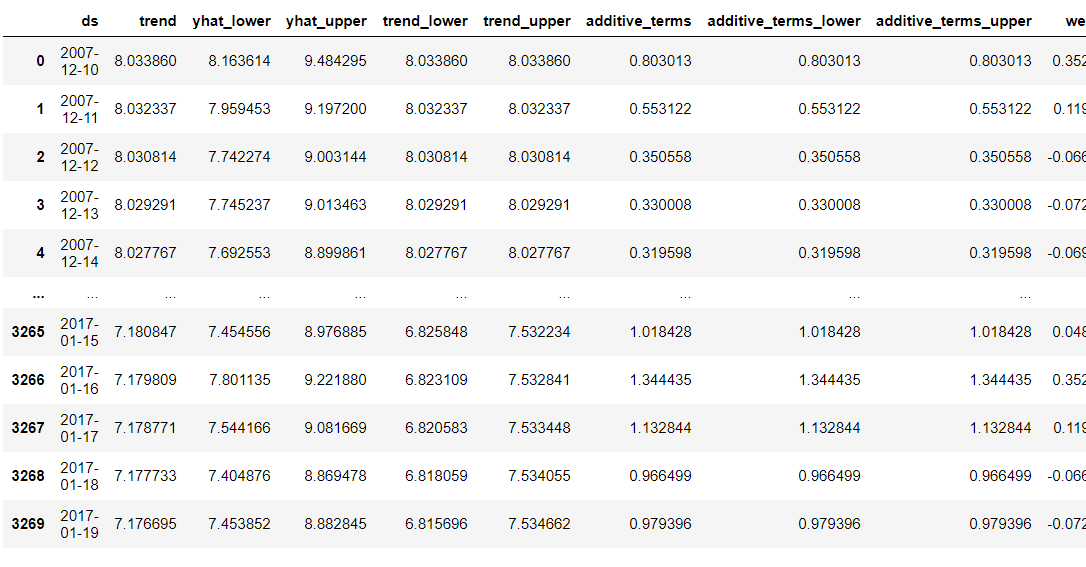
forecast # Displaying various results in table format.What I like here particularly is “make_future_dateframe” function because making a dataset for future prediction in time-series analysis is usually unpleasant moment because it requires datetime handling. Here with Prophet, just giving the length of future period will provide you the necessary dataframe.
我在這里特別喜歡的是“ make_future_dateframe”函數,因為為時序分析中的將來預測生成數據集通常是不愉快的時刻,因為它需要日期時間處理。 在先知的幫助下,只要給出未來的時長即可為您提供必要的數據框。
Here’s the set of output plots I got from the code.
這是我從代碼中獲得的一組輸出圖。

先知選項備忘單和使用示例 (Prophet Options Cheat Sheets And Use Examples)
不確定性選項/趨勢選項/假日選項 (Uncertainty Options / Trend Options / Holiday Options)
There are options to control uncertainty, trend (type (or mode), changepoint, and visualization), and holiday effect (country or user-input). Here’s a summary:
有一些選項可控制不確定性,趨勢(類型(或模式),變更點和可視化)和假日影響(國家或用戶輸入)。 總結如下:

Also, here’s a Python code example with the use of some of the options.
另外,這是一個使用某些選項的Python代碼示例。
import pandas as pd
import matplotlib.pyplot as pltfrom fbprophet import Prophet
from fbprophet.plot import add_changepoints_to_plot# Load test data: log-transformed daily page views for the Wikipedia page for Peyton Manning.
df = pd.read_csv("https://raw.githubusercontent.com/facebook/prophet/master/examples/example_wp_log_peyton_manning.csv")
df['cap'] = 10 # Saturating maximum
df['floor'] = 7 # Saturating minimum# Model setup
m = Prophet(growth='logistic')
m.add_country_holidays(country_name='US') # Adding US holiday regressor
m.fit(df) # Future data generation
future = m.make_future_dataframe(periods=365*5)
future['cap'] = 10 # Saturating maximum
future['floor'] = 7 # Saturating minimum# Future forecast
forecast = m.predict(future) # Visualize
fig1 = m.plot(forecast) # Plot the fit to past data and future forcast.
a = add_changepoints_to_plot(fig1.gca(), m, forecast)
fig2 = m.plot_components(forecast) # Plot breakdown of components.
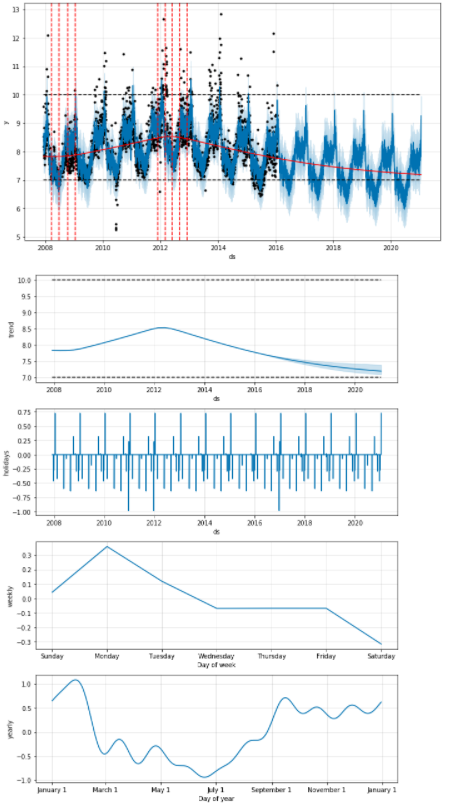
plt.show()You can see the plot now has the trade changepoints information, and the trade follow the logistic curve having floor and cap, although I don’t think it is reasonable to apply logistic trend for the data after log-transformation. See the component plots now also show the holiday effect.
您可以看到該圖現在具有交易變更點信息,并且交易遵循具有下限和上限的邏輯曲線,盡管我認為對數轉換后對數據應用邏輯趨勢并不合理。 現在查看組件圖也顯示了假日效果。
季節性選項 (Seasonality Options)
There are a lot of options in Prophet to control seasonality. Yearly, weekly, and daily seasonality and their granularity; mode of seasonality (additive/multiplicative); user-defined seasonality including conditional seasonality.
先知有很多選擇來控制季節性。 每年,每周和每天的季節性及其粒度; 季節性模式(加法/乘法); 用戶定義的季節性,包括有條件的季節性。

Here’s an example using conditional weekly seasonality.
這是一個使用有條件的每周季節性的示例。
import pandas as pd
import matplotlib.pyplot as pltfrom fbprophet import Prophet
from fbprophet.plot import add_changepoints_to_plot# Load test data: log-transformed daily page views for the Wikipedia page for Peyton Manning.
df = pd.read_csv("https://raw.githubusercontent.com/facebook/prophet/master/examples/example_wp_log_peyton_manning.csv")def is_nfl_season(ds):date = pd.to_datetime(ds)return (date.month > 8 or date.month < 2)df['on_season'] = df['ds'].apply(is_nfl_season) #on_season dummy.
df['off_season'] = ~df['ds'].apply(is_nfl_season) #off_season dummy.# set user-defined seasonality and fit
m = Prophet(weekly_seasonality=False)
m.add_seasonality(name='weekly_on_season', period=7, fourier_order=3, condition_name='on_season')
m.add_seasonality(name='weekly_off_season', period=7, fourier_order=3, condition_name='off_season')
m.fit(df)# Make the same columns to future data.
future = m.make_future_dataframe(periods=365*5) # Make future date data frame for the next 365 days (it gives daily because it follows the frequency in input dataframe by default).
future['on_season'] = future['ds'].apply(is_nfl_season)
future['off_season'] = ~future['ds'].apply(is_nfl_season)# Predict future value.
forecast = m.predict(future)# Plot results
fig1 = m.plot(forecast) # Plot the fit to past data and future forcast.
a = add_changepoints_to_plot(fig1.gca(), m, forecast)
fig2 = m.plot_components(forecast) # Plot breakdown of components.
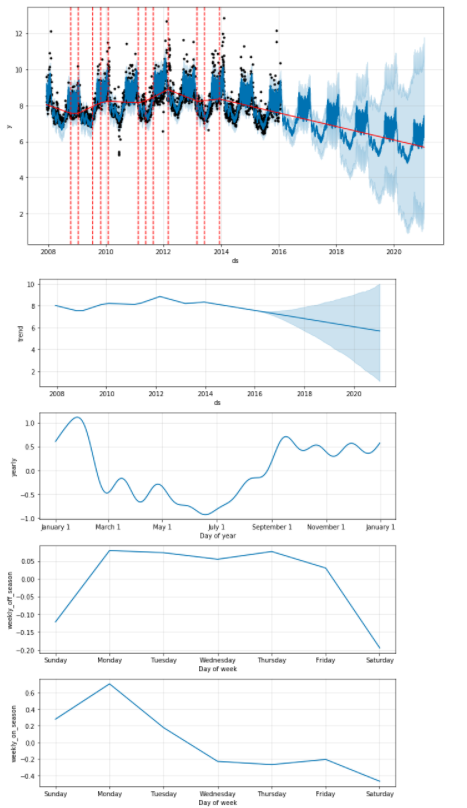
plt.show()You can find the on-season weekly seasonality and off-season weekly seasonality are also plotted (and look very different, which indicates they worth splitting.)
您會發現還繪制了季節的每周季節性和季節的每周季節性(并且看起來非常不同,表明它們值得拆分)。
添加回歸器/模型診斷 (Adding Regressors / Model Diagnostics)
Prophet also allow to input regressors (or explanatory variables, or features). Just adding columns to input data and future data and tell the model about them using ‘add_regressor’.
先知還允許輸入回歸變量(或解釋變量或特征)。 只需在輸入數據和將來的數據中添加列,然后使用“ add_regressor”將其告知模型。
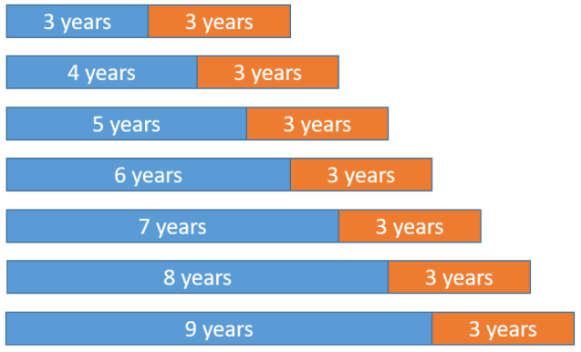
Last but not the least, Prophet has many useful functionality to do model diagnostics, cross-validation in a way of “rolling origin” (see picture on the left), and output of performance metrics.
最后但并非最不重要的一點是,Prophet具有許多有用的功能,可以進行模型診斷,以“滾動原點”的方式進行交叉驗證(參見左圖)以及性能指標的輸出。

Here’s an example using cross-validation option.
這是使用交叉驗證選項的示例。
import pandas as pd
import matplotlib.pyplot as plt
from IPython.display import displayfrom fbprophet import Prophet
from fbprophet.diagnostics import cross_validation, performance_metrics
from fbprophet.plot import add_changepoints_to_plot, plot_cross_validation_metric# Load test data: log-transformed daily page views for the Wikipedia page for Peyton Manning.
df = pd.read_csv("https://raw.githubusercontent.com/facebook/prophet/master/examples/example_wp_log_peyton_manning.csv")m = Prophet()
m.fit(df)# Execute cross validation
df_cv = cross_validation(m, initial='730 days', period='180 days', horizon = '365 days')
pm = performance_metrics(df_cv, rolling_window=0.1)
display(pm.head(),pm.tail())
fig = plot_cross_validation_metric(df_cv, metric='mape', rolling_window=0.1)
plt.show()
Here are what we get from the codes. 6 different types of metrics are shown by each time horizon, but by taking moving average over 37 days in this case (can be changed by ‘rolling_window’ option).
這是我們從代碼中得到的。 每個時間范圍都會顯示6種不同類型的指標,但是在這種情況下,可以采用37天的移動平均值(可以通過“ rolling_window”選項進行更改)。
The metrics can be also plotted so that you can check visually how things change over the time horizons.
還可以繪制度量標準,以便您可以直觀地檢查時間范圍內事物的變化。

先知的背景數學 (Background Math of Prophet)
Math in Prophet is well-discussed in their paper “Forecasting at Scale” or other Medium articles.
先知數學在他們的論文“大規模預測”或其他Medium文章中得到了充分討論。
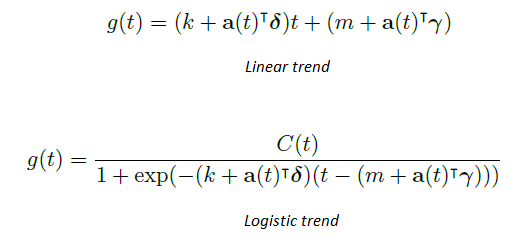
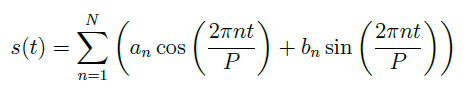
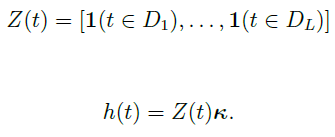
Based on “Forecasting at Scale” and their model in the Prophet module, the main formula of the model is described as follows:
基于Prophet模塊中的“大規模預測”及其模型,模型的主要公式描述如下:
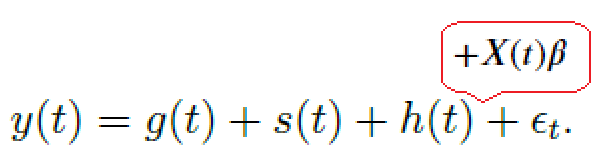
, where
,在哪里

Respectively,
分別,
I will not talk too much about the details of the formula here, just recommend reading their paper “Forecasting at Scale” once for more details.
在這里,我不會過多地討論公式的詳細信息,只建議閱讀他們的論文“大規模預測”以獲取更多詳細信息。
Any parameters are inferred using MCMC simulated on Stan — MAP estimate (Newton method or L-BFGS) or sampling depending on ‘mcmc_samples’ option.
使用在Stan — MAP估計(牛頓法或L-BFGS)上模擬的MCMC或根據“ mcmc_samples”選項進行采樣可以推斷出任何參數。
先知不做什么 (What Prophet Does Not Do)
先知不允許(此時)非高斯噪聲分布 (Prophet does not allow non-Gaussian noise distribution (at the moment))
In Prophet, noise distribution is always Gaussian and pre-transformation of y values is the only way to handle the values following skewed distribution.
在先知中,噪聲分布始終是高斯分布,并且y值的預轉換是處理傾斜分布后的值的唯一方法。
This is a topic actively discussed in one of issues of the Prophet GitHub repository here and possible code customization to allow Poisson and Negative Binomial distribution in case the target value is a count data was given in the discussion.
這是在此處的Prophet GitHub存儲庫中的一個問題中積極討論的主題,并且可能的代碼自定義以允許Poisson和負二項式分布,以防在討論中給出目標值為計數數據的情況。
先知不考慮殘差的自相關 (Prophet does not take autocorrelation on residual into account)
Since epsilon noise portion in the formula assume i.i.d. normal distribution, the residual is not assumed to have autocorrelation, unlike ARIMA model.
由于公式中的ε噪聲部分呈正態分布,因此與ARIMA模型不同,殘差不具有自相關性。
Actually, when we plot the ACF and PACF after the fit of Peyton Manning data, we will see clear AR(1) tendency — exponentially decaying ACF, high PACF at t=1 and close to zero PACF at t≥2.
實際上,當我們根據Peyton Manning數據擬合繪制ACF和PACF時,將看到清晰的AR(1)趨勢-ACF呈指數衰減,t = 1時PACF高,t≥2時PACF接近零。
# After getting forecast dataframe using user-defined seasonality "on-season"/"off-season" above...from statsmodels.graphics.tsaplots import plot_pacf, plot_acfdf['ds'] = pd.to_datetime(df['ds'],format='%Y-%m-%d')
df_res = df.merge(forecast,how="inner",on="ds")
df_res['residual'] = df_res['y'] - df_res['yhat']
plot_acf(df_res['residual'])
plot_pacf(df_res['residual'])
plt.show()
And, when I created a new data frame having lagged value and tested to add it as a regressor just like manually prepared AR(1) model, the ACF and PACF indicated the white noise’s ones, although this approach is not implemented in the Prophet therefore unable to give future prediction in a regular use of the Prophet functions.
而且,當我創建一個具有滯后值的新數據幀并像手動準備的AR(1)模型一樣進行測試以將其添加為回歸變量時,ACF和PACF會指示白噪聲,盡管先知沒有實現此方法。無法定期使用先知函數給出未來的預測 。


This topic is discussed in one of the issues of the Prophet GitHub repository here. An interesting idea from Ben Letham about MA(1) case was to use the prior time point’s residual for a regressor of next time point value. Since we do not know the true value of residual until we fit the true model, the estimation would be iterative, something like boosting. Again, in this approach the future prediction can not be given by the regular use of Prophet functions.
在此處的Prophet GitHub存儲庫中的一個問題中討論了此主題。 本·萊瑟姆(Ben Letham)關于MA(1)情況的一個有趣想法是將先前時間點的殘差用于下一時間點值的回歸。 由于在擬合真實模型之前,我們不知道殘差的真實值,因此估算將是迭代的,類似于增強。 同樣,在這種方法中,無法通過常規使用先知函數來給出未來的預測。
先知不假設隨機趨勢 (Prophet does not assume stochastic trend)
Prophet’s trend component is always deterministic+possible changepoints and it won’t assume stochastic trend unlike ARIMA. See this web page for the discussion of ‘stochastic trend vs. deterministic trend’.
先知的趨勢成分始終是確定性+可能的變化點,并且不會像ARIMA那樣假設隨機趨勢。 請參閱此網頁 ,以了解“隨機趨勢與確定性趨勢”。
Usually, we do unit root tests to know if the data is stationary or trend stationary. When rejected, we do differencing the data until we know the data is stationary, which also give stochastic trend component. Using deterministic trend (without changepoints) underestimates the uncertainty compared to stochastic trend, although Prophet looks using changepoints components and its future uncertainty to cover up that underestimate.
通常,我們進行單位根檢驗以了解數據是平穩的還是趨勢平穩的。 當被拒絕時,我們將對數據進行差異化處理,直到我們知道數據是固定的為止,這也將給出隨機趨勢分量。 與隨機趨勢相比,使用確定性趨勢(無變化點)會低估不確定性,盡管先知似乎使用變化點成分及其未來的不確定性來掩蓋這一低估。
尾注 (End Note)
Prophet has high usability with many customizable options to handle most of the necessary extensions to model the time-series data. It is well-modularized as one package so that users can enjoy them without embarrassing exposure to the math of the model.
Prophet具有很高的可用性,具有許多可自定義的選項,可以處理大多數必要的擴展,以對時間序列數據進行建模。 它作為一個組件進行了很好的模塊化,因此用戶可以在不尷尬地接觸模型數學的情況下享受它們。
Model itself is based on simple building blocks of separate components of the effects. Those effects are estimated by MCMC on Stan. This simplicity gives high visibility to each effect and should provide a great basis of discussion between experts and non-experts, although it somewhat sacrifices some of time-series modeling considerations, which are beyond the ‘building block’ approach, such as autocorrelation or stochastic trend.
模型本身基于效果的獨立組件的簡單構建塊。 MCMC對Stan估計了這些影響。 這種簡單性使每種效果都具有很高的可視性,并且應該為專家和非專家之間的討論提供良好的基礎,盡管它在某種程度上犧牲了一些時間序列建模方面的考慮,這超出了“構建模塊”方法的范圍,例如自相關或隨機性。趨勢。
翻譯自: https://medium.com/swlh/facebook-prophet-426421f7e331
先知模型 facebook
本文來自互聯網用戶投稿,該文觀點僅代表作者本人,不代表本站立場。本站僅提供信息存儲空間服務,不擁有所有權,不承擔相關法律責任。 如若轉載,請注明出處:http://www.pswp.cn/news/390891.shtml 繁體地址,請注明出處:http://hk.pswp.cn/news/390891.shtml 英文地址,請注明出處:http://en.pswp.cn/news/390891.shtml
如若內容造成侵權/違法違規/事實不符,請聯系多彩編程網進行投訴反饋email:809451989@qq.com,一經查實,立即刪除!相關文章

Java里面的靜態代碼塊

搭建Maven私服那點事

lee最短路算法_Lee算法的解釋:迷宮運行并找到最短路徑
使用GAN來創作藝術品,但這仍然值得。)
gan訓練失敗_我嘗試過(但失敗了)使用GAN來創作藝術品,但這仍然值得。

怎么樣實現對一個對象的深拷貝

19.7 主動模式和被動模式 19.8 添加監控主機 19.9 添加自定義模板 19.10 處理圖形中的亂碼 19.11 自動發現...
 C.Solution for Cube 模擬)
Codeforces Round #444 (Div. 2) C.Solution for Cube 模擬

fcc認證_介紹fCC 100:我們對2019年杰出貢獻者的年度總結

華盛頓特區與其他地區的差別_使用華盛頓特區地鐵數據確定可獲利的廣告位置...

Windows平臺下kafka環境的搭建

deeplearning.ai 改善深層神經網絡 week2 優化算法

gcc匯編匯編語言_什么是匯編語言?

鋪裝s路畫法_數據管道的鋪裝之路
)
leetcode421. 數組中兩個數的最大異或值(貪心算法)

IBM推全球首個5納米芯片:計劃2020年量產

drop sql語句_用于從表中刪除數據SQL Drop View語句
)
async 和 await的前世今生 (轉載)

項目案例:qq數據庫管理_2小時元項目:項目管理您的數據科學學習
)
react 示例_2020年的React Cheatsheet(+真實示例)
