power bi 中計算
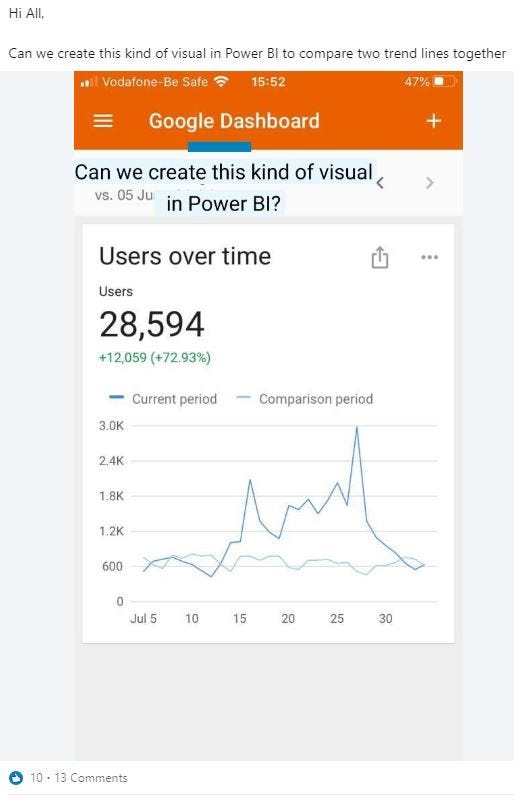
Just recently, I’ve come across a question on the LinkedIn platform, if it’s possible to create the following visualization in Power BI:
就在最近,我是否在LinkedIn平臺上遇到了一個問題,是否有可能在Power BI中創建以下可視化文件:
Since one of the common business requests is to perform different comparisons between various time periods, I would say that Power BI has a lot to offer in this regard. I’ve already explained some basic calculations related to Time Intelligence, but there are obviously a significant number of users who are not quite familiar with them.
由于常見的業務請求之一是在不同時間段之間執行不同的比較,因此我想說Power BI在這方面可以提供很多幫助。 我已經解釋了一些與時間智能有關的基本計算方法 ,但是顯然有很多用戶對它們不太熟悉。
First of all, I would like to emphasize a great feature called “Quick Measures”, where you get out-of-the-box solutions for multiple commonly used calculations, such as: Year-to-date total, Quarter-to-date total, Month-to-date total, Year-over-year change, Rolling Average, etc.
首先,我想強調一個稱為“快速度量”的出色功能,在該功能中,您將獲得針對多種常用計算的開箱即用解決方案,例如:年初至今總計,季度初至今總數,本月至今的總數,同比變化,滾動平均值等。
In order for Quick Measures to work, you need to have a properly defined Date table.
為了使“快速度量”起作用,您需要具有正確定義的“ 日期”表 。
However, we will not use Quick Measures here to achieve our original goal, so let’s switch over to a Power BI Desktop and get into the action! As usual, I will use the Contoso database for demo purposes.
但是,在這里我們不會使用“快速測量”來實現我們的原始目標,因此讓我們切換到Power BI Desktop并開始行動吧! 和往常一樣,我將使用Contoso數據庫進行演示。
制定基本措施 (Creating base measures)
The first step is to create a base measure to calculate Sales Amount:
第一步是創建一個基本度量來計算銷售金額:
Sales Amt = SUM(FactOnlineSales[SalesAmount])I will straight away create another measure, which will calculate same figures, but shifting one month back:
我將立即創建另一個度量,該度量將計算相同的數字,但將其移回一個月:
Sales Amt PM = CALCULATE([Sales Amt],
                        DATEADD(DimDate[Datekey],-1,MONTH)
                        )
There are multiple different ways to calculate this measure, but I prefer using DATEADD() function since it gives me more flexibility with shifting periods (that’s an official excuse:)…In reality, I’m coming from the SQL world, where DATEADD() is one of the most important functions when working with dates).
有多種不同的方法來計算此度量,但是我更喜歡使用DATEADD()函數,因為它為我提供了更靈活的移位周期(這是官方的借口:)……實際上,我來自SQL世界,其中DATEADD( )是處理日期時最重要的功能之一)。
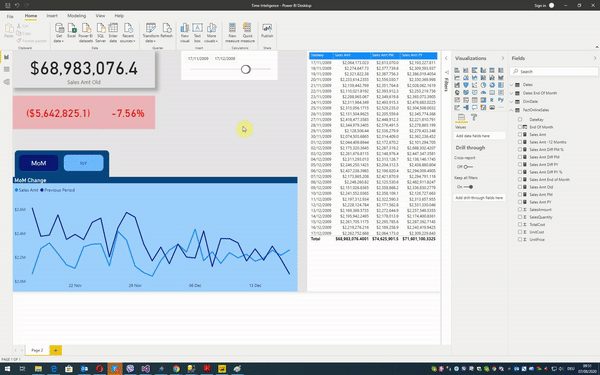
Now, when I choose dates between November 17th and December 17th, I can see how my numbers correlate between themselves:
現在,當我選擇11月17日至12月17日之間的日期時,可以看到我的數字之間的相互關系:

As you may notice, our formulas work well — as intended, we see that Sales Amt PM for December 17th, matches Sales Amt for November 17th. Also, our Line chart nicely visualizes trends for easier comparison, while Card visuals in the upper left corner show Sales Amount for the selected period and difference between two periods which we are comparing.
您可能會注意到,我們的公式運行良好-按預期,我們看到12月17日的Sales Amt PM與11月17日的Sales Amt相匹配。 同樣,我們的折線圖很好地可視化了趨勢,以便于比較,而左上角的卡片視覺效果則顯示了所選期間的銷售額和我們正在比較的兩個期間之間的差異。
For those differences, I’ve created two additional measures:
對于這些差異,我創建了兩個附加度量:
Sales Amt Diff PM = [Sales Amt] - [Sales Amt PM]
Sales Amt Diff  PM % = DIVIDE([Sales Amt],[Sales Amt PM],BLANK()) - 1
Lower Card is conditionally formatted based on the values, so it goes red when we are performing worse than in the previous period, while it shows green when the outcome is the opposite:
Lower Card是根據值有條件格式化的,因此當我們的表現比上一時期差時,它會變成紅色,而當結果相反時,它會變成綠色:

添加更多成分 (Adding more ingredients)
Now, that’s fine and you saw how we could easily answer the original question. However, I wanted to add some more ingredients here and enable our users to choose between MoM (Month-over-month) and YoY (Year-over-year) comparison.
現在,這很好,您看到了我們如何輕松回答原始問題。 但是,我想在此處添加更多成分,并使我們的用戶可以在MoM(按月)和同比(按年)比較之間進行選擇。
In our example, if we choose again dates between November 17th and December 17th, instead of showing me values from the previous month (comparing December 17th and November 17th), with YoY comparison I want to compare December 17th 2009 with December 17th 2008!
在我們的示例中,如果我們再次選擇11月17日至12月17日之間的日期,而不是顯示上個月的值(與12月17日和11月17日相比),那么,我想將2009年12月17日與2008年12月17日進行比較!
So, let’s create a measure for this. Again, you can use different functions to achieve this, like SAMEPERIODLASTYEAR() function, but I want to keep consistency and therefore I will again use DATEADD():
因此,讓我們為此制定一個措施。 同樣,您可以使用不同的函數來實現這一點,例如SAMEPERIODLASTYEAR()函數,但是我想保持一致性,因此我將再次使用DATEADD():
Sales Amt PY = CALCULATE([Sales Amt],
                        DATEADD(DimDate[Datekey],-1,YEAR)
                        )
Same as for MoM calculations, two additional measures are needed to calculate differences for YoY figures:
與MoM計算相同,需要另外兩項措施來計算同比數據差異:
Sales Amt Diff PY = [Sales Amt] - [Sales Amt PY]
Sales Amt Diff PY % = DIVIDE([Sales Amt],[Sales Amt PY],BLANK()) - 1
I will then create two bookmarks, so that users can navigate to MoM or YoY, by clicking on respective buttons:
然后,我將創建兩個書簽,以便用戶可以通過單擊相應的按鈕來導航至MoM或YoY:

By default, they should see MoM comparison, but as soon as they click on YoY button, the report will look slightly different:
默認情況下,他們應該看到MoM比較,但是一旦他們點擊“同比”按鈕,報告就會看起來有些不同:

You can notice that numbers in the card visuals changed to reflect YoY difference calculation, while Line chart also shows different trends!
您會注意到,卡片視覺效果中的數字已更改為反映同比差異計算,而折線圖也顯示了不同的趨勢!
Before we conclude, here is the final behavior of our report:
在得出結論之前,這是我們報告的最終行為:
結論 (Conclusion)
As we saw, Power BI is quite a powerful tool when it comes to time intelligence calculations. Basically, all kinds of comparisons between different periods can be created — most common ones even without needing to write a single line of DAX!
如我們所見,在時間智能計算方面,Power BI是一個功能強大的工具。 基本上,可以創建不同時期之間的各種比較-即使不需要編寫DAX行,也可以進行最常見的比較!
If you need to expand on built-in Quick Measures, there is a whole range of useful Time Intelligence functions. You can check all of them in more depth here.
如果您需要擴展內置的“快速測量”,則有很多有用的時間智能功能。 您可以在此處更深入地檢查它們。
Thanks for reading!
謝謝閱讀!
翻譯自: https://towardsdatascience.com/period-comparisons-in-power-bi-7cc46705d663
power bi 中計算
本文來自互聯網用戶投稿,該文觀點僅代表作者本人,不代表本站立場。本站僅提供信息存儲空間服務,不擁有所有權,不承擔相關法律責任。 如若轉載,請注明出處:http://www.pswp.cn/news/390757.shtml 繁體地址,請注明出處:http://hk.pswp.cn/news/390757.shtml 英文地址,請注明出處:http://en.pswp.cn/news/390757.shtml
如若內容造成侵權/違法違規/事實不符,請聯系多彩編程網進行投訴反饋email:809451989@qq.com,一經查實,立即刪除!相關文章


CentOS 7 安裝 JDK

javascript 布爾_JavaScript布爾說明-如何在JavaScript中使用布爾

如何進行數據分析統計_對您不了解的數據集進行統計分析

經典:區間dp-合并石子

常見排序算法_解釋的算法-它們是什么以及常見的排序算法

020-Spring Boot 監控和度量

matplotlib布局_Matplotlib多列,行跨度布局

Hadoop生態系統

javascript之 原生document.querySelector和querySelectorAll方法

RDBMS數據定時采集到HDFS

單詞嵌入_神秘的文本分類:單詞嵌入簡介

使用Hadoop所需要的一些Linux基礎

python多項式回歸_Python從頭開始的多項式回歸

《Linux命令行與shell腳本編程大全 第3版》Linux命令行---4

徹底搞懂 JS 中 this 機制

?如何在2分鐘內將GraphQL服務器添加到RESTful Express.js API

leetcode 1744. 你能在你最喜歡的那天吃到你最喜歡的糖果嗎?

